1.配置8台虚拟机 es[1:5],kibana,logstash,web ip 192.168.1.61-68
2.开始配置ip和主机名
3.用ansible部署elasticsearch,并能访问网页,以下是ansible部署的yml代码


 1 ---
 2 - hosts: es
 3   remote_user: root
 4   tasks:
 5     - copy:
 6         src: local.repo
 7         dest: /etc/yum.repos.d/local.repo
 8         owner: root
 9         group: root
10         mode: 0644
11     - name: install elasticsearch
12       yum:
13         name: java-1.8.0-openjdk,elasticsearch
14         state: installed
15     - template:
16         src: elasticsearch.yml
17         dest: /etc/elasticsearch/elasticsearch.yml
18         owner: root
19         group: root
20         mode: 0644
21       notify: reload elasticsearch
22       tags: esconf
23     - service:
24         name: elasticsearch
25         enabled: yes
26   handlers:
27     - name: reload elasticsearch
28       service:
29         name: elasticsearch
30         state: restarted
4.以下是当前要改的 hosts
192.168.1.61 es1
192.168.1.62 es2
192.168.1.63 es3
192.168.1.64 es4
192.168.1.65 es5
192.168.1.66 kibana
192.168.1.67 logstash
5.yum源有相应的软件包和依赖包即可
6.以下是当前要改的 elasticsearch.yml
 1 # ======================== Elasticsearch Configuration =========================
 2 #
 3 # NOTE: Elasticsearch comes with reasonable defaults for most settings.
 4 #       Before you set out to tweak and tune the configuration, make sure you
 5 #       understand what are you trying to accomplish and the consequences.
 6 #
 7 # The primary way of configuring a node is via this file. This template lists
 8 # the most important settings you may want to configure for a production cluster.
 9 #
10 # Please see the documentation for further information on configuration options:
11 # <http://www.elastic.co/guide/en/elasticsearch/reference/current/setup-configuration.html>
12 #
13 # ---------------------------------- Cluster -----------------------------------
14 #
15 # Use a descriptive name for your cluster:
16 #
17 cluster.name: nsd1810
18 #
19 # ------------------------------------ Node ------------------------------------
20 #
21 # Use a descriptive name for the node:
22 #
23 node.name: {{ansible_hostname}}
24 #
25 # Add custom attributes to the node:
26 #
27 # node.rack: r1
28 #
29 # ----------------------------------- Paths ------------------------------------
30 #
31 # Path to directory where to store the data (separate multiple locations by comma):
32 #
33 # path.data: /path/to/data
34 #
35 # Path to log files:
36 #
37 # path.logs: /path/to/logs
38 #
39 # ----------------------------------- Memory -----------------------------------
40 #
41 # Lock the memory on startup:
42 #
43 # bootstrap.mlockall: true
44 #
45 # Make sure that the `ES_HEAP_SIZE` environment variable is set to about half the memory
46 # available on the system and that the owner of the process is allowed to use this limit.
47 #
48 # Elasticsearch performs poorly when the system is swapping the memory.
49 #
50 # ---------------------------------- Network -----------------------------------
51 #
52 # Set the bind address to a specific IP (IPv4 or IPv6):
53 #
54 network.host: 0.0.0.0
55 #
56 # Set a custom port for HTTP:
57 #
58 # http.port: 9200
59 #
60 # For more information, see the documentation at:
61 # <http://www.elastic.co/guide/en/elasticsearch/reference/current/modules-network.html>
62 #
63 # --------------------------------- Discovery ----------------------------------
64 #
65 # Pass an initial list of hosts to perform discovery when new node is started:
66 # The default list of hosts is ["127.0.0.1", "[::1]"]
67 #
68 discovery.zen.ping.unicast.hosts: ["es1", "es2", "es3"]
69 #
70 # Prevent the "split brain" by configuring the majority of nodes (total number of nodes / 2 + 1):
71 #
72 # discovery.zen.minimum_master_nodes: 3
73 #
74 # For more information, see the documentation at:
75 # <http://www.elastic.co/guide/en/elasticsearch/reference/current/modules-discovery.html>
76 #
77 # ---------------------------------- Gateway -----------------------------------
78 #
79 # Block initial recovery after a full cluster restart until N nodes are started:
80 #
81 # gateway.recover_after_nodes: 3
82 #
83 # For more information, see the documentation at:
84 # <http://www.elastic.co/guide/en/elasticsearch/reference/current/modules-gateway.html>
85 #
86 # ---------------------------------- Various -----------------------------------
87 #
88 # Disable starting multiple nodes on a single system:
89 #
90 # node.max_local_storage_nodes: 1
91 #
92 # Require explicit names when deleting indices:
93 #
94 # action.destructive_requires_name: true
7.elasticsearch搭建完成,可以用http://192.168.1.61:9200 访问检验
8.部署插件
插件装在哪一台机器上,只能在哪台机器上使用(这里安装在es5机器上面)
1)使用远程 uri 路径可以直接安装
ftp://192.168.1.254/elk/elasticsearch-head-master.zip //安装head插件
es5 bin]# ./plugin install
ftp://192.168.1.254/elk/elasticsearch-kopf-master.zip //安装kopf插件
es5 bin]# [root@es5 bin]# ./plugin install
ftp://192.168.1.254/elk/bigdesk-master.zip
//安装bigdesk插件
es5 bin]# ./plugin list //查看安装的插件
Installed plugins in /usr/share/elasticsearch/plugins:
- - head
- - kopf
- - bigdesk
2)访问head插件
- [root@room9pc01 ~]# firefox http://192.168.1.65:9200/_plugin/head
-
)访问kopf插件
- [root@room9pc01 ~]# http://192.168.1.65:9200/_plugin/kopf
4)访问bigdesk插件
- [root@room9pc01 ~]# http://192.168.1.65:9200/_plugin/bigdesk
9:安装kibana
1)在另一台主机,配置ip为192.168.1.66,配置yum源,更改主机名
2)安装kibana
- [root@kibana ~]# yum -y install kibana
- [root@kibana ~]# rpm -qc kibana
- /opt/kibana/config/kibana.yml
- [root@kibana ~]# vim /opt/kibana/config/kibana.yml
- 2 server.port: 5601
- //若把端口改为80,可以成功启动kibana,但ss时没有端口,没有监听80端口,服务里面写死了,不能用80端口,只能是5601这个端口
- 5 server.host: "0.0.0.0" //服务器监听地址
- 15 elasticsearch.url: http://192.168.1.61:9200
- //声明地址,从哪里查,集群里面随便选一个
- 23 kibana.index: ".kibana" //kibana自己创建的索引
- 26 kibana.defaultAppId: "discover" //打开kibana页面时,默认打开的页面discover
- 53 elasticsearch.pingTimeout: 1500 //ping检测超时时间
- 57 elasticsearch.requestTimeout: 30000 //请求超时
- 64 elasticsearch.startupTimeout: 5000 //启动超时
- [root@kibana ~]# systemctl restart kibana
- [root@kibana ~]# systemctl enable kibana
- Created symlink from /etc/systemd/system/multi-user.target.wants/kibana.service to /usr/lib/systemd/system/kibana.service.
- [root@kibana ~]# ss -antup | grep 5601 //查看监听端口
3)浏览器访问kibana,
- [root@kibana ~]# firefox 192.168.1.66:5601
4)点击Status,查看是否安装成功,全部是绿色的对钩,说明安装成功
5)用head插件访问会有.kibana的索引信息,如图所示:

 1 input{
 2     stdin{ codec => "json"}
 3     beats{
 4       port => 5044
 5  }
 6 file {
 7     path => ["/tmp/a.log","/tmp/b.log"]
 8     sincedb_path => "/var/lib/logstash/sincedb"
 9     start_position => "beginning"
10     type => "testlog"
11    }
12  tcp {
13   host => "0.0.0.0"
14   port => "8888"
15   type => "tcplog"
16   }
17  udp {
18      host => "0.0.0.0"
19      port => "8888"
20      type => "udplog"
21 }
22
23 syslog {
24            type => "syslog"
25 }
26
27 }
28 filter{
29  grok {
30   match => ["message", "%{COMBINEDAPACHELOG}"]
31   }}
32
33 output{
34     stdout{
35     codec => "rubydebug"
36    }
37   elasticsearch {
38     hosts => ["es1", "es2", "es3"]
39     index => "weblog"
40     flush_size => 2000
41     idle_flush_time => 10
42 }
43 }
12.
步骤二:安装Apache服务,用filebeat收集Apache服务器的日志,存入elasticsearch
1)在之前安装了Apache的主机上面安装filebeat
- [root@web~]# yum -y install filebeat
- [root@web~]# vim/etc/filebeat/filebeat.yml
- paths:
- - /var/log/httpd/access_log //日志的路径,短横线加空格代表yml格式
- document_type: apachelog //文档类型
- elasticsearch: //加上注释
- hosts: ["localhost:9200"] //加上注释
- logstash: //去掉注释
- hosts: ["192.168.1.67:5044"] //去掉注释,logstash那台主机的ip
- [root@web ~]# systemctl start filebeat
13.然后在/etc/logstash.conf中写入beats port相关配置(filebeat是给logstash的小插件,使得各服务器不用装logstash就可以自动把数据发送给logstash服务器)
14都配置好后,就可以在logstash执行/opt/logstash/bin/logstash -f /etc/logstash/logstash.conf
来进行解析数据了
并且可以用netstat -antup | grep 5044 查到 两个5044的端口 (用netstat -lntup | grep 5044只有一个)
15.访问web服务器后,logstash能收集到数据,而elastic的网页可以看到weblog,在.kibana的网页输入weblog可以看到访问的条形图
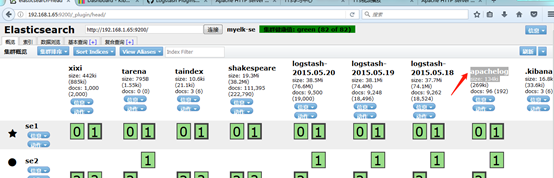
.kibana图如下
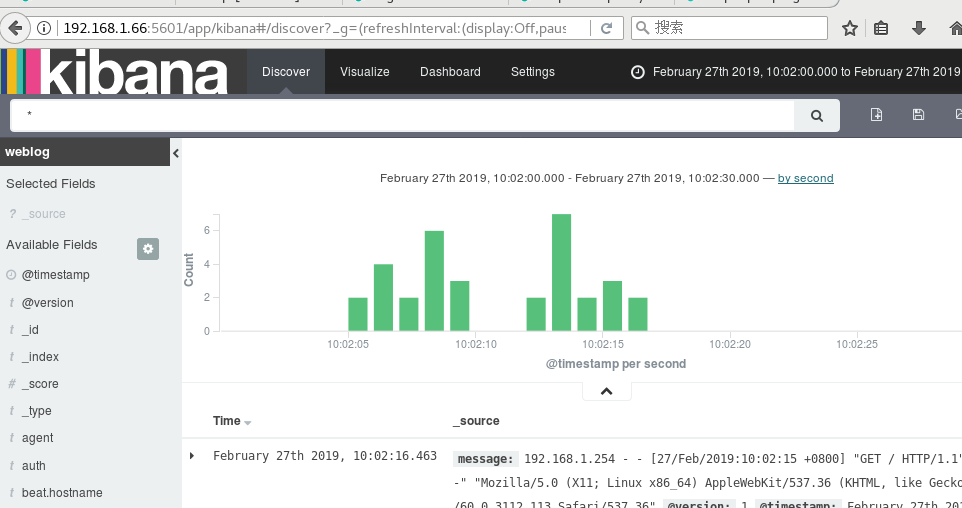
不能画出饼图,数据太少,访问网页要多刷新几次,数据太少,可能看不到图片。
上述的logstash.conf文件是用来解析httpd的log日志的如果是nginx或者是其他服务就要调用他的宏了,可以if来判断,如以下代码,提供一些思路
 1 input{
 2     stdin{ codec => "json"}
 3     beats{
 4       port => 5044
 5  }
 6 file {
 7     path => ["/tmp/a.log","/tmp/b.log"]
 8     sincedb_path => "/var/lib/logstash/sincedb"
 9     start_position => "beginning"
10     type => "testlog"
11    }
12  tcp {
13   host => "0.0.0.0"
14   port => "8888"
15   type => "tcplog"
16   }
17  udp {
18      host => "0.0.0.0"
19      port => "8888"
20      type => "udplog"
21 }
22
23 syslog {
24            type => "syslog"
25 }
26
27 }
28 filter{
29  if [type] == "httplog"{
30  grok {
31   match => ["message", "%{COMBINEDAPACHELOG}"]
32   }}
33 }
34
35 output{
36     stdout{
37     codec => "rubydebug"
38    }
39 if [type] == "httplog"{
40   elasticsearch {
41     hosts => ["es1", "es2", "es3"]
42     index => "weblog"
43     flush_size => 2000
44     idle_flush_time => 10
45 }
46 }}
elk 整体思路是 客户通过访问web,然后web服务器的filebeat把数据发送给logstash,logstash解析后发送各elasticsearch检索存储,kibana上可以从elastic提取数据并有用web和图形展示出来