一、Matplotlib 是一个 Python 的 2D绘图库,它以各种硬拷贝格式和跨平台的交互式环境生成出版质量级别的图形。
它主要用来回事图形,用来展现一些数据,更加直观的展示,让你第一眼就只要数据的呈现趋势
二、Matplotlib 的基本用法
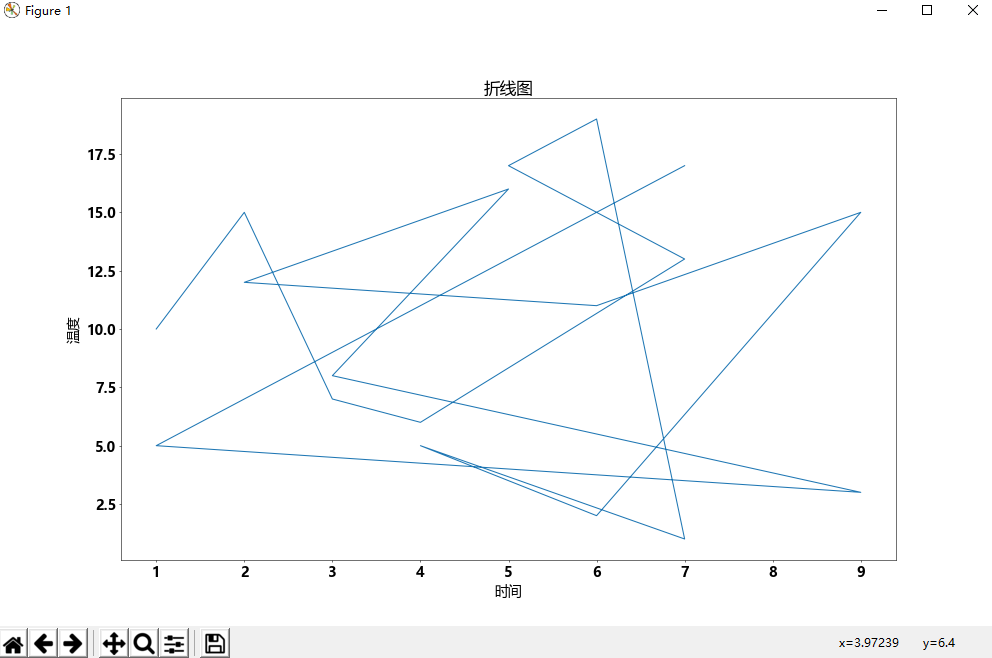
# !/usr/bin/python
# -*- coding: UTF-8 -*-
import matplotlib
from matplotlib import pyplot

x = [1, 2, 3, 4, 7, 5, 6, 7, 4, 6, 9, 6, 2, 5, 3, 9, 1, 7]
y_1 = [10, 15, 7, 6, 13, 17, 19, 1, 5, 2, 15, 11, 12, 16, 8, 3, 5, 17]
y_2 = [17, 5, 3, 8, 16, 12, 11, 15, 2, 5, 1, 19, 17, 13, 6, 7, 15, 10]

pyplot.figure(figsize=(20, 12), dpi=50)

# 调整字体
matplotlib.rc("font", family="MicroSoft YaHei",weight="bold", size=20)

# 改变刻度
# pyplot.xticks([ i + 1 for i in range(max(x))], [ "time" + str(i + 1) for i in range(max(x))], rotation=45)
# 第一个参数x轴 第二个展示的内容 rotation 旋转

# 描述
pyplot.xlabel("时间")
pyplot.ylabel("温度")
pyplot.title("折线图")

# 折线图
pyplot.plot(x, y_1)
# pyplot.plot(x, y_2)
# 散点图
# pyplot.scatter(x, y_1)
# pyplot.scatter(x, y_2)
# 柱状图
# pyplot.bar(x, y_1)
# pyplot.bar(x, y_2)
# 横版柱状图
# pyplot.barh(range(len(x)), y_1, height=0.3)
# pyplot.barh(range(len(x)), y_2, height=0.3)
# 直方图
# pyplot.hist(x, (max(x)-min(x))//1)
pyplot.xticks(range(min(x), max(x) + 1, 1))
# pyplot.grid()
# 保存图片
# pyplot.savefig("link.png")

pyplot.show()
效果:
三、NumPy系统是Python的一种开源的数值计算扩展。这种工具可用来存储和处理大型矩阵,比Python自身的嵌套列表(nested list structure)结构要高效的多(该结构也可以用来表示矩阵(matrix))。
一个用python实现的科学计算,包括:1、一个强大的N维数组对象Array;2、比较成熟的(广播)函数库;3、用于整合C/C++和Fortran代码的工具包;4、实用的线性代数、傅里叶变换和随机数生成函数。numpy和稀疏矩阵运算包scipy配合使用更加方便。
个人感觉和MATLAB很像,在数据结构和使用上面
四、基本使用方式
# !/usr/bin/python
# -*- coding: UTF-8 -*-

import numpy

# 生成数组
n = numpy.arange(10)
print(n)
print("*"*20)

# 生成数组,并做2行3列的分隔
m = numpy.array([0,1,2,3,4,5]).reshape(2, 3)
print(m)
print("*"*20)

# 生成数据,分隔成3位数组
t = numpy.arange(27).reshape(3, 3, 3)
print(t)
print("*"*20)

# 加载文本,为int方式
tx1 = numpy.loadtxt("numpy.txt", delimiter=",", dtype="int")
# 横列替换
tx2 = numpy.loadtxt("numpy.txt", delimiter=",", dtype="int", unpack=True)
print(tx1)
print(tx2)
# 1:2横截取,[1,2]为选取
tx3 = tx1[1:2,[1,2]]
print(tx3)
print("*"*20)

# 竖拼接
tx4 = numpy.vstack((tx1, tx2))
print(tx4)
# 横拼接
tx5 = numpy.hstack((tx1, tx2))
print(tx5)
print("*"*20)
numpy.txt
1,2,3
4,5,6
7,8,9
效果:
[0 1 2 3 4 5 6 7 8 9]
********************
[[0 1 2]
 [3 4 5]]
********************
[[[ 0  1  2]
  [ 3  4  5]
  [ 6  7  8]]

 [[ 9 10 11]
  [12 13 14]
  [15 16 17]]

 [[18 19 20]
  [21 22 23]
  [24 25 26]]]
********************
[[1 2 3]
 [4 5 6]
 [7 8 9]]
[[1 4 7]
 [2 5 8]
 [3 6 9]]
[[5 6]]
********************
[[1 2 3]
 [4 5 6]
 [7 8 9]
 [1 4 7]
 [2 5 8]
 [3 6 9]]
[[1 2 3 1 4 7]
 [4 5 6 2 5 8]
 [7 8 9 3 6 9]]
********************
五、pandas 是基于NumPy 的一种工具,该工具是为了解决数据分析任务而创建的。Pandas 纳入了大量库和一些标准的数据模型,提供了高效地操作大型数据集所需的工具。pandas提供了大量能使我们快速便捷地处理数据的函数和方法。你很快就会发现,它是使Python成为强大而高效的数据分析环境的重要因素之一。
强大的工具哦,主要用来做数据处理,可以分析各种数据,然后通过其他方式呈现出来。
六、基本使用方式:
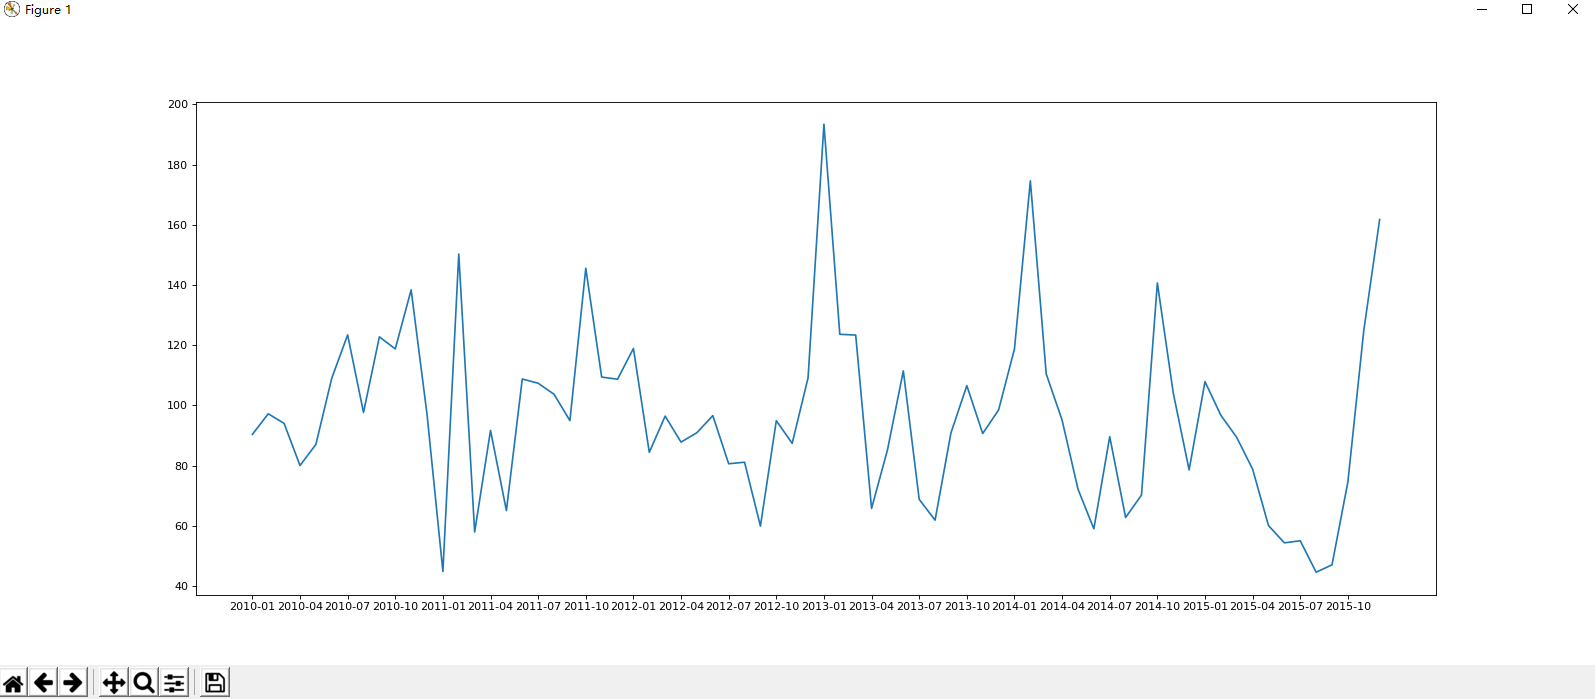
# !/usr/bin/python
# -*- coding: UTF-8 -*-
import pandas
from matplotlib import pyplot

# 读取文件
df = pandas.read_csv("BeijingPM20100101_20151231.csv")
# 展示
# print(df.head())
# print(df.info())

# 拼接时间
period = pandas.PeriodIndex(year=df["year"], month=df["month"], day=df["day"], hour=df["hour"], freq="H")
# 将时间数据赋值
df["dataTime"] = period
# 设置索引
df.set_index("dataTime", inplace=True)
# # print(period)
# print(df.head())

# 通过月份统计
df = df.resample("M").mean()

# (统计)缺失
data = df["PM_US Post"].dropna()

# pylot展示
x = data.index
y = data.values

pyplot.figure(figsize=(20, 8), dpi=80)
pyplot.plot(range(len(x)), y)
pyplot.xticks(range(0, len(x), 3), x[::3])
pyplot.show()
BeijingPM20100101_20151231.csv
数据来源:https://www.kaggle.com/uciml/pm25-data-for-five-chinese-cities
效果:
七、数据分析才是数据作用的根本出发点,matplotlib只是辅助工具,numpy才是核心,这也是做机器学习、深度学习的基础。