上一篇博文中说到Prometheus有四种指标类型:Counter(计数器)、Gauge(仪表盘)、Histogram(直方图)、Summary(摘要),并且我们做了一个Counter的Demo,接下来看看Histogram。
3、Histogram:直方图
直方图,维基百科的定义:是一种对数据分布情况的图形表示,是一种二维统计图表,它的两个坐标分别是统计样本和该样本对应的某个属性的度量,以长条图(bar)的形式具体表现。因为直方图的长度及宽度很适合用来表现数量上的变化,所以较容易解读差异小的数值。还是拿上一篇的Sample来说明,假如每个订单都有一个金额,在order时在返回值{result=true,data=1000}的data属性中返回,这里,我们就可以用直方图来收集这个金额,由于订单的金额不一样,我们就可以用直方图来展示一定范围金额内订单的数据,监控出一定金额范围内的订单比例了。就是说在一定数量的订单里,少于1000元的有多少个订单,少于2000元有多少个订单,少于3000元的有多少个订单……
首先,我们得修改BusinessController中Order Action的业务逻辑,把订单金额作为返回值:
 [HttpGet("/order")]
        public IActionResult Order(string orderno)
        {
            try
            {
                _logger.LogInformation("下单");
                //返回订单金额
                var random = new Random();
                return new JsonResult(new { Result = true, data = random.Next(1, 8000) });
            }
            catch (Exception exc)
            {
                _logger.LogCritical(exc, exc.Message);
                return new JsonResult(new
                {
                    Result = false,
                    Message = exc.Message
                });
            }
        }
这里的金额为了方便demo,是随机生成一个1到8000的随机数。
需要在MetricsHub.cs中添加Histogram类型的指标收集集合:
using Prometheus;
using System.Collections.Generic;

namespace PrometheusSample.Middlewares
{
    public class MetricsHub
    {
        private static Dictionary<string, Counter> _counterDictionary = new Dictionary<string, Counter>();
        private static Dictionary<string, Dictionary<string, Gauge>> _gaugeDictionary = new Dictionary<string, Dictionary<string, Gauge>>();
        private static Dictionary<string, Histogram> _histogramDictionary = new Dictionary<string, Histogram>();

        public Counter GetCounter(string key)
        {
            if (_counterDictionary.ContainsKey(key))
            {
                return _counterDictionary[key];
            }
            else
            {
                return null;
            }
        }
        public Dictionary<string, Gauge> GetGauge(string key)
        {
            if (_gaugeDictionary.ContainsKey(key))
            {
                return _gaugeDictionary[key];
            }
            else
            {
                return null;
            }
        }
        public Histogram GetHistogram(string key)
        {
            if (_histogramDictionary.ContainsKey(key))
            {
                return _histogramDictionary[key];
            }
            else
            {
                return null;
            }
        }
        public void AddCounter(string key, Counter counter)
        {
            _counterDictionary.Add(key, counter);
        }
        public void AddGauge(string key, Dictionary<string, Gauge> gauges)
        {
            _gaugeDictionary.Add(key, gauges);
        }
        public void AddHistogram(string key, Histogram histogram)
        {
            _histogramDictionary.Add(key, histogram);
        }
    }
}
接下来就要在BusinessMetricsMiddleware的中间件中添加处理Histogram指标的代码了:
using Microsoft.AspNetCore.Http;
using PrometheusSample.Models;
using System.IO;
using System.Threading.Tasks;

namespace PrometheusSample.Middlewares
{
    /// <summary>
    /// 请求记录中间件
    /// </summary>
    public class BusinessMetricsMiddleware
    {
        private readonly RequestDelegate _next;
        public BusinessMetricsMiddleware(RequestDelegate next)
        {
            _next = next;
        }
        public async Task InvokeAsync(HttpContext context, MetricsHub metricsHub)
        {
            var originalBody = context.Response.Body;
            try
            {
                using (var memStream = new MemoryStream())
                {
                    //从管理返回的Response中取出返回数据,根据返回值进行监控指标计数
                    context.Response.Body = memStream;
                    await _next(context);

                    memStream.Position = 0;
                    string responseBody = new StreamReader(memStream).ReadToEnd();
                    memStream.Position = 0;
                    await memStream.CopyToAsync(originalBody);
                    if (metricsHub.GetCounter(context.Request.Path) != null || metricsHub.GetGauge(context.Request.Path) != null)
                    {
                        //这里约定所有action返回值是一个APIResult类型
                        var result = System.Text.Json.JsonSerializer.Deserialize<APIResult>(responseBody, new System.Text.Json.JsonSerializerOptions { PropertyNameCaseInsensitive = true });
                        if (result != null && result.Result)
                        {
                            //获取到Counter
                            var counter = metricsHub.GetCounter(context.Request.Path);
                            if (counter != null)
                            {
                                //计数
                                counter.Inc();
                            }

                            var gauges = metricsHub.GetGauge(context.Request.Path);
                            if (gauges != null)
                            {
                                //存在增加指标+就Inc
                                if (gauges.ContainsKey("+"))
                                {
                                    gauges["+"].Inc();
                                }
                                //存在减少指标-就Dec
                                if (gauges.ContainsKey("-"))
                                {
                                    gauges["-"].Dec();
                                }
                            }
                            var histogram = metricsHub.GetHistogram(context.Request.Path);
                            if (histogram != null)
                            {
                                var parseResult = int.TryParse(result.Data.ToString(), out int i);
                                if (parseResult)
                                {
                                    histogram.Observe(i);
                                }
                            }
                        }
                    }
                }
            }
            finally
            {
                context.Response.Body = originalBody;
            }
        }
    }
}
再就是在Starsup中配置对应url的Histogram参数了:
using Microsoft.AspNetCore.Builder;
using Microsoft.AspNetCore.Hosting;
using Microsoft.Extensions.Configuration;
using Microsoft.Extensions.DependencyInjection;
using Microsoft.Extensions.Hosting;
using Microsoft.OpenApi.Models;
using Prometheus;
using PrometheusSample.Middlewares;
using PrometheusSample.Services;

using System.Collections.Generic;

namespace PrometheusSample
{
    public class Startup
    {
        public Startup(IConfiguration configuration)
        {
            Configuration = configuration;
        }

        public IConfiguration Configuration { get; }


        public void ConfigureServices(IServiceCollection services)
        {
            MetricsHandle(services);
            services.AddScoped<IOrderService, OrderService>();
            services.AddControllers();
            services.AddSwaggerGen(c =>
            {
                c.SwaggerDoc("v1", new OpenApiInfo { Title = "PrometheusSample", Version = "v1" });
            });
        }


        public void Configure(IApplicationBuilder app, IWebHostEnvironment env)
        {
            if (env.IsDevelopment())
            {
                app.UseDeveloperExceptionPage();
                app.UseSwagger();
                app.UseSwaggerUI(c => c.SwaggerEndpoint("/swagger/v1/swagger.json", "PrometheusSample v1"));
            }

            app.UseRouting();
            //http请求的中间件
            app.UseHttpMetrics();
            app.UseAuthorization();

            //自定义业务跟踪
            app.UseBusinessMetrics();

            app.UseEndpoints(endpoints =>
            {
                //映射监控地址为  /metrics
                endpoints.MapMetrics();
                endpoints.MapControllers();
            });
        }
        /// <summary>
        /// 处理监控事项
        /// </summary>
        /// <param name="services"></param>
        void MetricsHandle(IServiceCollection services)
        {
            var metricsHub = new MetricsHub();
            //counter
            metricsHub.AddCounter("/register", Metrics.CreateCounter("business_register_user", "注册用户数。"));
            metricsHub.AddCounter("/order", Metrics.CreateCounter("business_order_total", "下单总数。"));
            metricsHub.AddCounter("/pay", Metrics.CreateCounter("business_pay_total", "支付总数。"));
            metricsHub.AddCounter("/ship", Metrics.CreateCounter("business_ship_total", "发货总数。"));

            //gauge
            var orderGauge = Metrics.CreateGauge("business_order_count", "当前下单数量。");
            var payGauge = Metrics.CreateGauge("business_pay_count", "当前支付数量。");
            var shipGauge = Metrics.CreateGauge("business_ship_count", "当前发货数据。");

            metricsHub.AddGauge("/order", new Dictionary<string, Gauge> {
                { "+", orderGauge}
            });
            metricsHub.AddGauge("/pay", new Dictionary<string, Gauge> {
                {"-",orderGauge},
                {"+",payGauge}
            });
            metricsHub.AddGauge("/ship", new Dictionary<string, Gauge> {
                {"+",shipGauge},
                {"-",payGauge}
            });

            //histogram
            var orderHistogram = Metrics.CreateHistogram("business_order_histogram", "订单直方图。",
        new HistogramConfiguration
        {
            Buckets = Histogram.LinearBuckets(start: 1000,  1000, count: 5)
        });
            metricsHub.AddHistogram("/order", orderHistogram);
            services.AddSingleton(metricsHub);
        }
    }
}
Histogram.LinearBuckets(start: 1000, 1000, count: 5)是金额从1000开始,每1000为一个台阶,一共6个台阶:0~1000,1001~2000,2001~3000,3001~4000,4001~5000,还有一个是大于5000的。
最后一步,就是打开Grafana来配置展示图表了。
订单金额分布图
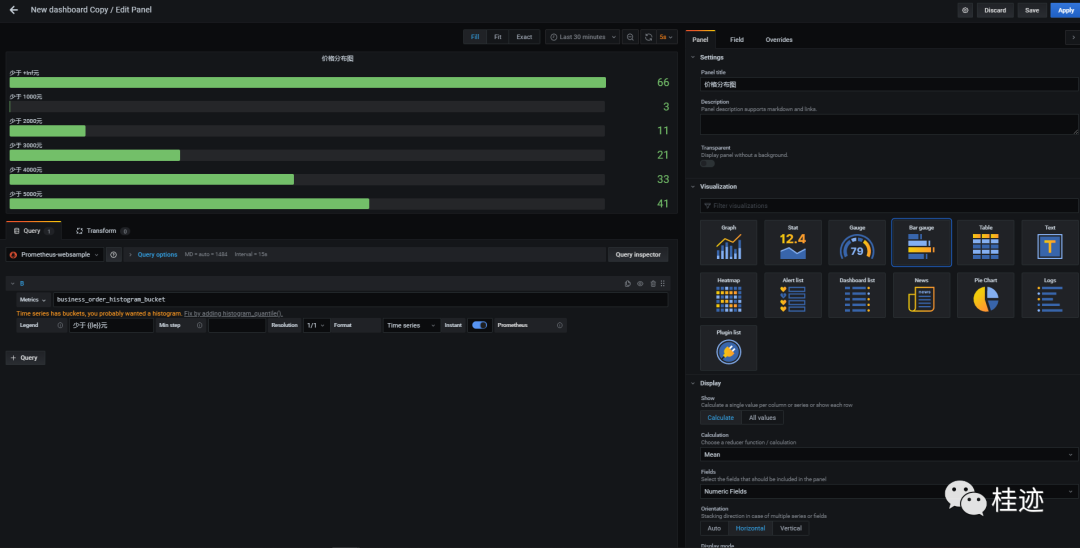
订单比例分布图
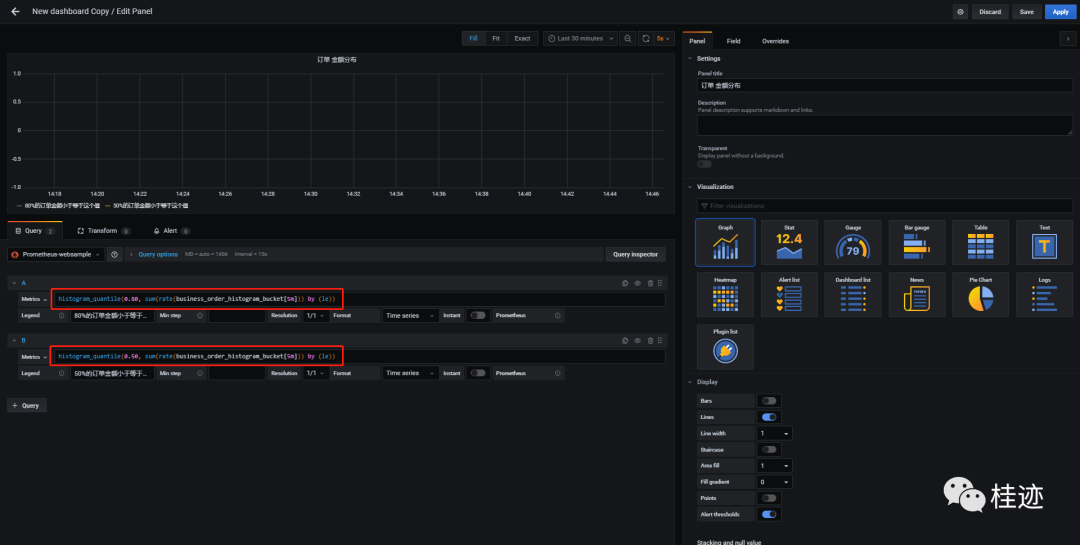
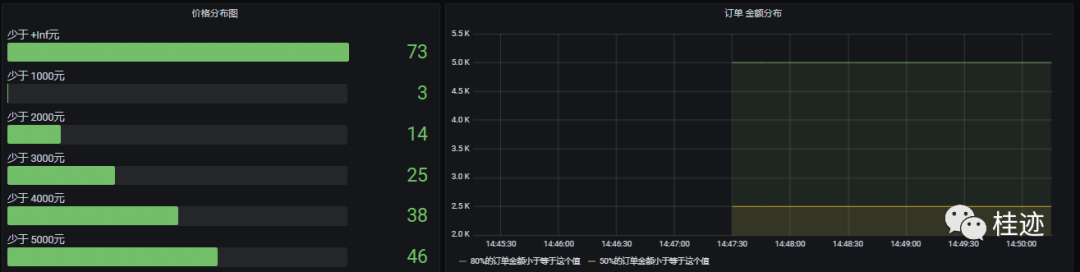
图中histogram_quantile(0.80, sum(rate(business_order_histogram_bucket[5m])) by (le))的意思是“80%的订单金额小于等于这个值”5分钟内的值。
最终展示结果:
聪明的你一定发现,这篇博文与上一篇如出一辙,是的,只是监控指标展示类型不同而以。