线图是由折线构成的图形,线图是把散点从左向右用直线连接起来而构成的图形,在以时间序列为x轴的线图中,可以看到数据增长的趋势。
geom_line(mapping = NULL, data = NULL, stat = "identity",
  position = "identity", na.rm = FALSE, show.legend = NA,
  inherit.aes = TRUE, ...)
线图中的常用参数:
- group:线的分组
- alpha:线的透明度
- color:线的颜色
- size:线的粗细
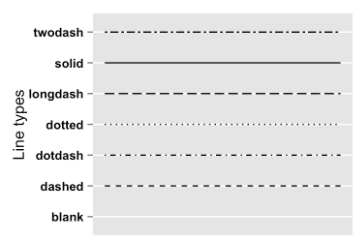
- linetype:线的类型,R中可用的类型如下图所示:
使用以下数据绘制线图:
df <- data.frame(sex = rep(c("Female", "Male"), each=3),
                  time=c("breakfeast", "Lunch", "Dinner"),
                  bill=c(10, 30, 15, 13, 40, 17) )
一,绘制线图
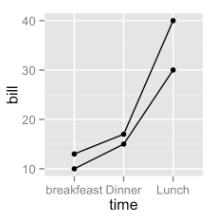
使用ggplot2包绘制线图,可以添加点的图层,以显示线的两个端点。
ggplot(data=df,mapping=aes(x=time,y=bill,group=sex))+
  geom_line()+
  geom_point()
二,修改线图的线形,颜色和大小
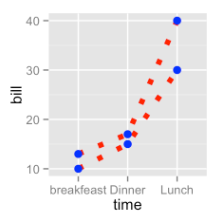
ggplot(data=df, mapping=aes(x=time, y=bill, group=sex)) +
  geom_line(linetype="dotted", color="red", size=2)+
  geom_point(color="blue", size=3)
三,对不同的线图使用不同的颜色
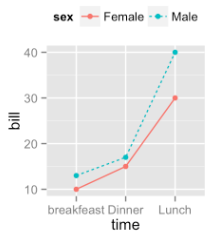
使用aes(group=)对线图分组,使用aes(color=)使不同的分组呈现同的颜色,使用aes(linetype=)使不同分组的线图呈现不同的线形,
ggplot(data=df, mapping=aes(x=time, y=bill, group=sex)) +
  geom_line(aes(linetype=sex,color=sex))+
  geom_point(aes(color=sex))+
  theme(legend.position="top")
四,自定义各个分组的线形、颜色和大小
使用以下三个函数来控制线图中的各个分组的线形、颜色和大小:
- scale_linetype_manual() :控制线形
- scale_color_manual() :控制线的颜色
- scale_size_manual() :控制线的粗细
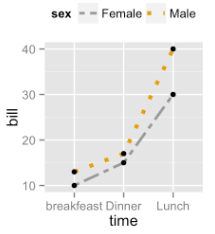
例如,以下代码用于对数据按照sex进行分组,并为每个分组的线设置color和size:
ggplot(df, aes(x=time, y=bill, group=sex)) +
  geom_line(aes(linetype=sex, color=sex, size=sex))+
  geom_point()+
  scale_linetype_manual(values=c("twodash", "dotted"))+
  scale_color_manual(values=c('#999999','#E69F00'))+
  scale_size_manual(values=c(1, 1.5))+
  theme(legend.position="top")
参考文档: