1、plink脚本
plink --file outcome --pca 3 header tabs --sheep --out pcatest > /dev/null; rm *.log *.nosex

2、R绘图
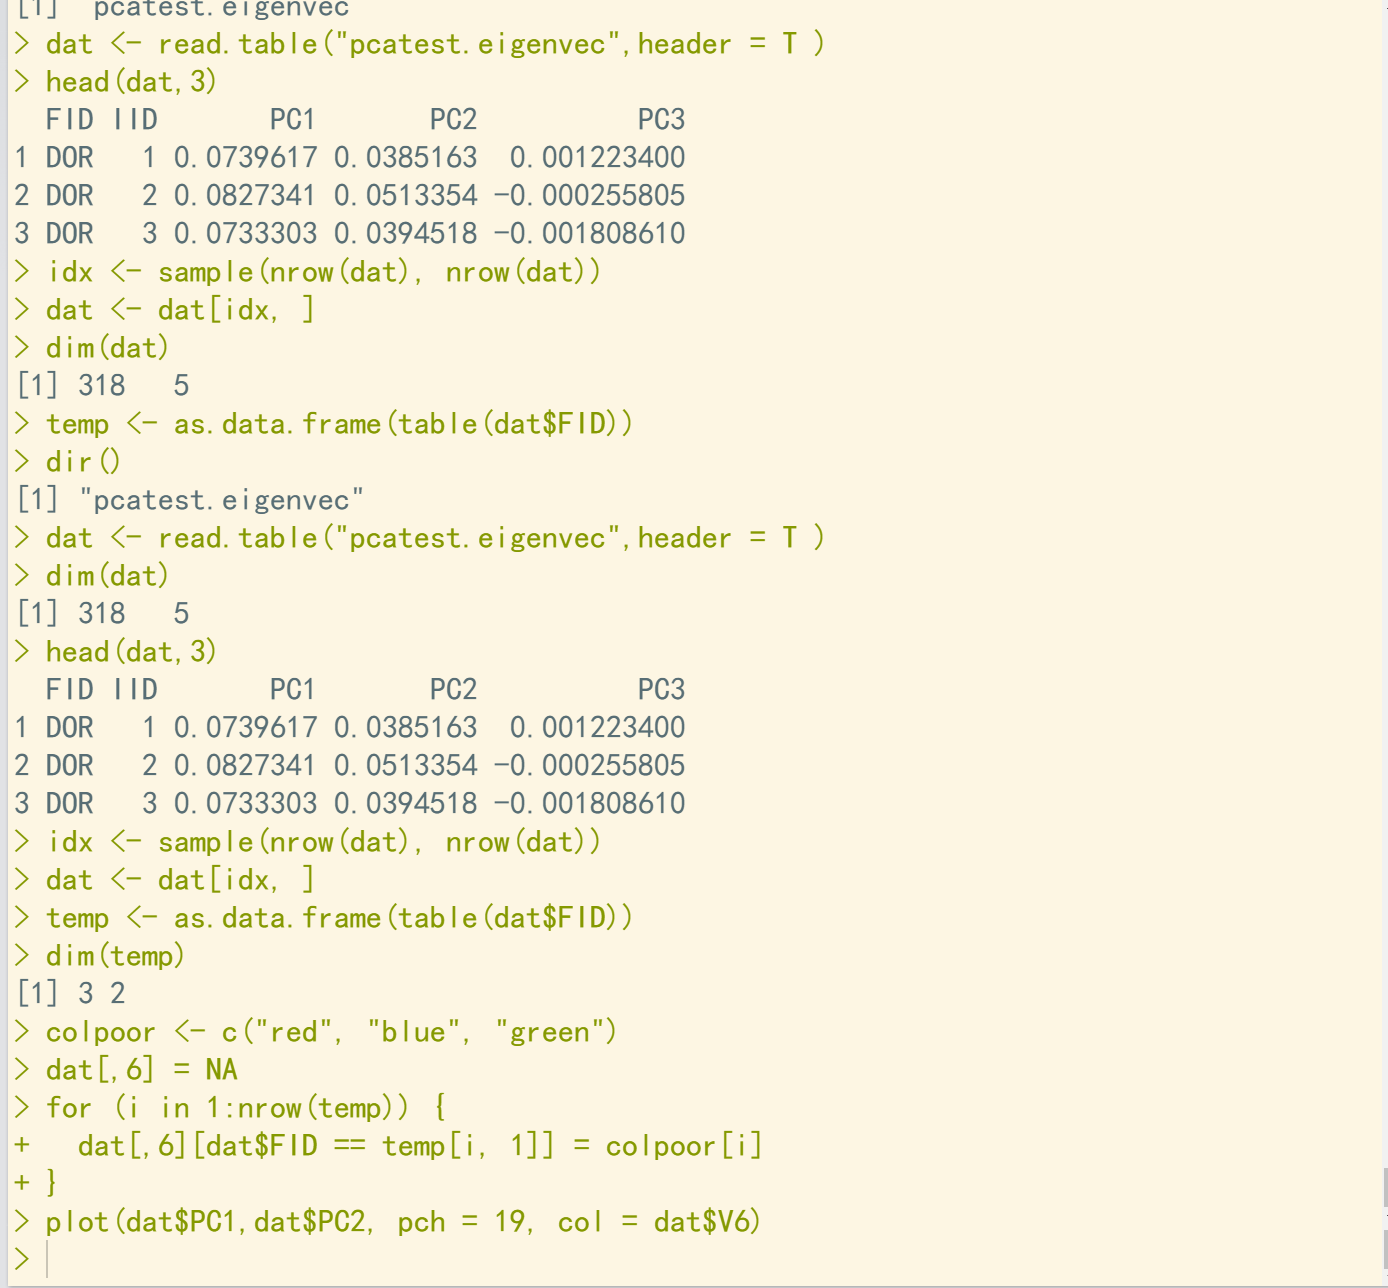
dir()
dat <- read.table("pcatest.eigenvec",header = T )
dim(dat)
head(dat,3)

idx <- sample(nrow(dat), nrow(dat))
dat <- dat[idx, ]

temp <- as.data.frame(table(dat$FID))
dim(temp)
colpoor <- c("red", "blue", "green")

dat[,6] = NA

for (i in 1:nrow(temp)) {
  dat[,6][dat$FID == temp[i, 1]] = colpoor[i]
}

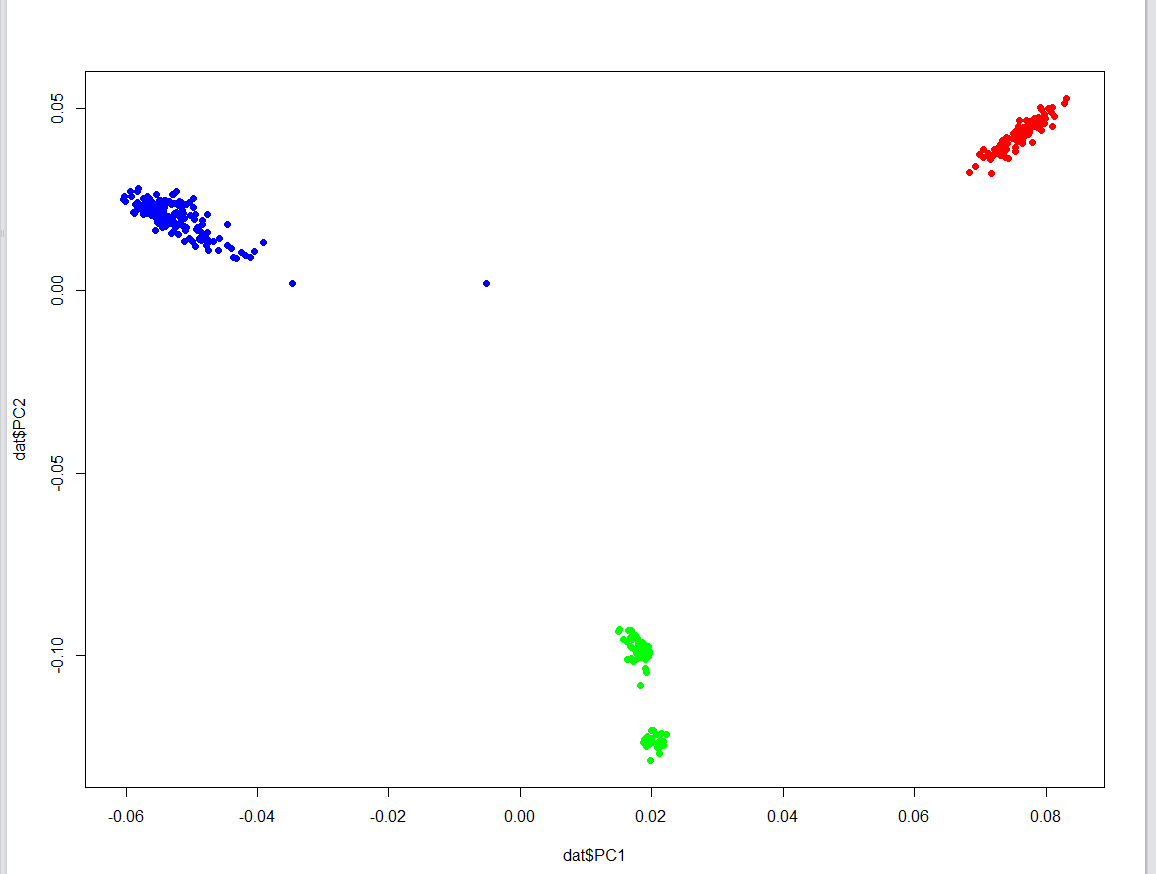
plot(dat$PC1,dat$PC2, pch = 19, col = dat$V6)

