一、概述
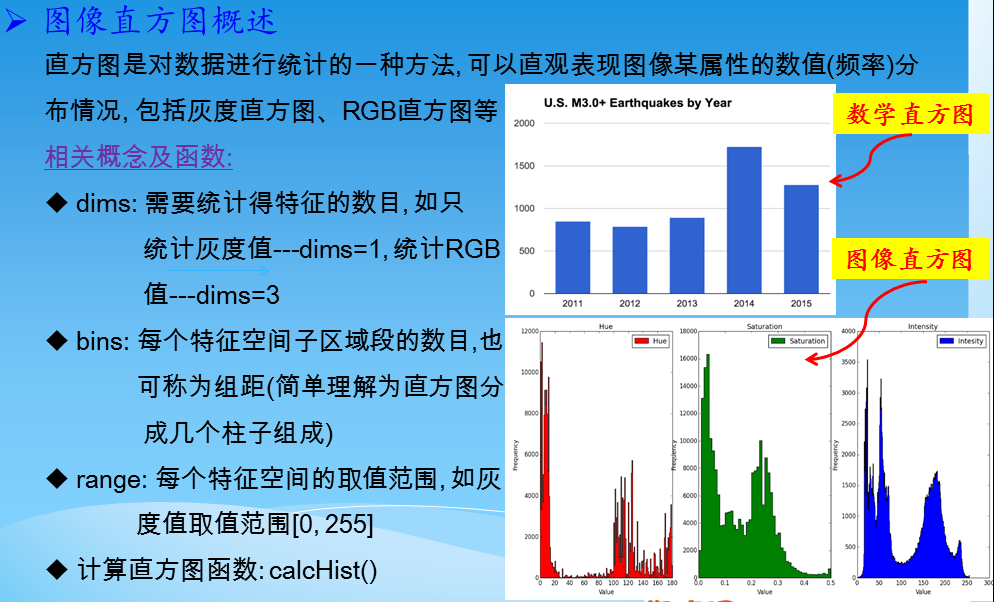
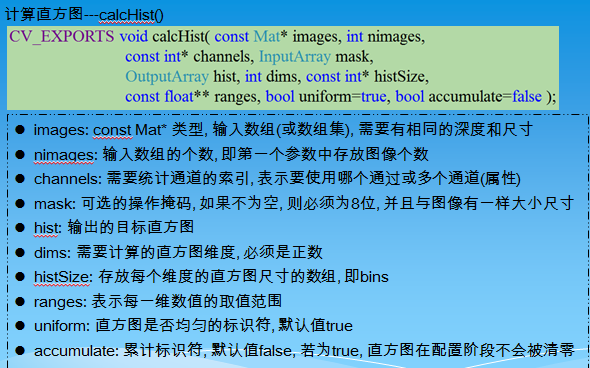
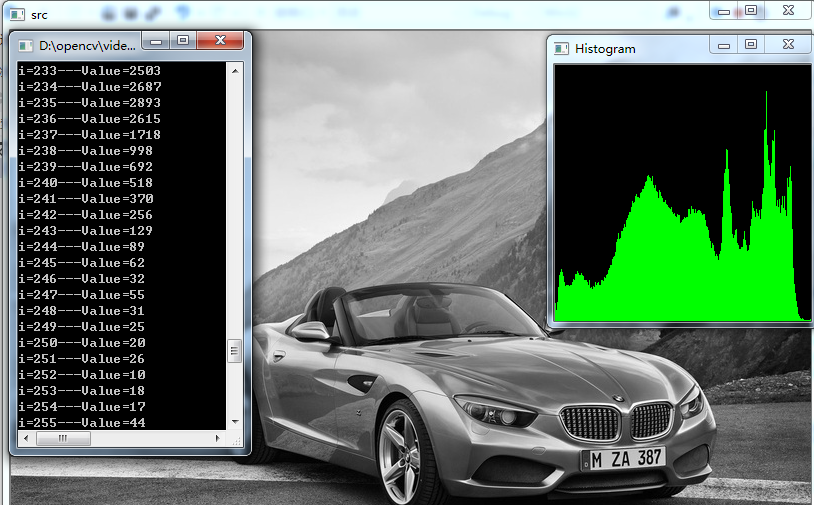
二、一维灰度直方图
 1 #include "opencv2/opencv.hpp"
 2 #include<iostream>
 3 using namespace cv;
 4 using namespace std;
 5
 6 void main()
 7 {
 8     Mat img = imread("E://0.jpg", 0);  //以灰度方式打开,灰度图和彩色图直方图结果不同
 9     imshow("src", img);
10
11     Mat dstHist;  //定义存储直方图变量
12     int dims = 1;  //需要统计的特征数目(只统计灰度值)
13     float hranges[] = {0, 256};  //范围[0,256),注意是最大值加1
14     const float* ranges[] = {hranges};
15     int bins = 256;//组距:简单理解为直方图分为几个柱子
16     int channels = 0;
17     //计算直方图
18     calcHist(&img, 1, &channels, Mat(), dstHist, dims, &bins, ranges);
19
20     int scale = 1;
21     Mat dstImg(bins * scale, bins*1, CV_8UC3, Scalar(0));  //定义直方图输出图像,长×宽
22     double minValue = 0;
23     double maxValue = 0;
24     minMaxLoc(dstHist, &minValue, &maxValue);//统计直方图dstHist的最小最大值,并返回该值位置
25     int hpt = saturate_cast<int>(0.9*bins);  //设置最大值并防止溢出
26     int j=0;
27     //绘制直方图
28     for(int i=0; i<256; i++)
29     {
30         float binValue = dstHist.at<float>(i);
31         //if(i>250)
32             cout<<"i="<<i<<"---Value="<<binValue<<endl;
33         int realValue = saturate_cast<int>(binValue*hpt/maxValue);  //归一化数据
34             //cout<<"i="<<i<<"---Value="<<realValue<<endl;
35         line(dstImg, Point(i*scale, bins-1), Point(i*scale, bins-realValue), Scalar(0, 255, 0), 1, 8);//左上角和右下角坐标,坐标系如下图所示
36         //rectangle(dstImg, Point(i*scale, bins-1), Point(i*scale+1, bins-realValue), Scalar(0, 255, 0), 1);
37         //rectangle(dstImg, Point(j*scale, bins-1), Point(j*scale+1, bins-realValue), Scalar(rand()%255, rand()%255, rand()%255), -1);
38         //rectangle(dstImg, Point(j*scale, bins-1), Point(j*scale+1, bins-realValue), Scalar(rand()%255, rand()%255, rand()%255), -1);
39         //j=j+3;
40     }
41     imshow("Histogram", dstImg);
42     waitKey(0);
43     destroyAllWindows();
44 }
 第35行代码的坐标为Point(i*scale, bins-1), Point(i*scale, bins-realValue)的原因。
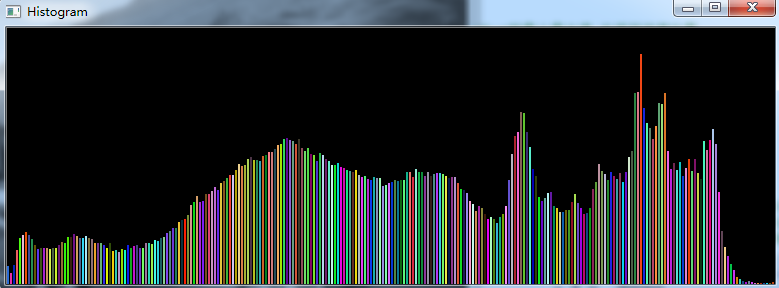
如果觉得直方图太密集了,可以调整宽度

三、不均匀灰度直方图
 1 #include "opencv2/opencv.hpp"
 2 #include<iostream>
 3 using namespace cv;
 4 using namespace std;
 5
 6 void main()
 7 {
 8     Mat img = imread("E://0.jpg",0);
 9     imshow("src", img);
10
11     Mat dstHist;
12     int channels = 0;
13     int histSize[1]={5};
14     float hranges[6]={0,50,100,150,200,256};
15     const float* ranges[1]={hranges};
16     int size=256;
17     //计算直方图
18     calcHist(&img,1,&channels,Mat(),dstHist,1,histSize,ranges,false);
19
20     int scale=1;
21     Mat dstImg(size*scale,size,CV_8UC3,Scalar(0));
22     double minValue=0;
23     double maxValue=0;
24     minMaxLoc(dstHist,&minValue,&maxValue,0,0);
25     int hpt=saturate_cast<int>(0.9*size);//设置最大值并防止溢出
26     int j=0;
27     for (int i = 0; i < 5; i++)
28     {
29         float binValue=dstHist.at<float>(i);
30         cout<<"i="<<i<<"---Value="<<binValue<<endl;
31         int realValue=saturate_cast<int>(binValue*hpt/maxValue);
32         rectangle(dstImg,Point(j*scale,size-1),Point((j+20)*scale-1,size-realValue),Scalar(0, 255, 0), -1);
33         j+=35;
34     }
35
36     imshow("Histogram", dstImg);
37     waitKey(0);
38     destroyAllWindows();
39
40 }

四、RGB三色直方图
 1 #include "opencv2/opencv.hpp"
 2 using namespace cv;
 3
 4 void main()
 5 {
 6     Mat src=imread("E://0.jpg");
 7     int bins = 256;
 8     int hist_size[] = {bins};
 9     float range[] = { 0, 256 };
10     const float* ranges[] = { range};
11     Mat hist_r,hist_g,hist_b;
12
13     int channels_r[] = {2};
14     calcHist( &src, 1, channels_r, Mat(), // do not use mask
15         hist_r, 1, hist_size, ranges,
16         true, // the histogram is uniform
17         false );
18
19     int channels_g[] = {1};
20     calcHist( &src, 1, channels_g, Mat(),hist_g, 1, hist_size, ranges,true,false);
21     int channels_b[] = {0};
22     calcHist( &src, 1, channels_b, Mat(),hist_b, 1, hist_size, ranges,true,false);
23
24     double max_val_r,max_val_g,max_val_b;
25     minMaxLoc(hist_r, 0, &max_val_r, 0, 0);
26     minMaxLoc(hist_g, 0, &max_val_g, 0, 0);
27     minMaxLoc(hist_b, 0, &max_val_b, 0, 0);
28     int scale = 1;
29     int hist_height=256;
30     Mat hist_img = Mat::zeros(hist_height, bins*3+5, CV_8UC3);
31     for(int i=0;i<bins;i++)
32     {
33         float bin_val_r = hist_r.at<float>(i);
34         float bin_val_g = hist_g.at<float>(i);
35         float bin_val_b = hist_b.at<float>(i);
36         int intensity_r = cvRound(bin_val_r*hist_height/max_val_r);  //要绘制的高度
37         int intensity_g = cvRound(bin_val_g*hist_height/max_val_g);  //要绘制的高度
38         int intensity_b = cvRound(bin_val_b*hist_height/max_val_b);  //要绘制的高度
39         rectangle(hist_img,Point(i*scale,hist_height-1),
40             Point((i+1)*scale - 1, hist_height - intensity_r),
41             CV_RGB(255,0,0));
42
43         rectangle(hist_img,Point((i+bins)*scale,hist_height-1),
44             Point((i+bins+1)*scale - 1, hist_height - intensity_g),
45             CV_RGB(0,255,0));
46
47         rectangle(hist_img,Point((i+bins*2)*scale,hist_height-1),
48             Point((i+bins*2+1)*scale - 1, hist_height - intensity_b),
49             CV_RGB(0,0,255));
50
51     }
52     imshow( "src", src );
53     imshow( "RGB Histogram", hist_img );
54
55     waitKey(0);
56     destroyAllWindows();
57
58 }

五、二维直方图
 1 #include "opencv2/opencv.hpp"
 2 using namespace cv;
 3
 4 void main()
 5 {
 6     Mat src=imread("E://0.jpg");
 7     Mat hsv;
 8     int Bbins = 256, Gbins = 256;
 9     int histSize[] = {Bbins, Gbins};
10     float hranges[] = { 0, 256 };
11     float sranges[] = { 0, 256 };
12     const float* ranges[] = { hranges, sranges };
13     Mat hist;
14
15     int channels[] = {0, 1};
16     calcHist( &src, 1, channels, Mat(), hist, 2, histSize, ranges);
17     double maxVal=0;
18     minMaxLoc(hist, 0, &maxVal, 0, 0);
19     int scale = 2;
20     Mat histImg = Mat::zeros(Bbins*(scale), Bbins*(scale), CV_8UC3);
21     for( int h = 0; h < Bbins; h++ )
22         for( int s = 0; s < Bbins; s++ )
23         {
24             float binVal = hist.at<float>(h, s);
25             //cout<<"h="<<h<<"s="<<s<<"binValue="<<binVal<<endl;
26             //int intensity = cvRound(binVal*255/maxVal);
27             int intensity = int(binVal*255/maxVal);
28             rectangle( histImg, Point(h*scale, s*scale),
29                 Point((h+1)*scale - 1, (s+1)*scale - 1),
30                 Scalar::all(intensity),CV_FILLED );
31         }
32     namedWindow( "Source", 1 );
33     imshow( "Source", src );
34     namedWindow( "B-G Histogram", 1 );
35     imshow( "B-G Histogram", histImg );
36
37     waitKey(0);
38     destroyAllWindows();
39
40 }
