虽然Logistic回归叫回归,但是其实它是一个二分类或者多分类问题
这里的话我们使用信用诈骗的数据进行分析
第一步:导入数据,Amount的数值较大,后续将进行(-1,1)的归一化
data = pd.read_csv('creditcard.csv') #读取数据#查看前5行数据
print(data.head())

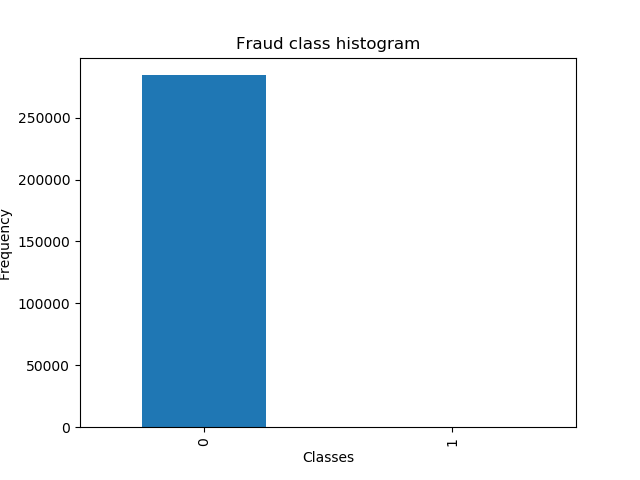
第二步: 对正常和欺诈的数目进行查看,正常样本的数目远大于欺诈样本,这个时候可以使用下采样或者过采样
# 画图查看
count_data = pd.value_counts(data['Class'], sort=True).sort_index()  #统计样本数
count_data.plot(kind='bar')  #画条形图
plt.title("Fraud class histogram")  #标题
plt.xlabel('Classes')
plt.ylabel('Frequency')
plt.show()

第三步:将amount进行归一化形成amountNorm,并且去除time和amount项
#把amount数据标准化到-1, 1 from sklearn.preprocessing import StandardScaler #reshape 需要转换到的数值范围 data['NormAmount'] = StandardScaler().fit_transform(data['Amount'].values.reshape(-1, 1),) data = data.drop(['Time', 'Amount'], axis=1) # 去除两列#进行分组
X = data.ix[:, data.columns != 'Class']
y = data.ix[:, data.columns == 'Class']
第四步,使用随机挑选来生成下采样数据
number_record_fraud = len(data[data.Class==1]) #找出其索引,组成数组 fraud_indices = np.array(data[data.Class == 1].index) norm_indices = data[data.Class == 0 ].index #从Class=0中任意挑选500个组成正常的类别 random_norm_indices = np.random.choice(norm_indices, 500, replace=False) random_norm_indices = np.array(random_norm_indices)#把正常的类别和欺诈类别进行组合
under_sample_indices = np.concatenate([fraud_indices, random_norm_indices])
#根据重组索引重新取值
under_sample_datas = data.iloc[under_sample_indices,:]
#选择出属性和结果
X_undersample = under_sample_datas.ix[:, under_sample_datas.columns != 'Class']
第5步,交叉验证选择权重,这里采用的加权方法为|L* w|
from sklearn.linear_model import LogisticRegression from sklearn.cross_validation import KFold, cross_val_score from sklearn.metrics import confusion_matrix,recall_score,classification_report def printing_Kfold_socres(x_train_data, y_train_data): fold = KFold(len(y_train_data), 5, shuffle=False)c_param_range </span>= [0.01, 0.1, 1, 10, 100<span style="color: #000000;">] </span><span style="color: #008000;">#</span><span style="color: #008000;">创建一个空的列表用来存储Mean recall score的值</span> results_table = pd.DataFrame(index=range(len(c_param_range), 2), columns=[<span style="color: #800000;">'</span><span style="color: #800000;">C_parameter</span><span style="color: #800000;">'</span>, <span style="color: #800000;">'</span><span style="color: #800000;">Mean recall score</span><span style="color: #800000;">'</span><span style="color: #000000;">]) results_table[</span><span style="color: #800000;">'</span><span style="color: #800000;">C_parameter</span><span style="color: #800000;">'</span>] =<span style="color: #000000;"> c_param_range j </span>=<span style="color: #000000;"> 0 </span><span style="color: #0000ff;">for</span> c_param <span style="color: #0000ff;">in</span><span style="color: #000000;"> c_param_range: </span><span style="color: #0000ff;">print</span>(<span style="color: #800000;">'</span><span style="color: #800000;">-----------------------</span><span style="color: #800000;">'</span><span style="color: #000000;">) </span><span style="color: #0000ff;">print</span>(<span style="color: #800000;">'</span><span style="color: #800000;">C paramter:</span><span style="color: #800000;">'</span><span style="color: #000000;">, c_param) </span><span style="color: #0000ff;">print</span>(<span style="color: #800000;">'</span><span style="color: #800000;">-----------------------</span><span style="color: #800000;">'</span><span style="color: #000000;">) </span><span style="color: #0000ff;">print</span>(<span style="color: #800000;">''</span><span style="color: #000000;">) recall_accs </span>=<span style="color: #000000;"> [] </span><span style="color: #0000ff;">for</span> iteration, indices <span style="color: #0000ff;">in</span> enumerate(fold, start=1<span style="color: #000000;">): lr </span>= LogisticRegression(C = c_param, penalty=<span style="color: #800000;">'</span><span style="color: #800000;">l1</span><span style="color: #800000;">'</span>) <span style="color: #008000;">#放入参数,权重模式为l1print('indices', indices)
#建立模型并训练
lr.fit(x_train_data.iloc[indices[0], :], y_train_data.iloc[indices[0], :].values.ravel())
y_pred_undersample = lr.predict(x_train_data.iloc[indices[1], :].values)
print(y_pred_undersample)
#计算回归得分
recall_acc = recall_score(y_train_data.iloc[indices[1],:].values, y_pred_undersample)
recall_accs.append(recall_acc)
print('Iteration', iteration, ': recall score=', recall_acc)</span><span style="color: #008000;">#</span><span style="color: #008000;">求得平均的值</span> results_table.ix[j, <span style="color: #800000;">'</span><span style="color: #800000;">Mean recall score</span><span style="color: #800000;">'</span>] =<span style="color: #000000;"> np.mean(recall_accs) j </span>+= 1 <span style="color: #0000ff;">print</span>(<span style="color: #800000;">''</span><span style="color: #000000;">) </span><span style="color: #0000ff;">print</span>(<span style="color: #800000;">'</span><span style="color: #800000;">Mean recall score</span><span style="color: #800000;">'</span><span style="color: #000000;">, np.mean(recall_accs)) </span><span style="color: #0000ff;">print</span>(<span style="color: #800000;">''</span><span style="color: #000000;">) </span><span style="color: #008000;">#</span><span style="color: #008000;"> 数据类型进行转换</span> results_table[<span style="color: #800000;">'</span><span style="color: #800000;">Mean recall score</span><span style="color: #800000;">'</span>] = results_table[<span style="color: #800000;">'</span><span style="color: #800000;">Mean recall score</span><span style="color: #800000;">'</span>].astype(<span style="color: #800000;">'</span><span style="color: #800000;">float64</span><span style="color: #800000;">'</span><span style="color: #000000;">) </span><span style="color: #008000;">#</span><span style="color: #008000;"> 求得Mean recall score 对应的最大的C_parameter值</span> best_c = results_table.loc[results_table[<span style="color: #800000;">'</span><span style="color: #800000;">Mean recall score</span><span style="color: #800000;">'</span>].idxmax()][<span style="color: #800000;">'</span><span style="color: #800000;">C_parameter</span><span style="color: #800000;">'</span><span style="color: #000000;">] </span><span style="color: #0000ff;">print</span>(<span style="color: #800000;">'</span><span style="color: #800000;">*********************************************************************************</span><span style="color: #800000;">'</span><span style="color: #000000;">) </span><span style="color: #0000ff;">print</span>(<span style="color: #800000;">'</span><span style="color: #800000;">Best model to choose from cross validation is with C parameter = </span><span style="color: #800000;">'</span><span style="color: #000000;">, best_c) </span><span style="color: #0000ff;">print</span>(<span style="color: #800000;">'</span><span style="color: #800000;">*********************************************************************************</span><span style="color: #800000;">'</span><span style="color: #000000;">) </span><span style="color: #0000ff;">return</span> best_c<br><br>#执行程序</pre>best_c = printing_Kfold_socres(X_train_undersample, y_train_undersample)
