1.普罗米修斯概述
Prometheus(由go语言(golang)开发)是一套开源的监控&报警&时间序列数 据库的组合。适合监控docker容器。因为kubernetes(俗称k8s)的流行带动 了prometheus的发展。
2.时间序列数据
2.1什么是序列数据
时间序列数据(TimeSeries Data) : 按照时间顺序记录系统、设备状态变化 的数据被称为时序数据。
应用的场景很多, 如:
- 无人驾驶车辆运行中要记录的经度,纬度,速度,方向,旁边物体的距 离等等。每时每刻都要将数据记录下来做分析。
- 某一个地区的各车辆的行驶轨迹数据
- 传统证券行业实时交易数据
- 实时运维监控数据等
2.2时间序列数据特点
- 性能好
关系型数据库对于大规模数据的处理性能糟糕。NOSQL可以比较好的处理 大规模数据,让依然比不上时间序列数据库。 - 存储成本低
高效的压缩算法,节省存储空间,有效降低IO
Prometheus有着非常高效的时间序列数据存储方法,每个采样数据仅仅占 用3.5byte左右空间,上百万条时间序列,30秒间隔,保留60天,大概花了 200多G(来自官方数据)
2.3Prometheus的主要特征
多维度数据模型 灵活的查询语言 不依赖分布式存储,单个服务器节点是自主的 以HTTP方式,通过pull模型拉去时间序列数据 也可以通过中间网关支持push模型 通过服务发现或者静态配置,来发现目标服务对象 支持多种多样的图表和界面展示
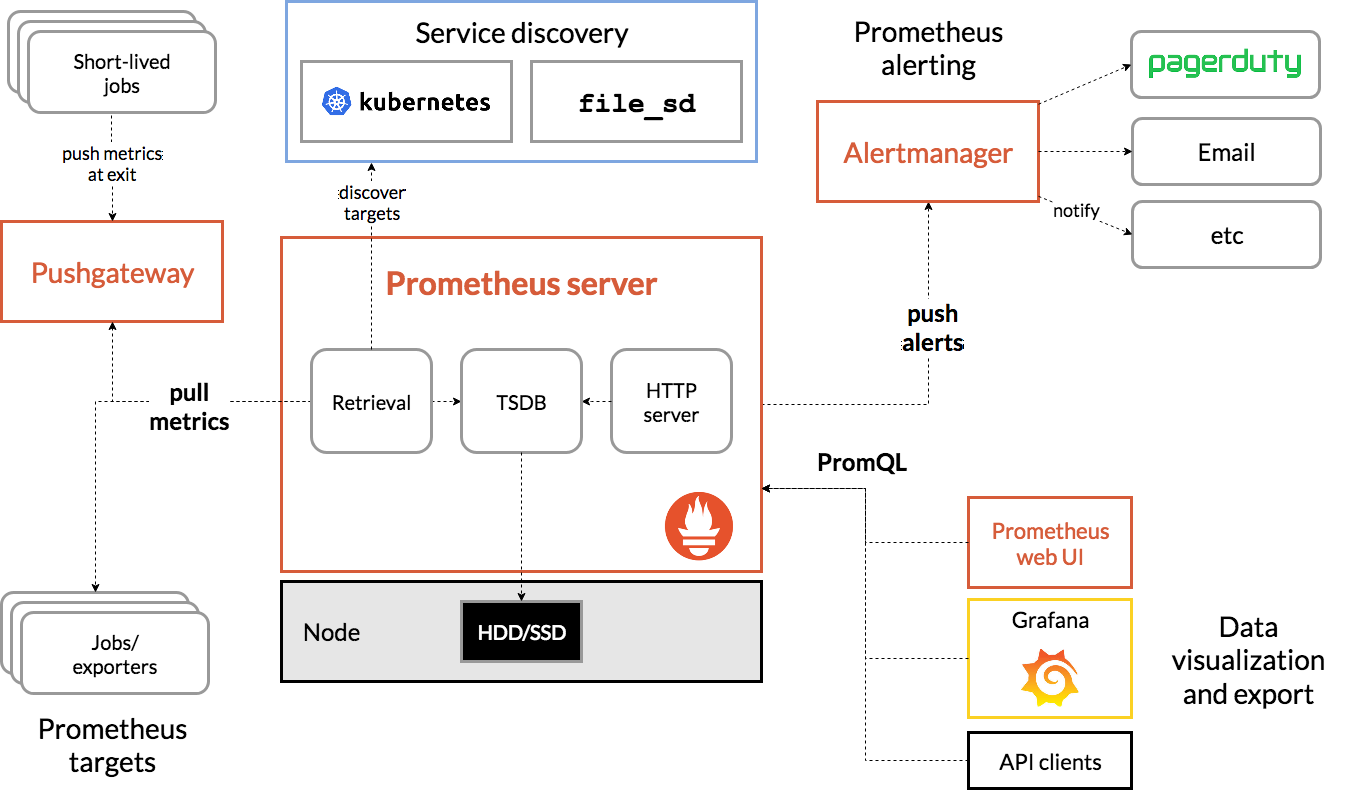
2.4普罗米修斯原理架构图
3.Prometheus搭建
| 服务器 | ip地址 |
|---|---|
| Prometneus服务器 | 192.168.134.131 |
| 被监控服务器 | 192.168.134.132 |
| grafana服务器 | 192.168.134.133 |
3.1安装prometheus
从 https://prometheus.io/download/ 下载相应版本,上传到服务器上解压安装
[root@server ~]# ls
anaconda-ks.cfg  prometheus-2.27.1.linux-amd64.tar.gz
[root@server ~]# tar xf prometheus-2.27.1.linux-amd64.tar.gz -C /usr/local/
[root@server ~]# ls /usr/local/prometheus-2.27.1.linux-amd64/
console_libraries  consoles  LICENSE  NOTICE  prometheus  prometheus.yml  promtool
[root@server ~]# mv /usr/local/prometheus-2.27.1.linux-amd64/ /usr/local/prometheus
直接使用默认配置文件启动并确认端口9090
[root@server ~]# /usr/local/prometheus/prometheus --config.file="/usr/local/prometheus/prometheus.yml" &
[1] 18848
[root@server ~]# level=info ts=2021-06-02T09:22:01.560Z caller=main.go:388 msg="No time or size retention was set so using the default time retention" duration=15d
level=info ts=2021-06-02T09:22:01.560Z caller=main.go:426 msg="Starting Prometheus" version="(version=2.27.1, branch=HEAD, revision=db7f0bcec27bd8aeebad6b08ac849516efa9ae02)"
level=info ts=2021-06-02T09:22:01.560Z caller=main.go:431 build_context="(go=go1.16.4, user=root@fd804fbd4f25, date=20210518-14:17:54)"
level=info ts=2021-06-02T09:22:01.560Z caller=main.go:432 host_details="(Linux 3.10.0-957.el7.x86_64 #1 SMP Thu Nov 8 23:39:32 UTC 2018 x86_64 server (none))"
level=info ts=2021-06-02T09:22:01.560Z caller=main.go:433 fd_limits="(soft=1024, hard=4096)"
level=info ts=2021-06-02T09:22:01.560Z caller=main.go:434 vm_limits="(soft=unlimited, hard=unlimited)"
level=info ts=2021-06-02T09:22:01.561Z caller=web.go:540 component=web msg="Start listening for connections" address=0.0.0.0:9090
level=info ts=2021-06-02T09:22:01.562Z caller=main.go:803 msg="Starting TSDB ..."
level=info ts=2021-06-02T09:22:01.562Z caller=tls_config.go:191 component=web msg="TLS is disabled." http2=false
level=info ts=2021-06-02T09:22:01.577Z caller=head.go:741 component=tsdb msg="Replaying on-disk memory mappable chunks if any"
level=info ts=2021-06-02T09:22:01.577Z caller=head.go:755 component=tsdb msg="On-disk memory mappable chunks replay completed" duration=3.827µs
level=info ts=2021-06-02T09:22:01.577Z caller=head.go:761 component=tsdb msg="Replaying WAL, this may take a while"
level=info ts=2021-06-02T09:22:01.578Z caller=head.go:813 component=tsdb msg="WAL segment loaded" segment=0 maxSegment=0
level=info ts=2021-06-02T09:22:01.578Z caller=head.go:818 component=tsdb msg="WAL replay completed" checkpoint_replay_duration=11.651µs wal_replay_duration=945.393µs total_replay_duration=970.961µs
level=info ts=2021-06-02T09:22:01.578Z caller=main.go:828 fs_type=XFS_SUPER_MAGIC
level=info ts=2021-06-02T09:22:01.578Z caller=main.go:831 msg="TSDB started"
level=info ts=2021-06-02T09:22:01.578Z caller=main.go:957 msg="Loading configuration file" filename=/usr/local/prometheus/prometheus.yml
level=info ts=2021-06-02T09:22:11.588Z caller=main.go:988 msg="Completed loading of configuration file" filename=/usr/local/prometheus/prometheus.yml totalDuration=10.010120516s remote_storage=3.777µs web_handler=421ns query_engine=702ns scrape=10.009801277s scrape_sd=50.014µs notify=28.613µs notify_sd=8.716µs rules=3.397µs
level=info ts=2021-06-02T09:22:11.588Z caller=main.go:775 msg="Server is ready to receive web requests."
[root@server ~]# ss -antlp|grep 9090
LISTEN     0      128         :::9090                    :::*                   users:(("prometheus",pid=18848,fd=7))
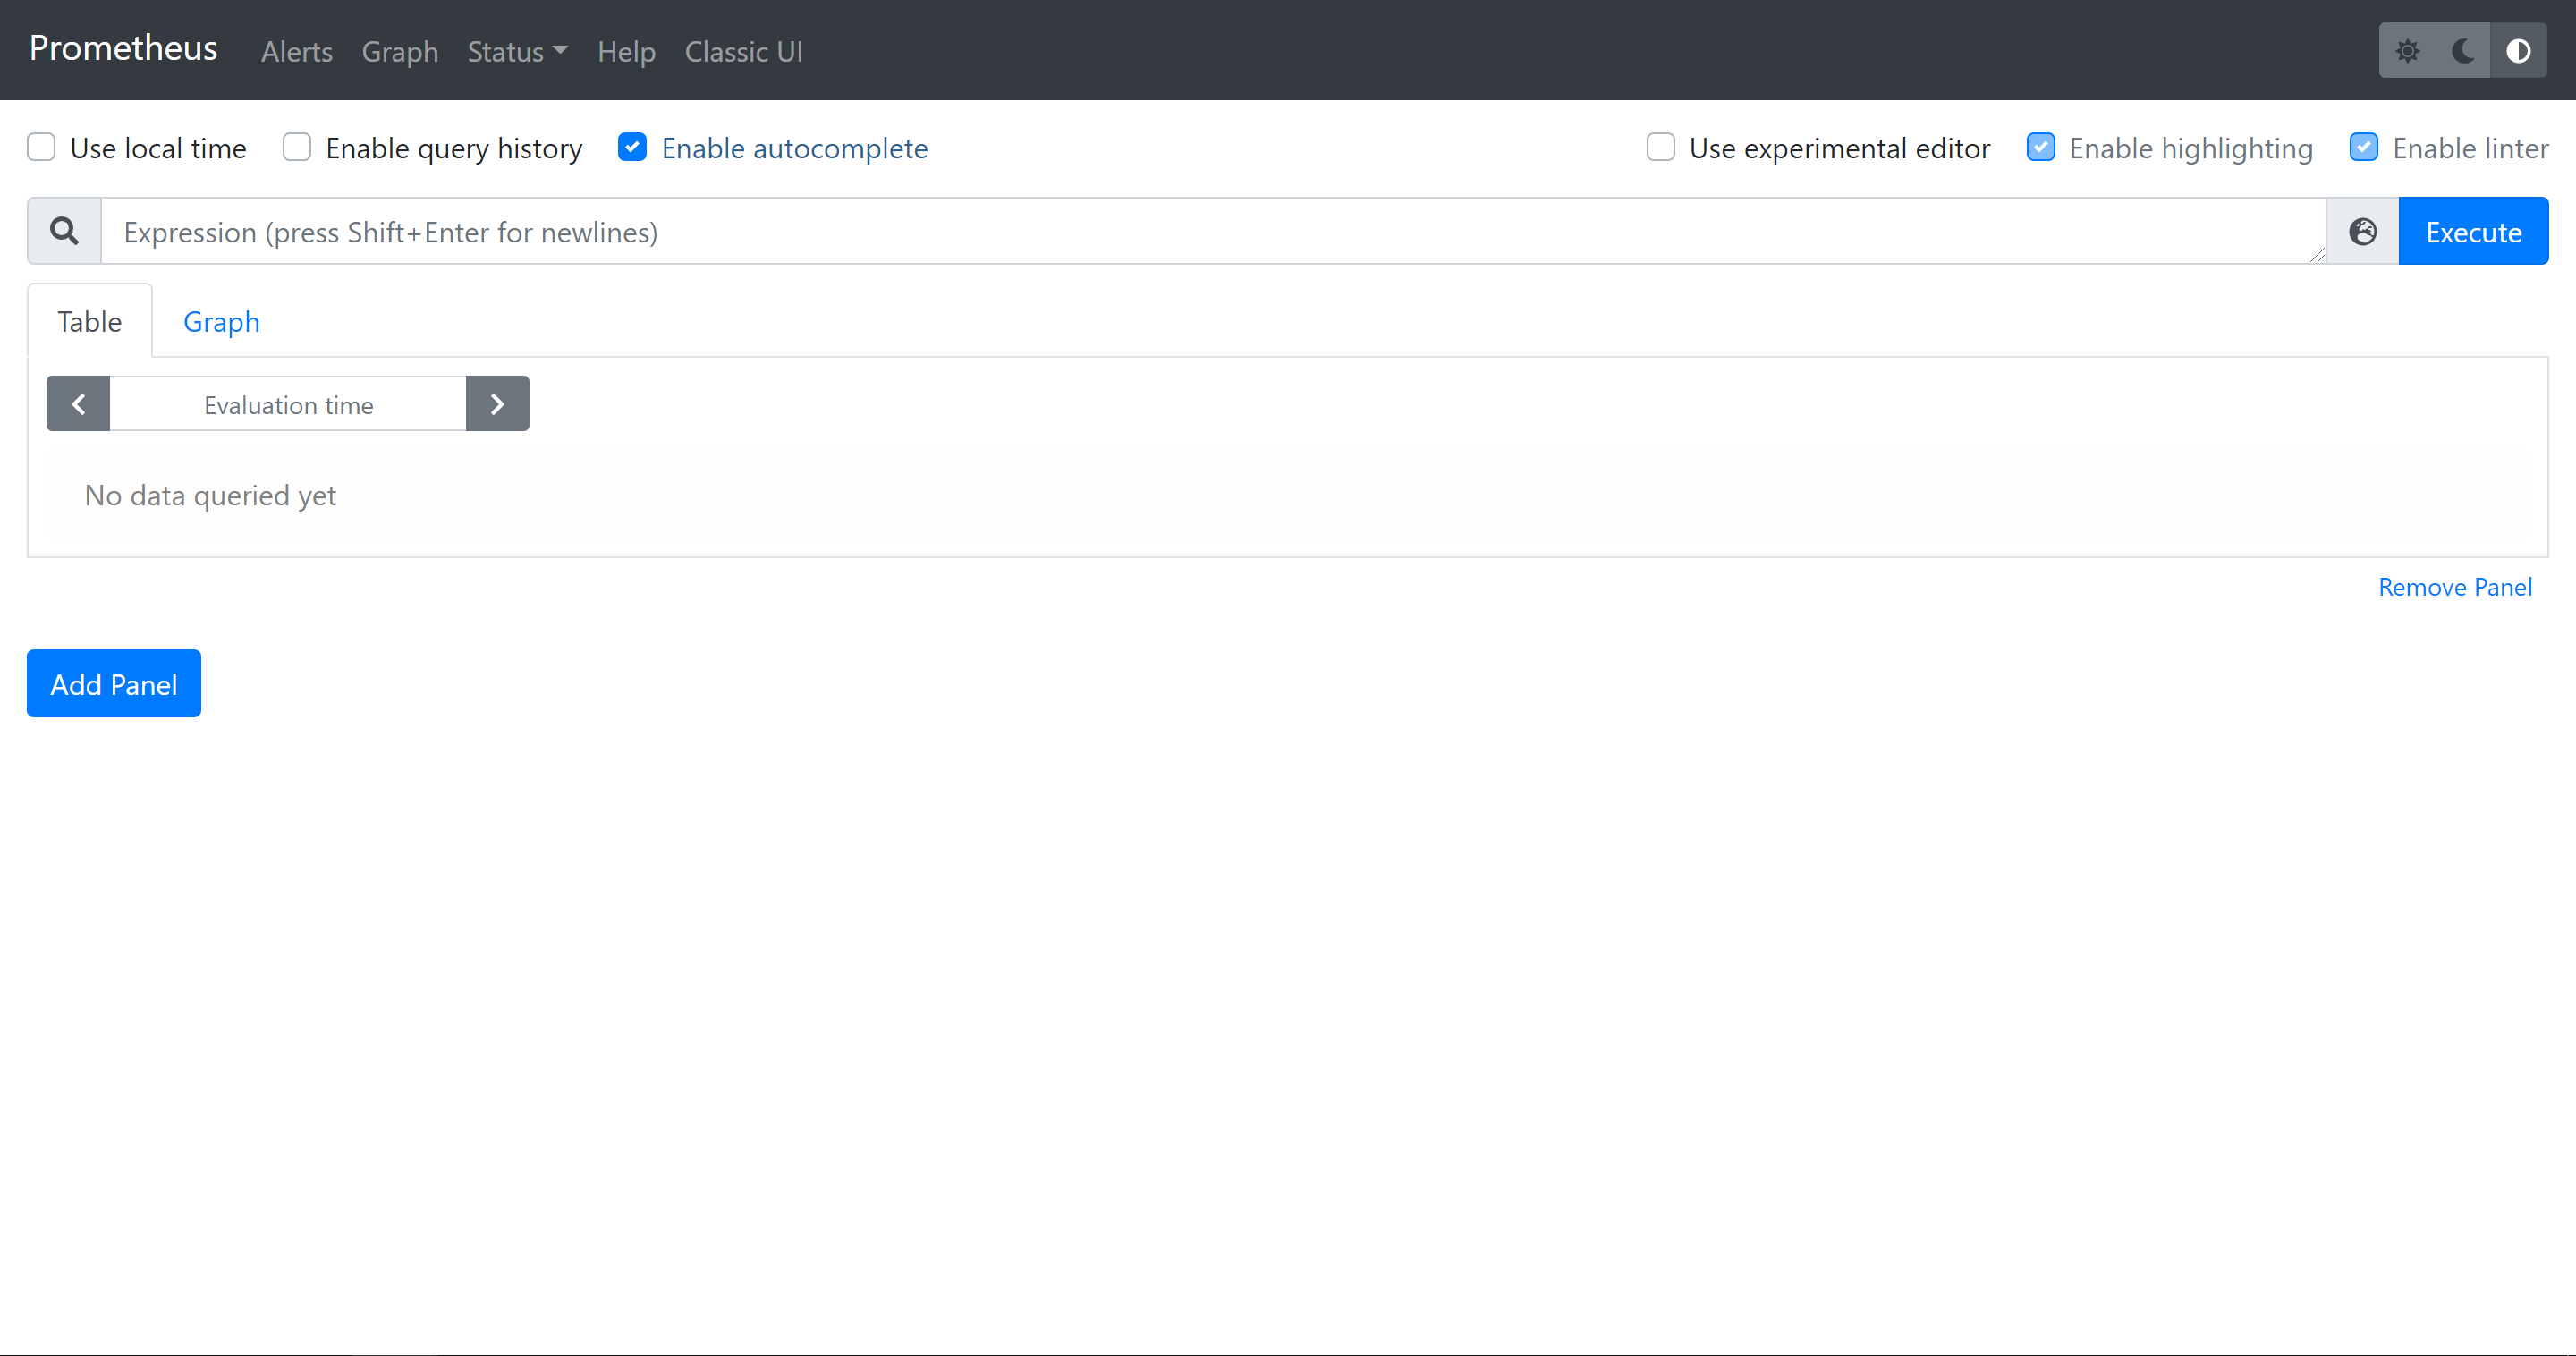
3.2prometheus界面
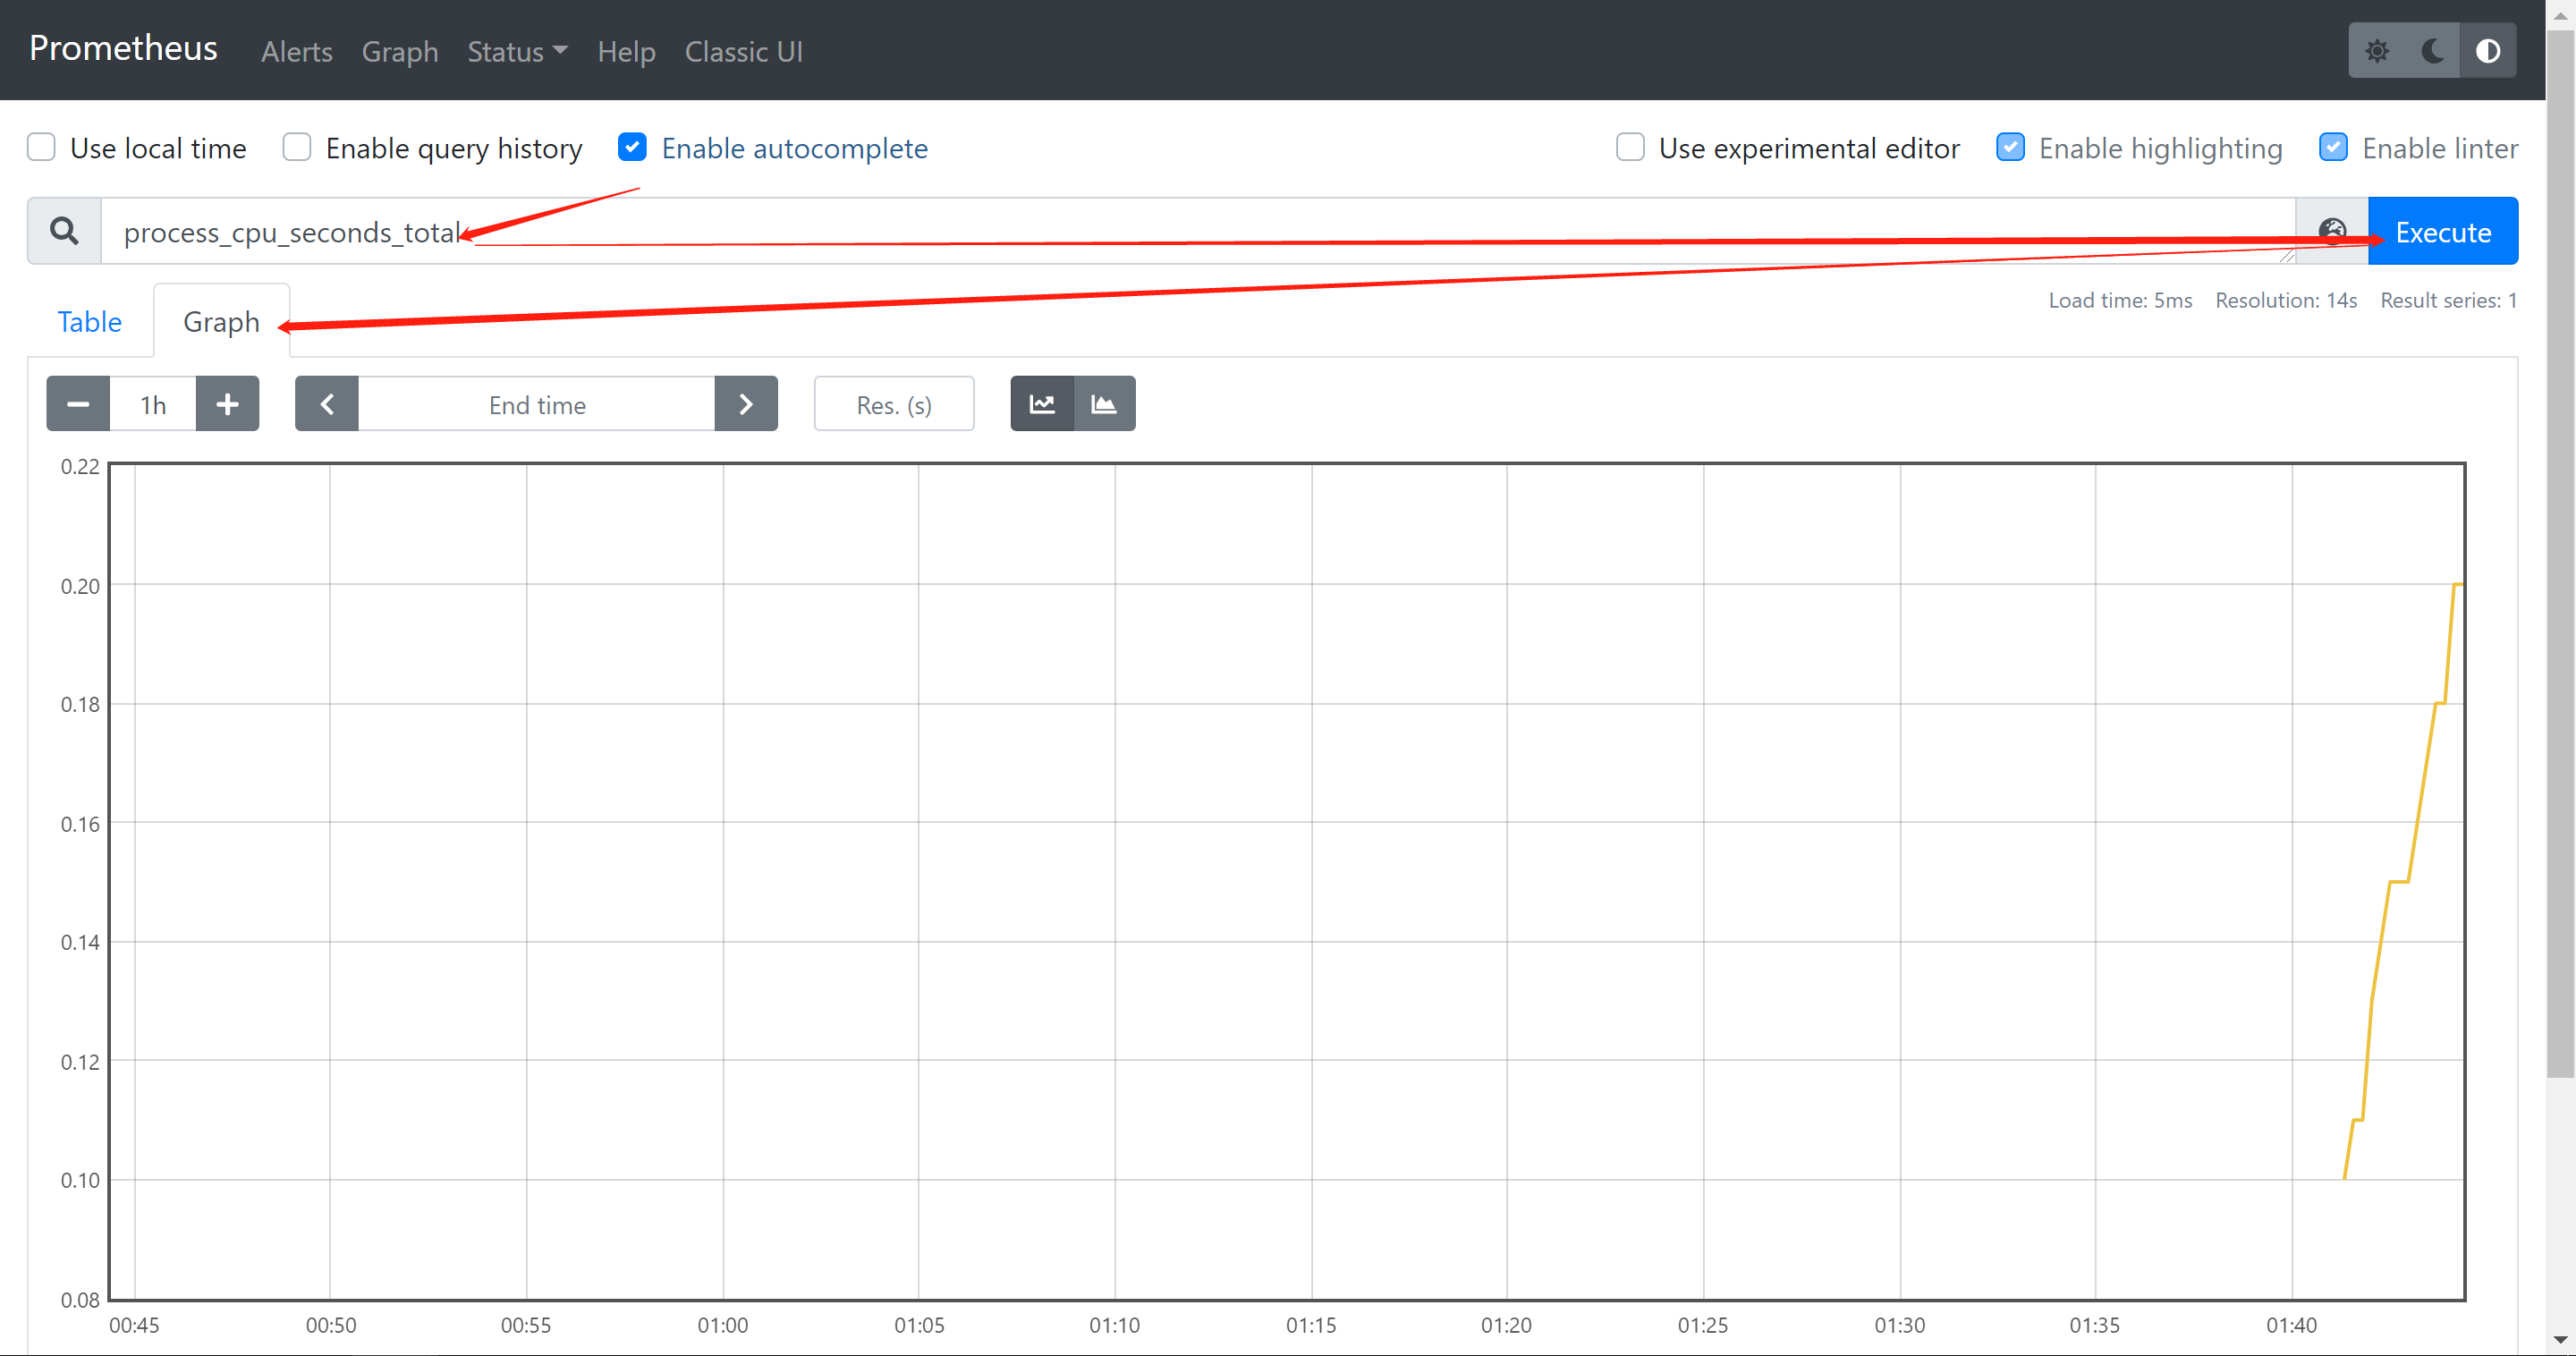
通过浏览器访问http://服务器IP:9090就可以访问到prometheus的主界面
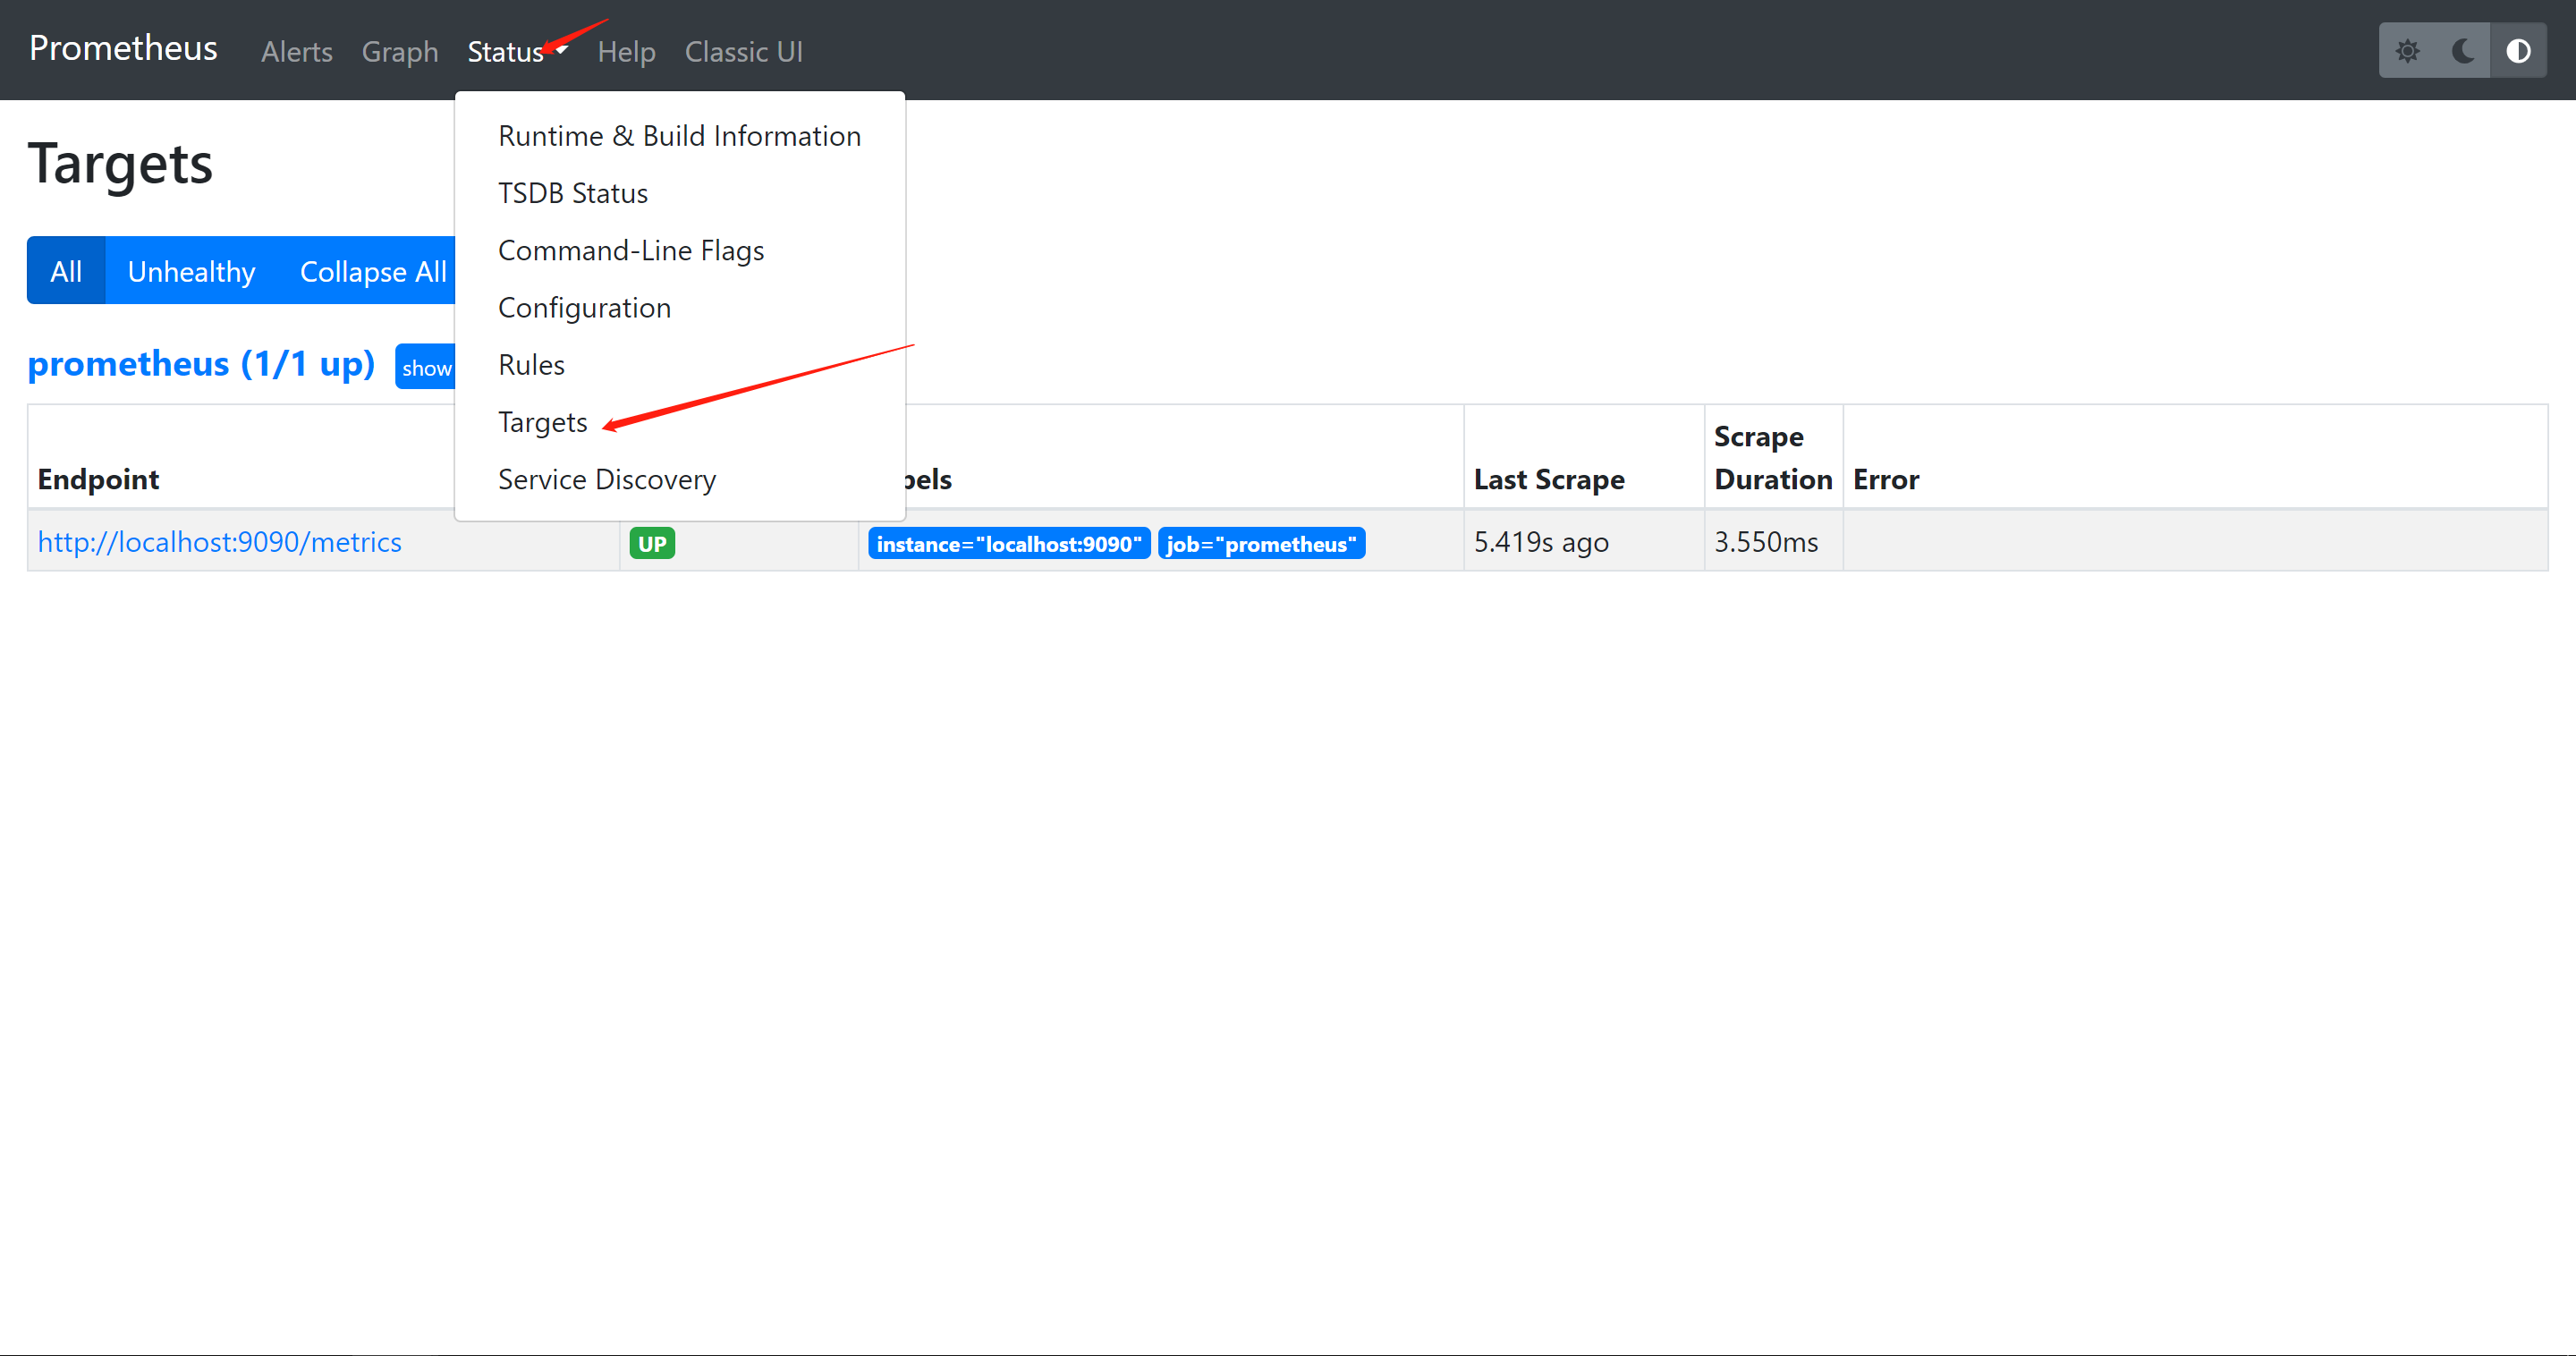
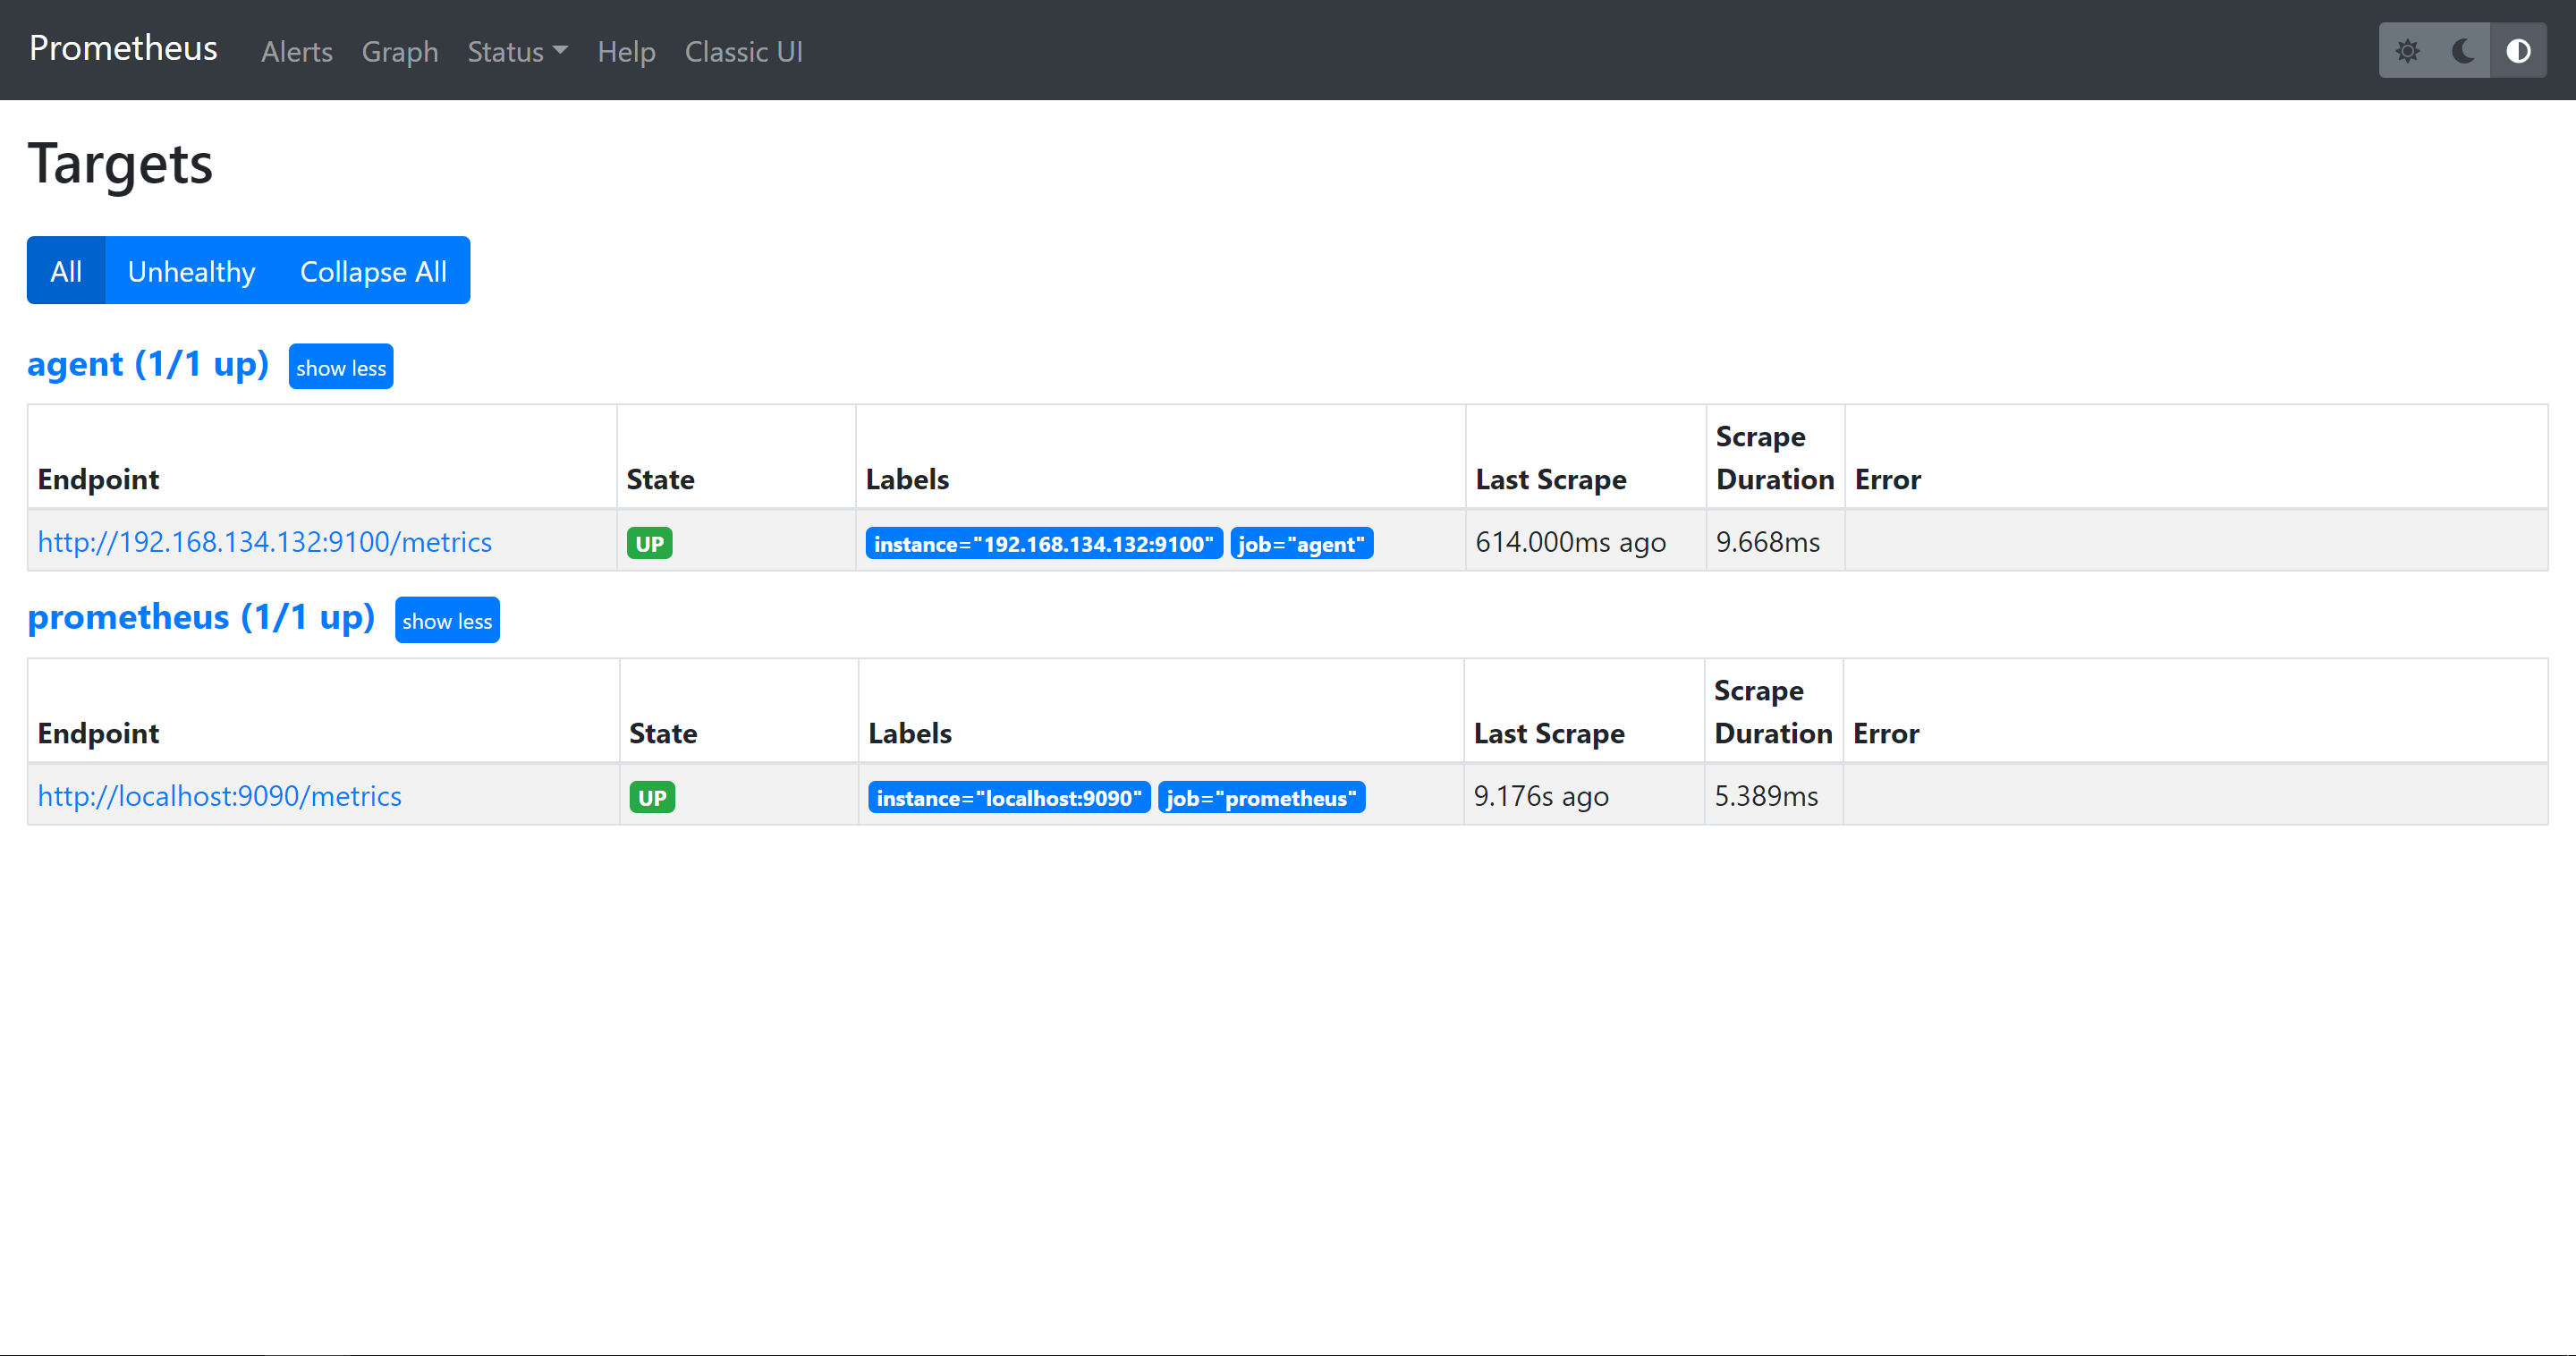
默认只监控了本机一台,点Status --》点Targets --》可以看到只监控了本机
3.3主机数据展示
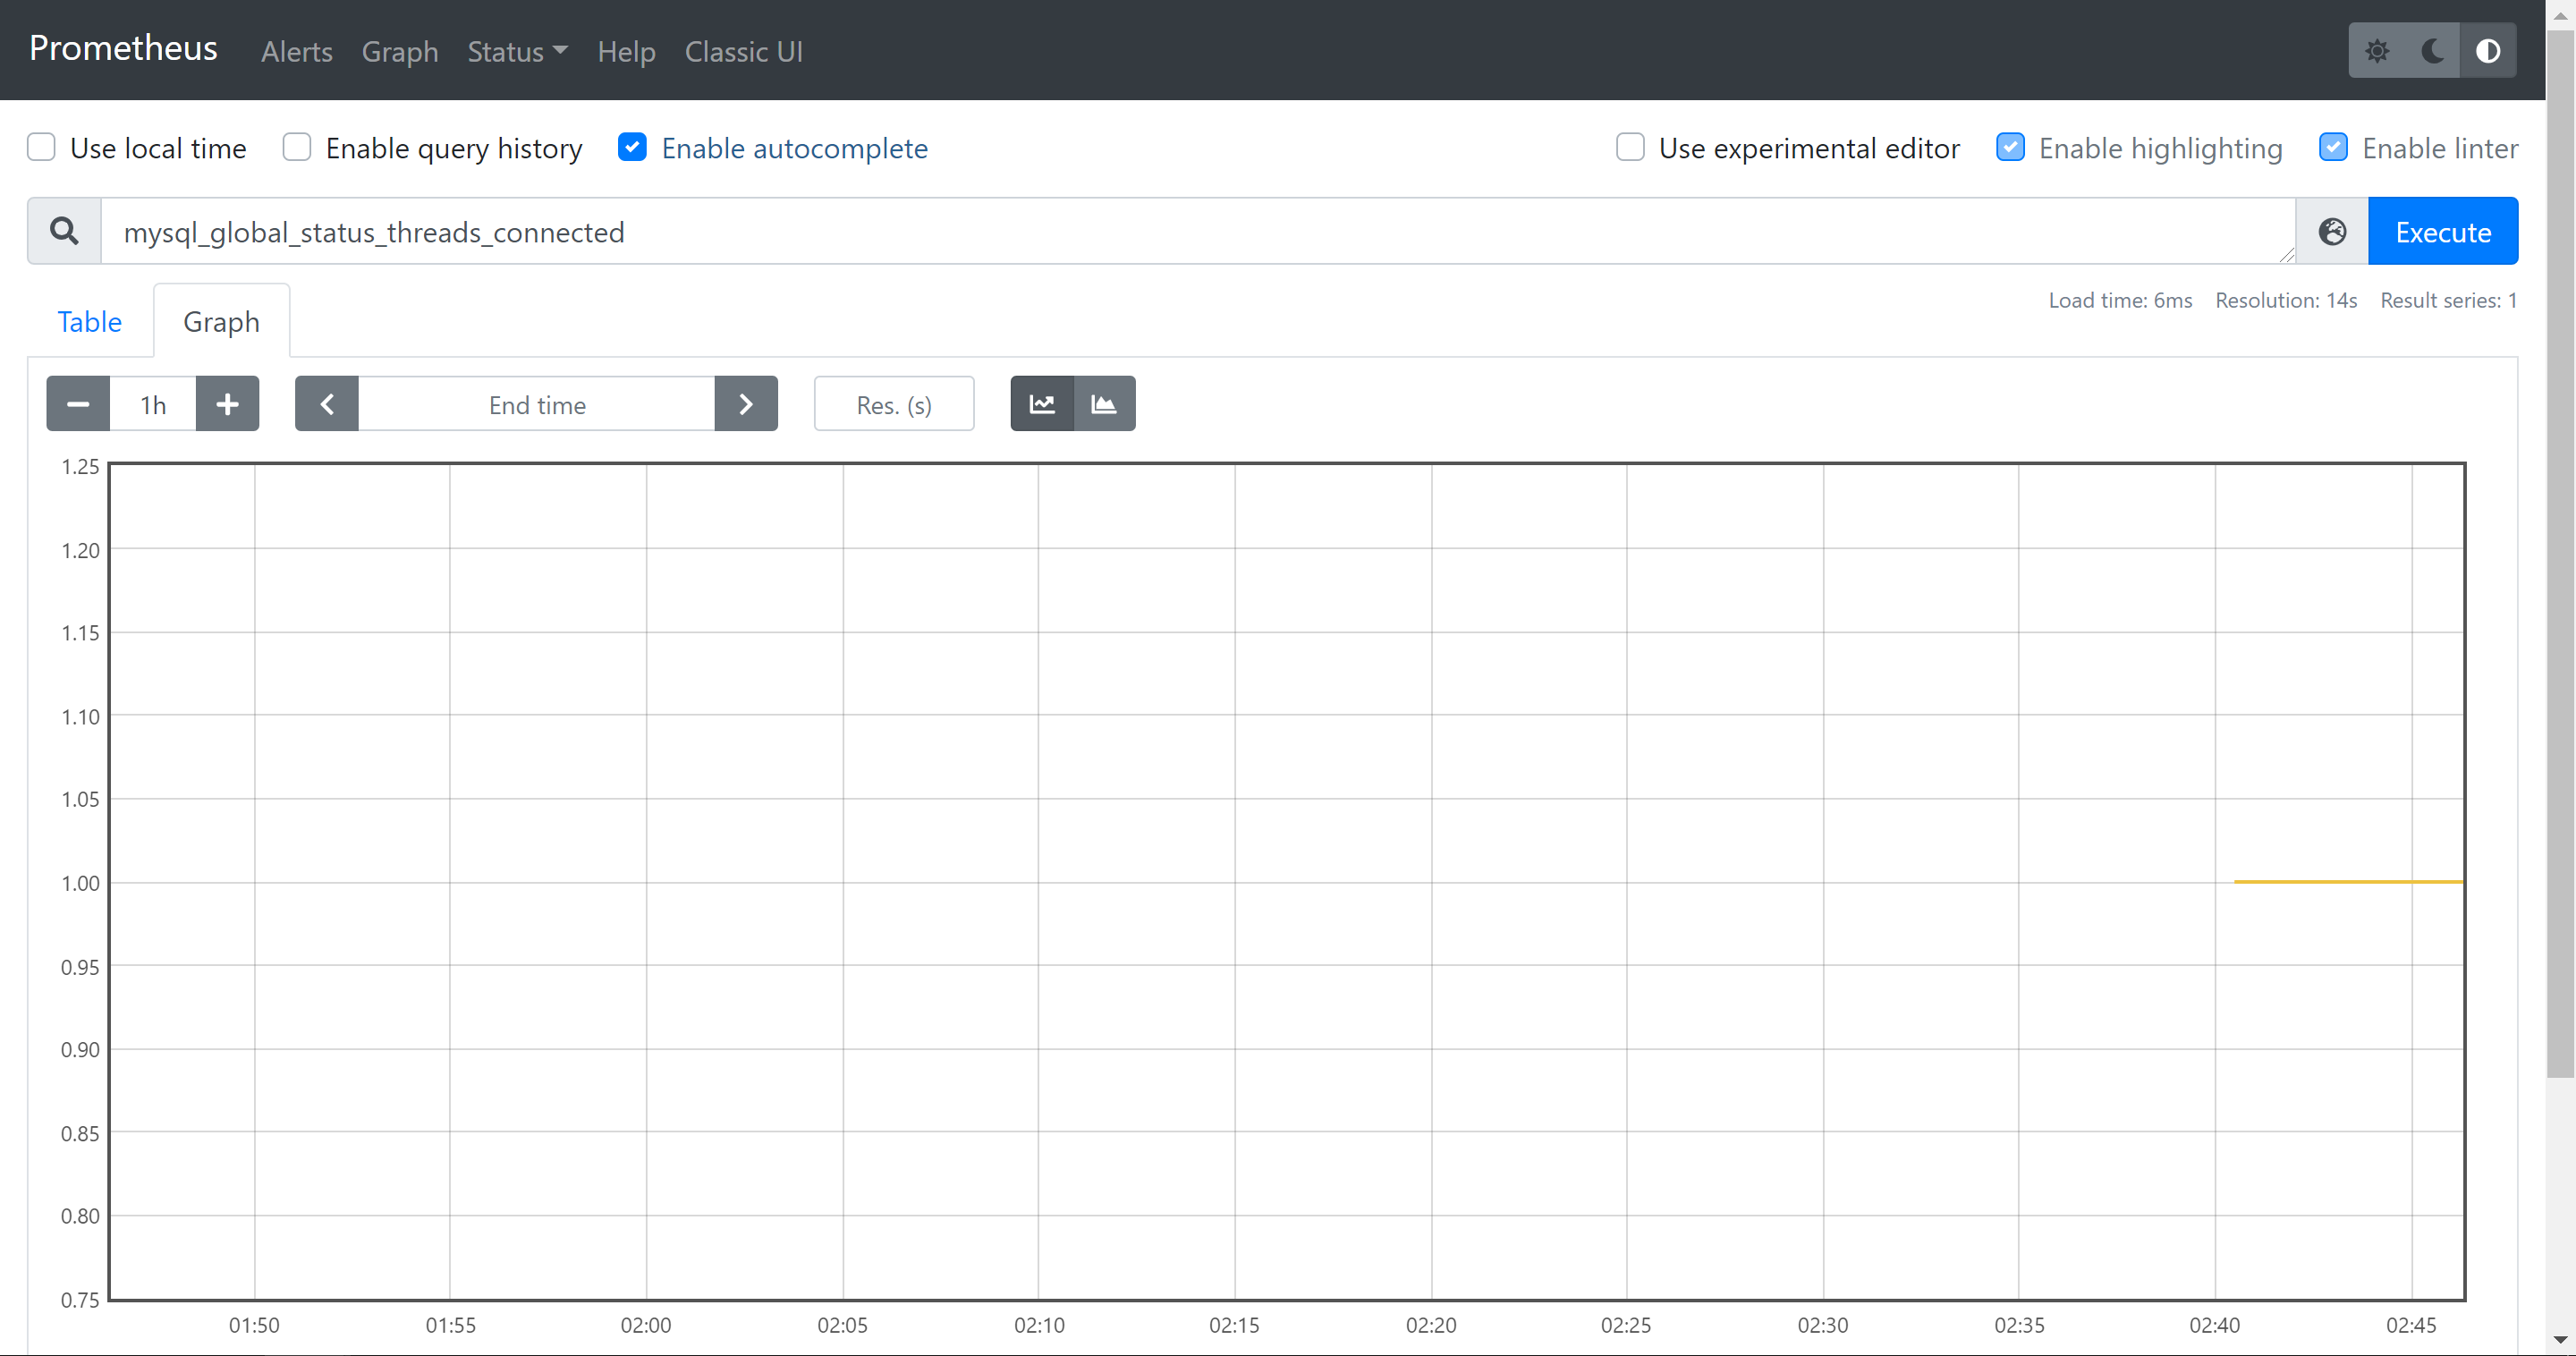
通过http://服务器IP:9090/metrics可以查看到监控的数据
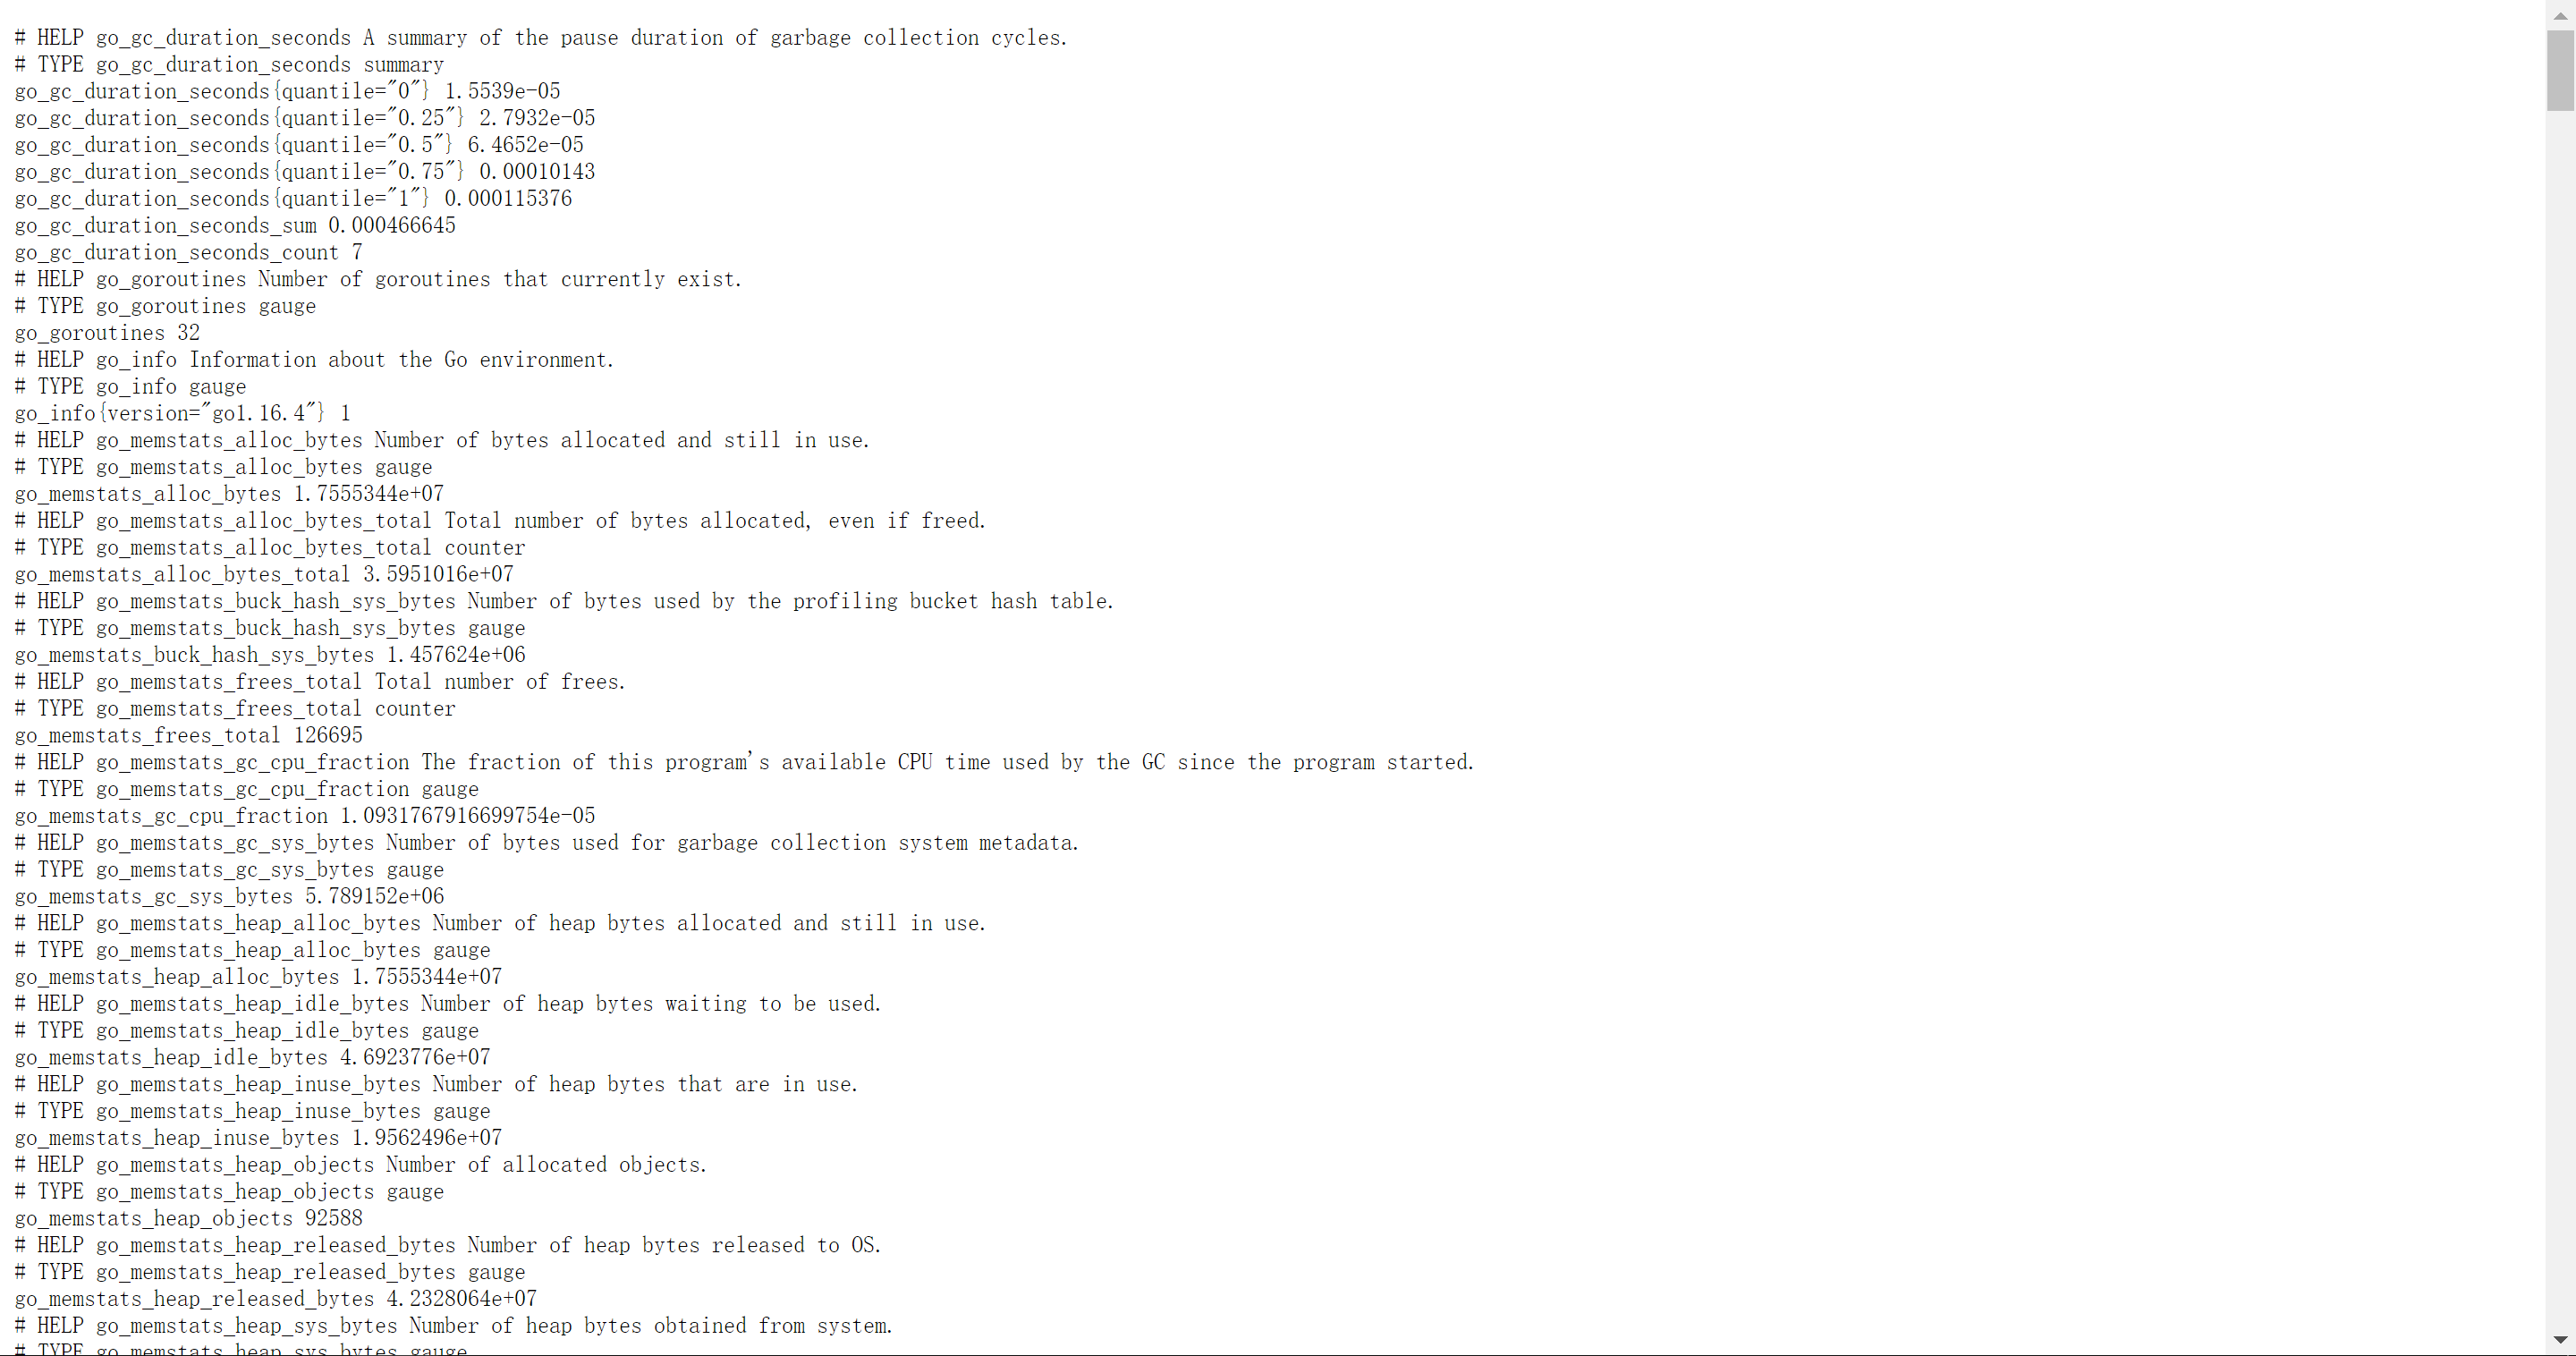
在web主界面可以通过关键字查询监控项
3.4监控远程Linux主机
在远程linux主机(被监控端agent)上安装node_exporter组件
下载地址: https://prometheus.io/download/
[root@agent ~]# ls
anaconda-ks.cfg  node_exporter-1.1.2.linux-amd64.tar.gz
[root@agent ~]# tar xf node_exporter-1.1.2.linux-amd64.tar.gz -C /usr/local/
[root@agent ~]# mv /usr/local/node_exporter-1.1.2.linux-amd64/ /usr/local/node_exporter
里面就一个启动命令node_exporter,可以直接使用此命令启动,确认端口9100
[root@agent ~]# nohup /usr/local/node_exporter/node_exporter &
[1] 51186
[root@agent ~]# nohup: ignoring input and appending output to ‘nohup.out’

[root@agent ~]# ss -antlp|grep 9100
LISTEN     0      128         :::9100                    :::*                   users:(("node_exporter",pid=51186,fd=3))
通过浏览器访问http://被监控端IP:9100/metrics就可以查看到 node_exporter在被监控端收集的监控信息
回到prometheus服务器的配置文件里添加被监控机器的配置段
在主配置文件最后加上下面三行
[root@server ~]# tail /usr/local/prometheus/prometheus.yml

    # metrics_path defaults to '/metrics'
    # scheme defaults to 'http'.

    static_configs:
    - targets: ['localhost:9090']

  - job_name: 'agent'                # 取一个job名称来代 表被监控的机器
    static_configs:
    - targets: ['192.168.134.132:9100']  # 这里改成被监控机器 的IP,后面端口接9100
改完配置文件后,重启服务
[root@server ~]# pkill prometheus
[root@server ~]# /usr/local/prometheus/prometheus --config.file="/usr/local/prometheus/prometheus.yml" &
[root@server ~]# ss -antlp|grep 9090
LISTEN     0      128         :::9090                    :::*                   users:(("prometheus",pid=51287,fd=8))
回到web管理界面 --》点Status --》点Targets --》可以看到多了一台监 控目标
4.Promethus监控Mysql数据库
在被管理机agent上安装mysqld_exporter组件
下载地址: https://prometheus.io/download/
[root@agent ~]# ls
anaconda-ks.cfg  mysqld_exporter-0.13.0.linux-amd64.tar.gz  node_exporter-1.1.2.linux-amd64.tar.gz  nohup.out
安装mysqld_exporter组件
[root@agent ~]# tar xf mysqld_exporter-0.13.0.linux-amd64.tar.gz -C /usr/local/
[root@agent ~]# mv /usr/local/mysqld_exporter-0.13.0.linux-amd64/ /usr/local/mysqld_exporter
[root@agent ~]# ls /usr/local/mysqld_exporter/
LICENSE  mysqld_exporter  NOTICE
安装mariadb数据库,并授权
[root@agent ~]# yum install mariadb* -y
[root@agent ~]# systemctl enable --now mariadb
[root@agent ~]# mysql
Welcome to the MariaDB monitor.  Commands end with ; or g.
Your MariaDB connection id is 2
Server version: 5.5.68-MariaDB MariaDB Server

Copyright (c) 2000, 2018, Oracle, MariaDB Corporation Ab and others.

Type 'help;' or 'h' for help. Type 'c' to clear the current input statement.

MariaDB [(none)]> grant select,replication client,process ON *.* to 'mysql_monitor'@'localhost' identified by '123';
Query OK, 0 rows affected (0.00 sec)

MariaDB [(none)]> flush privileges;
Query OK, 0 rows affected (0.00 sec)

MariaDB [(none)]> quit
Bye
(注意:授权ip为localhost,因为不是prometheus服务器来直接找mariadb 获取数据,而是prometheus服务器找mysql_exporter,mysql_exporter 再找mariadb。所以这个localhost是指的mysql_exporter的IP)
创建一个mariadb配置文件,写上连接的用户名与密码(和上面的授权的用户名 和密码要对应)
[root@agent ~]# vim /usr/local/mysqld_exporter/.my.cnf
[client]
user=mysql_monitor
password=123
启动mysqld_exporter,确认端口(9104)
[root@agent ~]# nohup /usr/local/mysqld_exporter/mysqld_exporter --config.my-cnf=/usr/local/mysqld_exporter/.my.cnf &
[root@agent ~]# ss -antlp|grep 9104
LISTEN     0      128         :::9104                    :::*                   users:(("mysqld_exporter",pid=51787,fd=3))
回到prometheus服务器的配置文件里添加被监控的mariadb的配置段
[root@server ~]# tail /usr/local/prometheus/prometheus.yml
    - targets: ['localhost:9090']

  - job_name: 'agent'
    static_configs:
    - targets: ['192.168.134.132:9100']

  - job_name: 'mariadb'
    static_configs:
    - targets: ['192.168.116.132:9104']
改完配置文件后,重启服务
[root@server ~]# pkill prometheus
[root@server ~]# /usr/local/prometheus/prometheus --config.file="/usr/local/prometheus/prometheus.yml" &
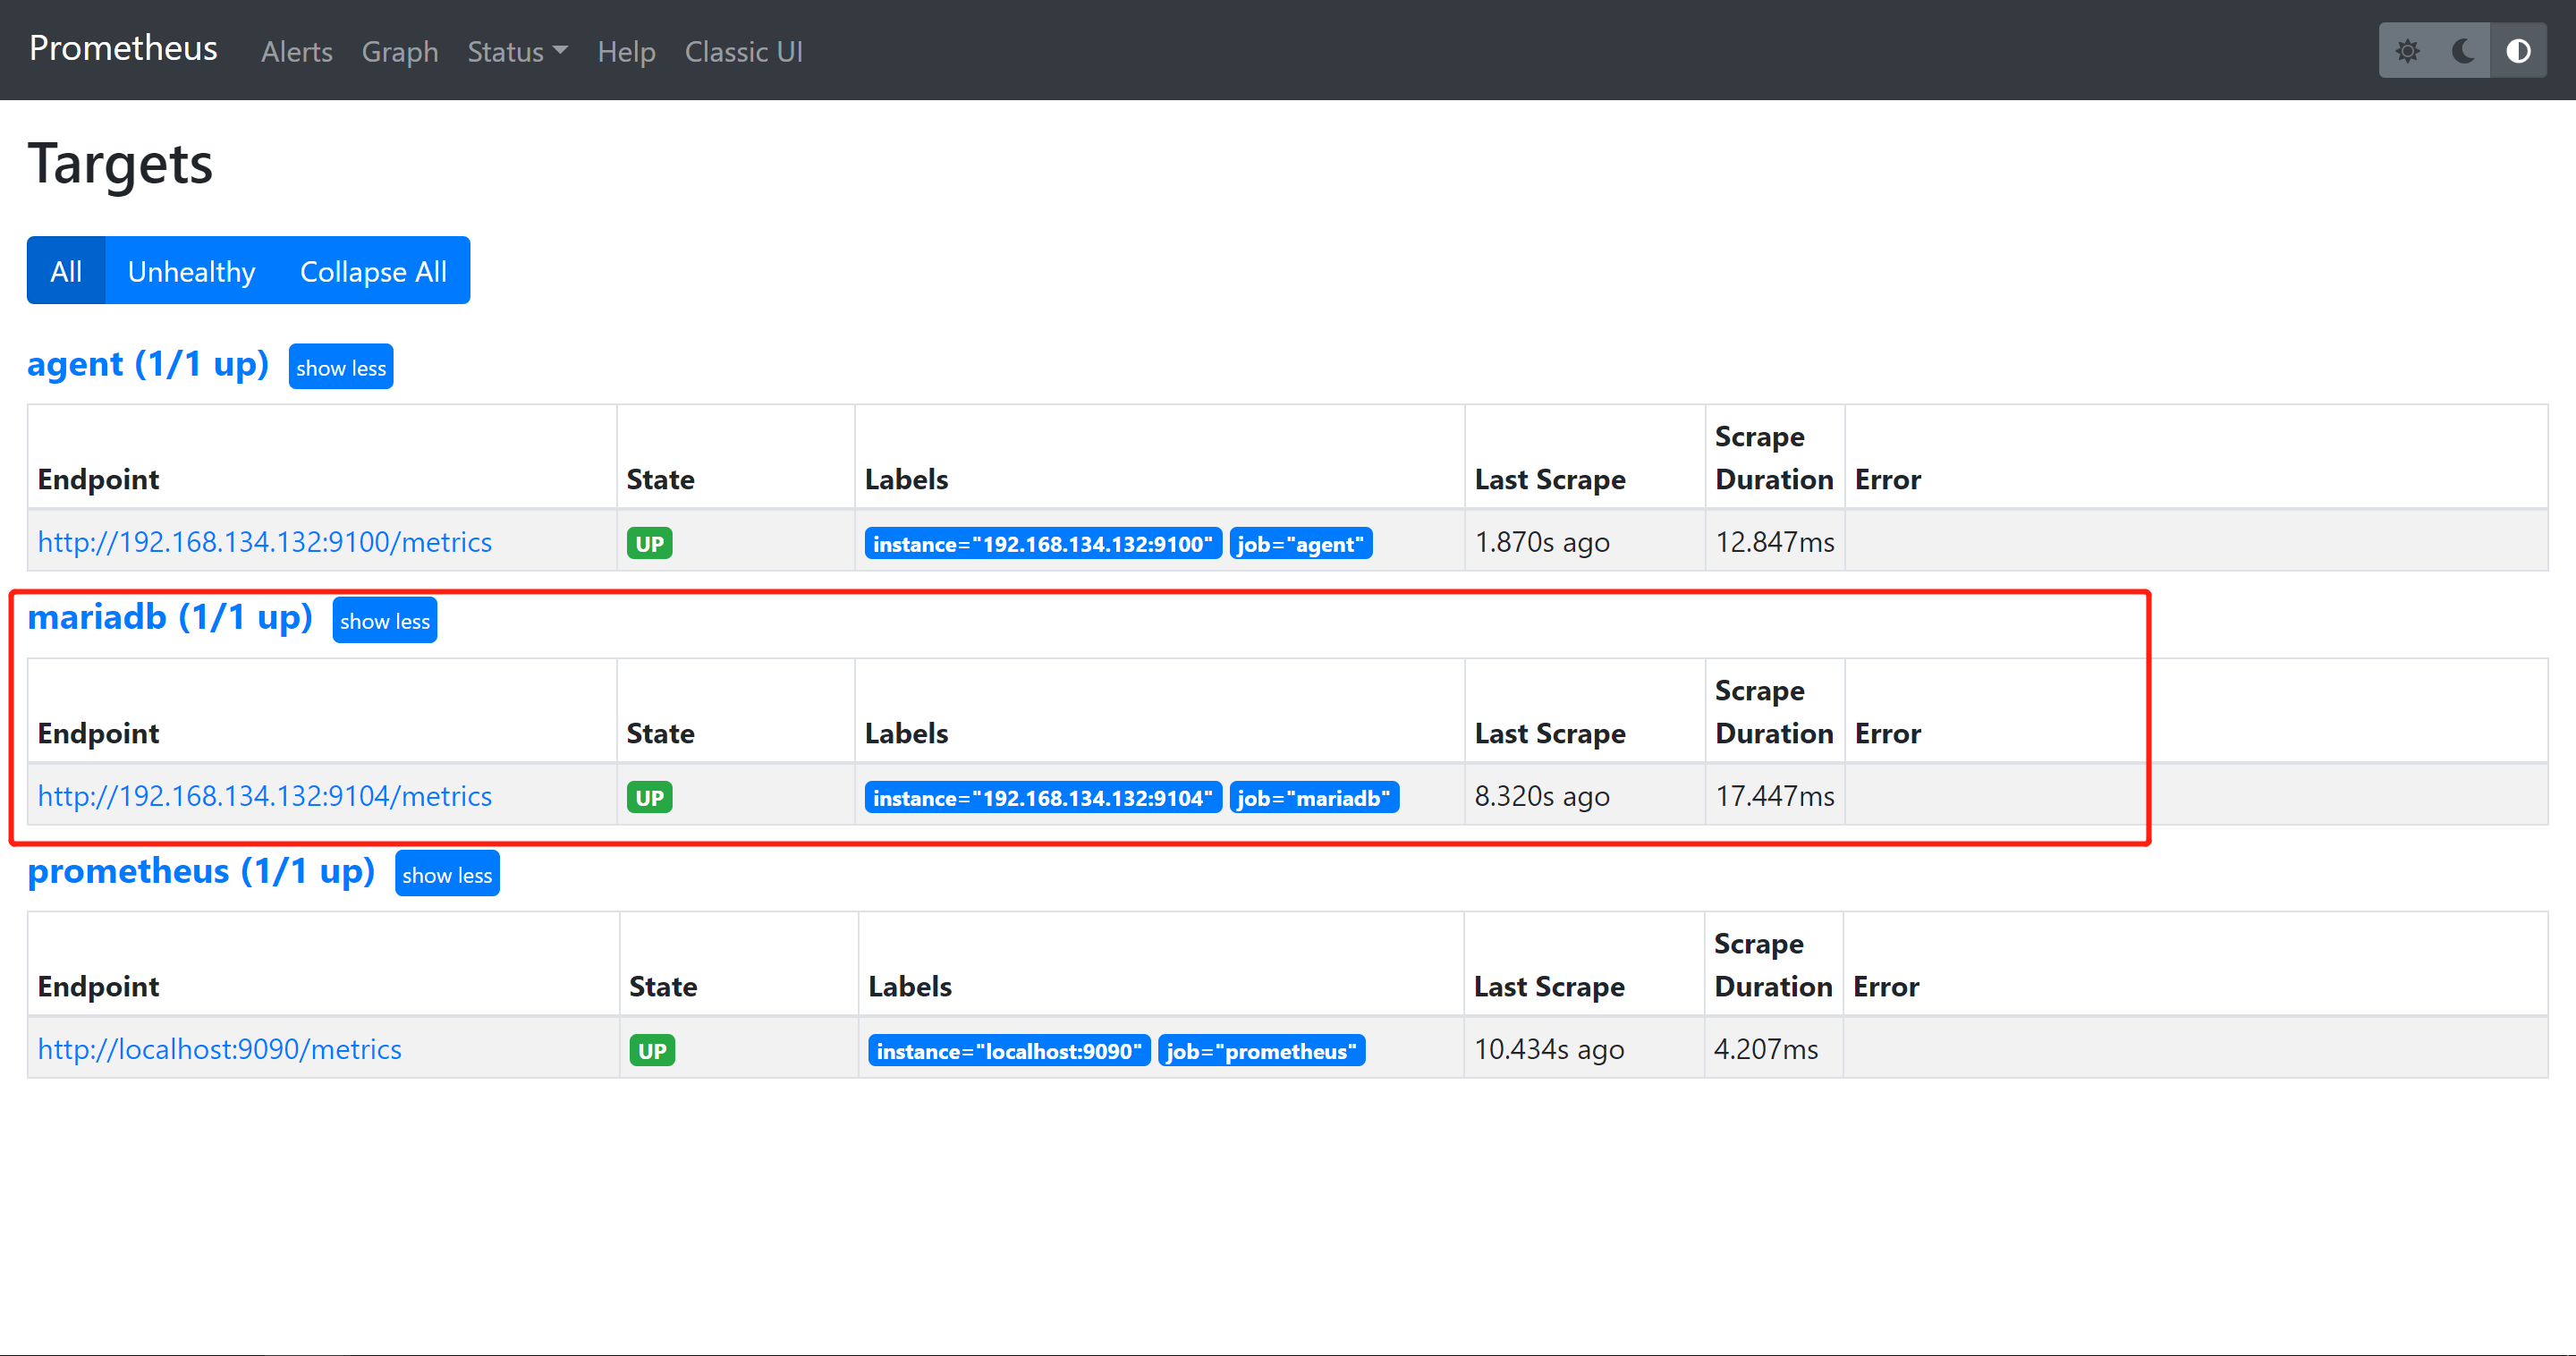
回到web管理界面 --》点Status --》点Targets --》可以看到监控 mariadb了
5.Promethus安装Grafana可视化图形工具
5.1什么是Grafana
Grafana是一个开源的度量分析和可视化工具,可以通过将采集的数据分 析,查询,然后进行可视化的展示,并能实现报警。
网址: https://grafana.com/
5.2使用Grafana连接Prometheus
在grafana服务器上安装grafana
下载地址:https://grafana.com/grafana/download
[root@grafana ~]# ls
anaconda-ks.cfg  grafana-5.4.2-1.x86_64.rpm
[root@grafana ~]# yum -y install grafana-5.4.2-1.x86_64.rpm
启动服务,确认端口(3000)
[root@grafana ~]# systemctl enable --now grafana-server.service
Created symlink from /etc/systemd/system/multi-user.target.wants/grafana-server.service to /usr/lib/systemd/system/grafana-server.service.
[root@grafana ~]# ss -antlp|grep 3000
LISTEN     0      128         :::3000                    :::*                   users:(("grafana-server",pid=49313,fd=6))
通过浏览器访问 http:// grafana服务器IP:3000就到了登录界面,使用默 认的admin用户,admin密码就可以登陆了

第一次登录会强制更改密码

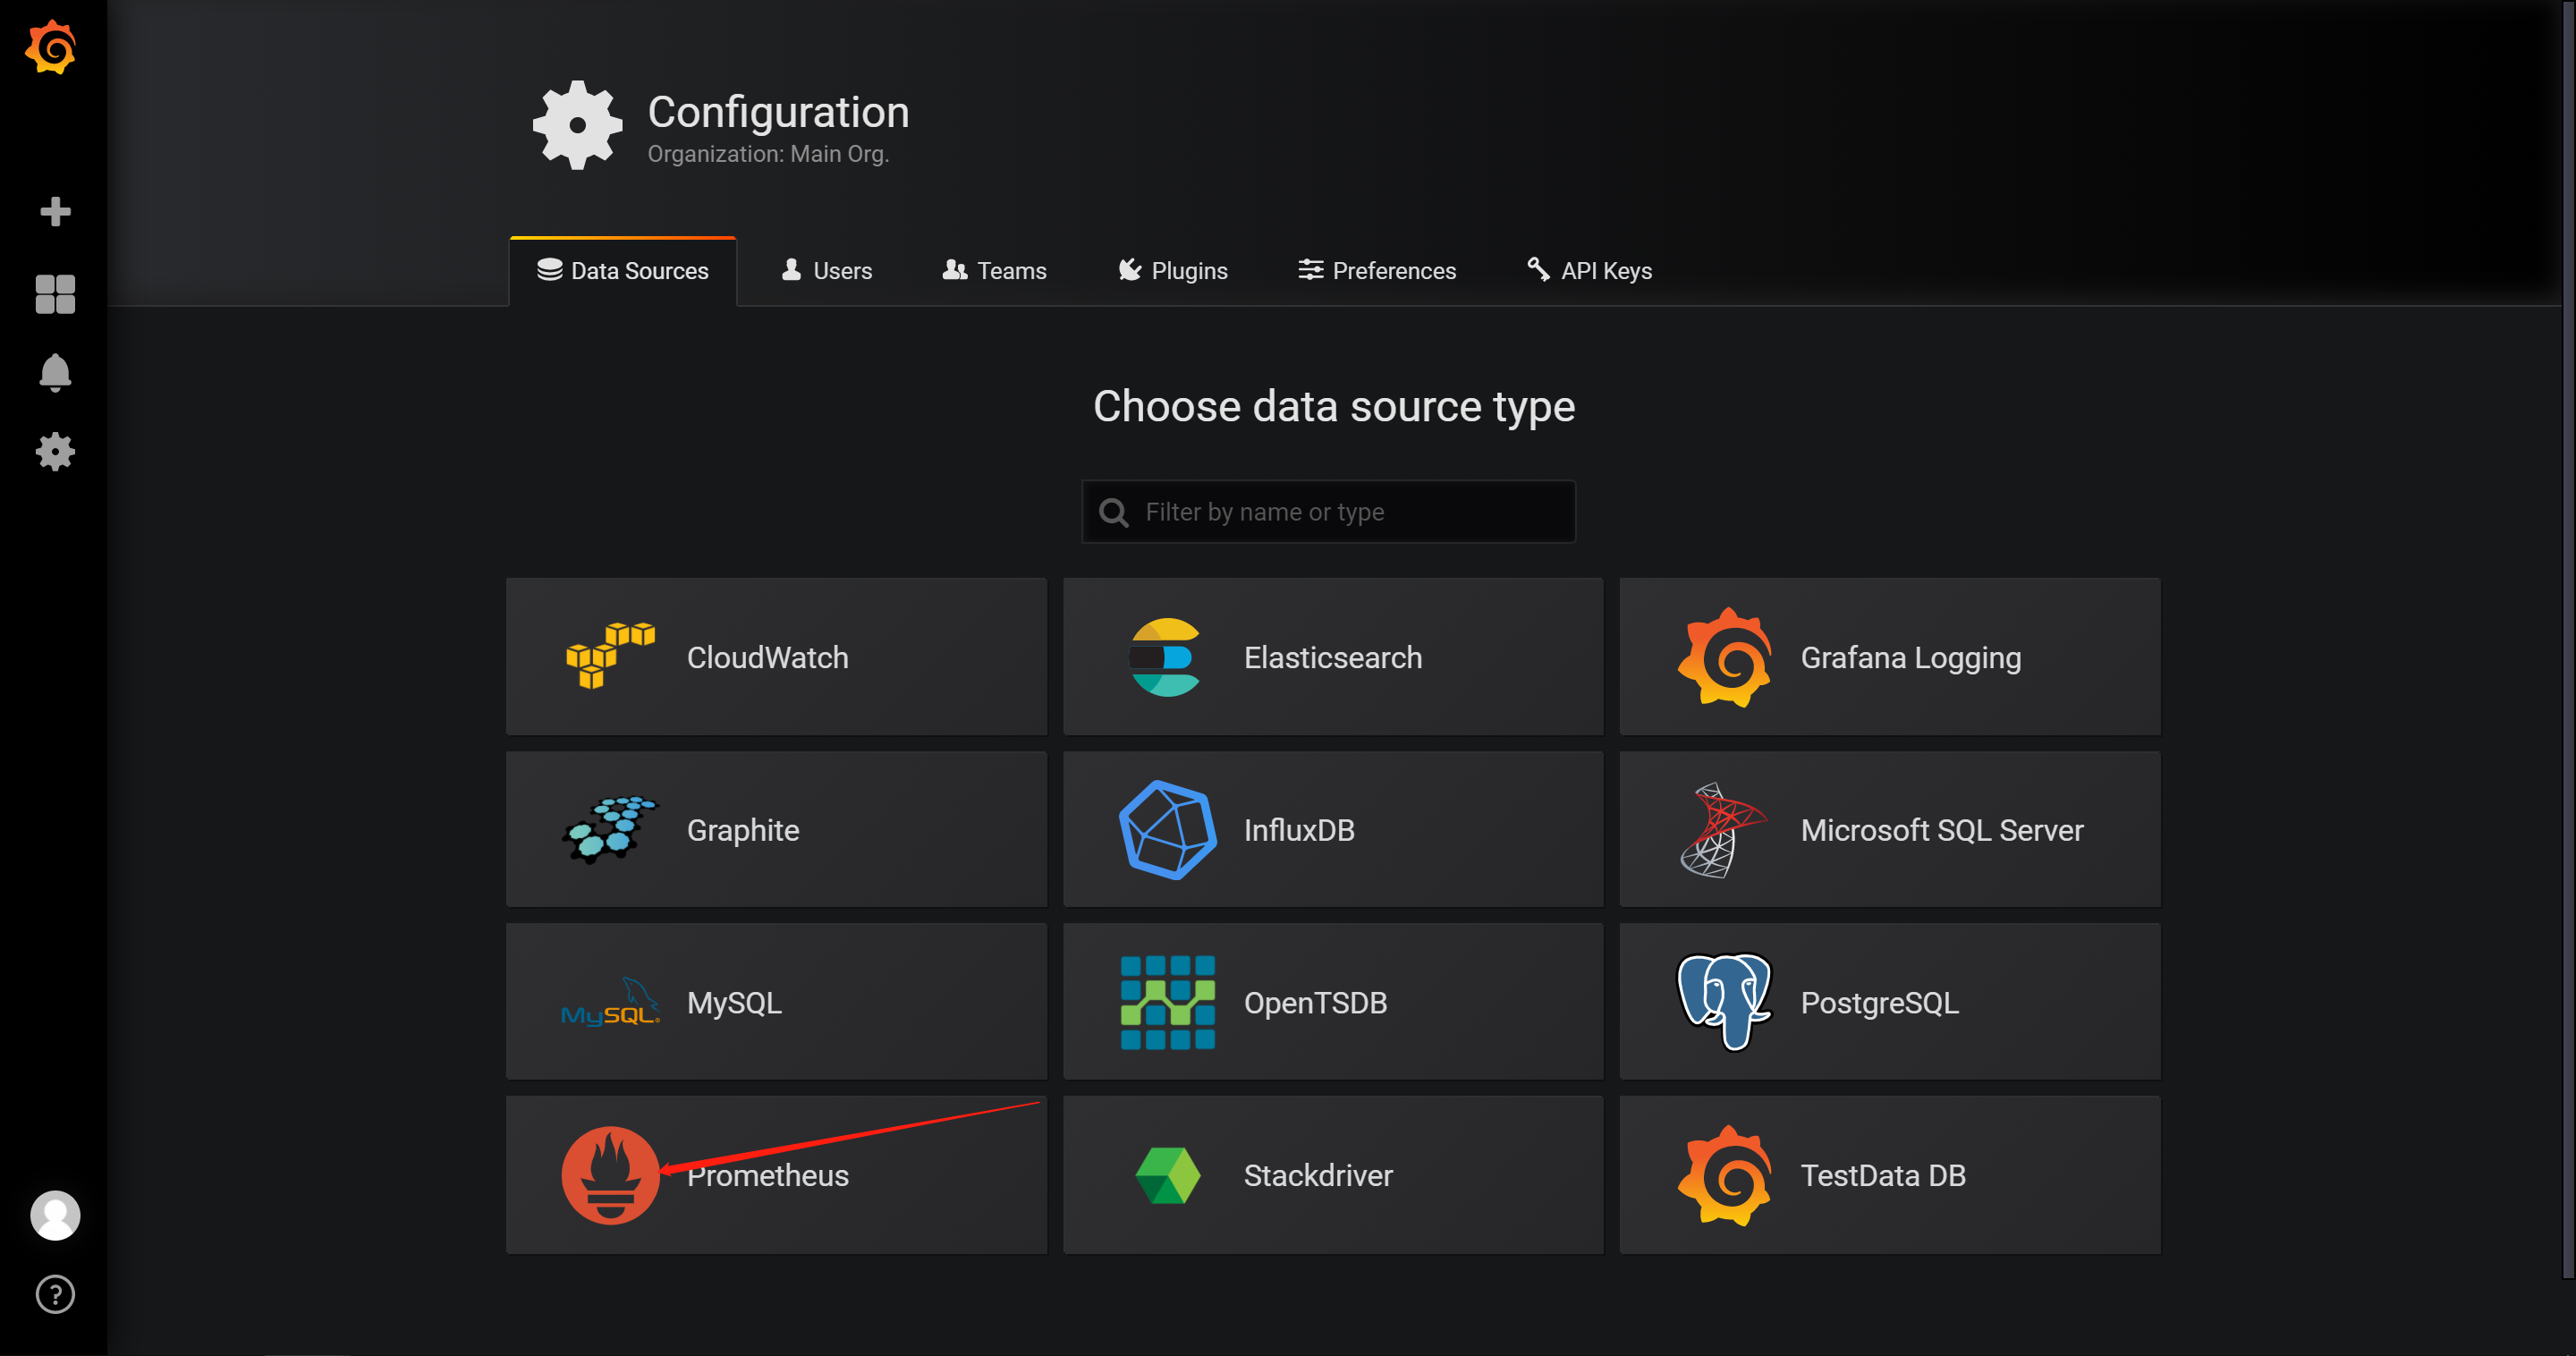
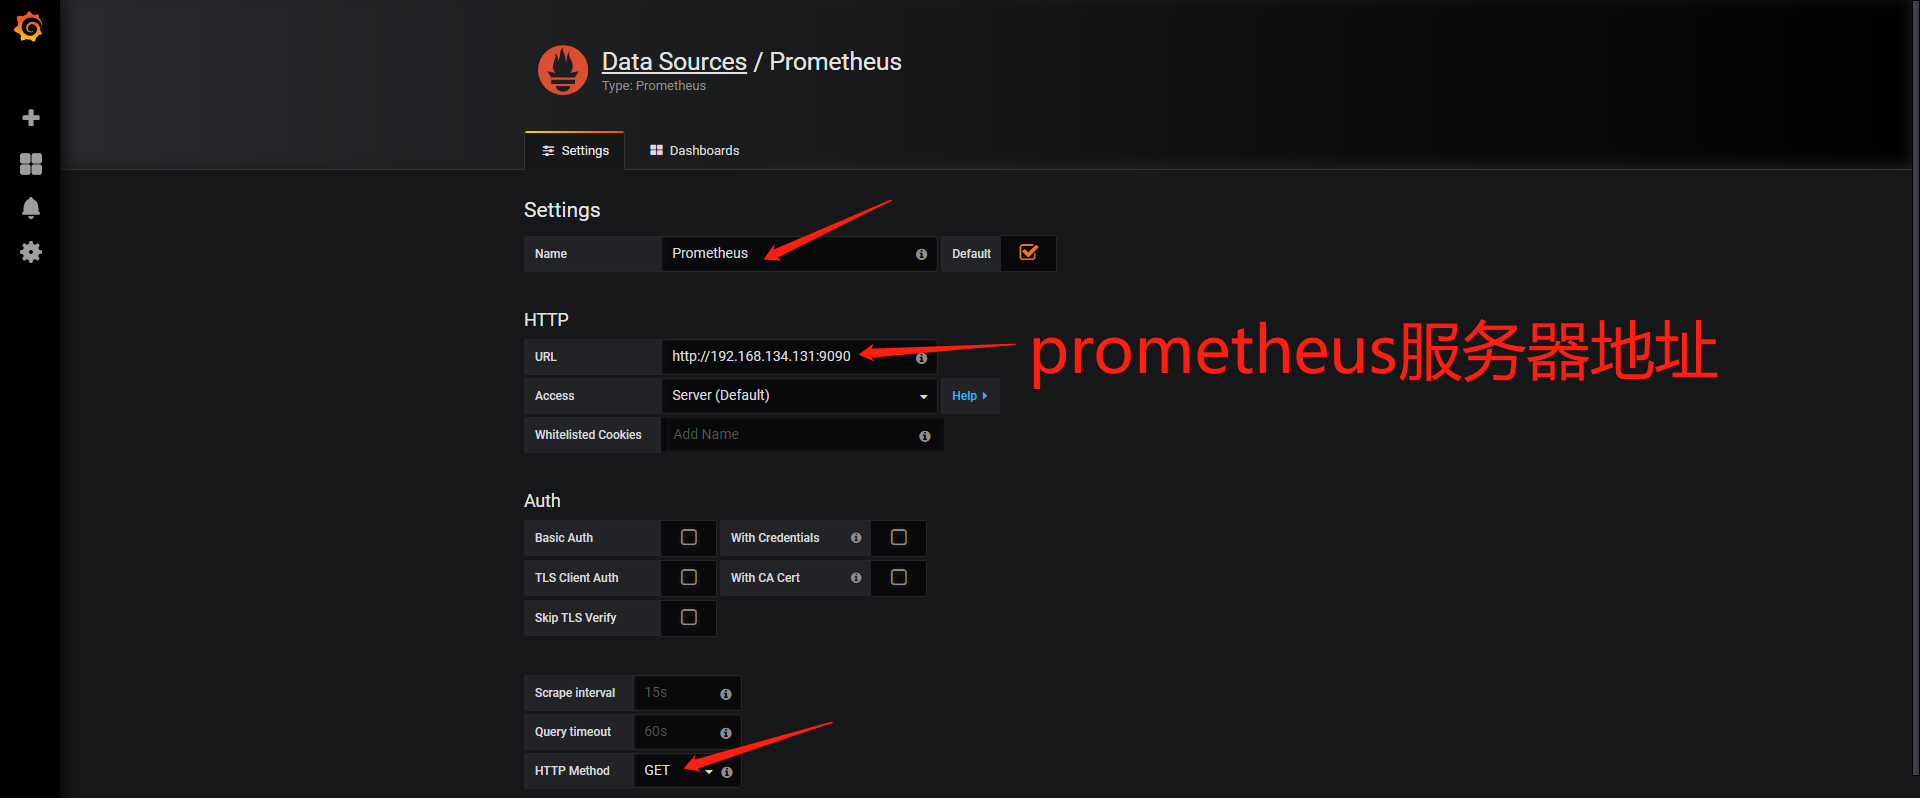
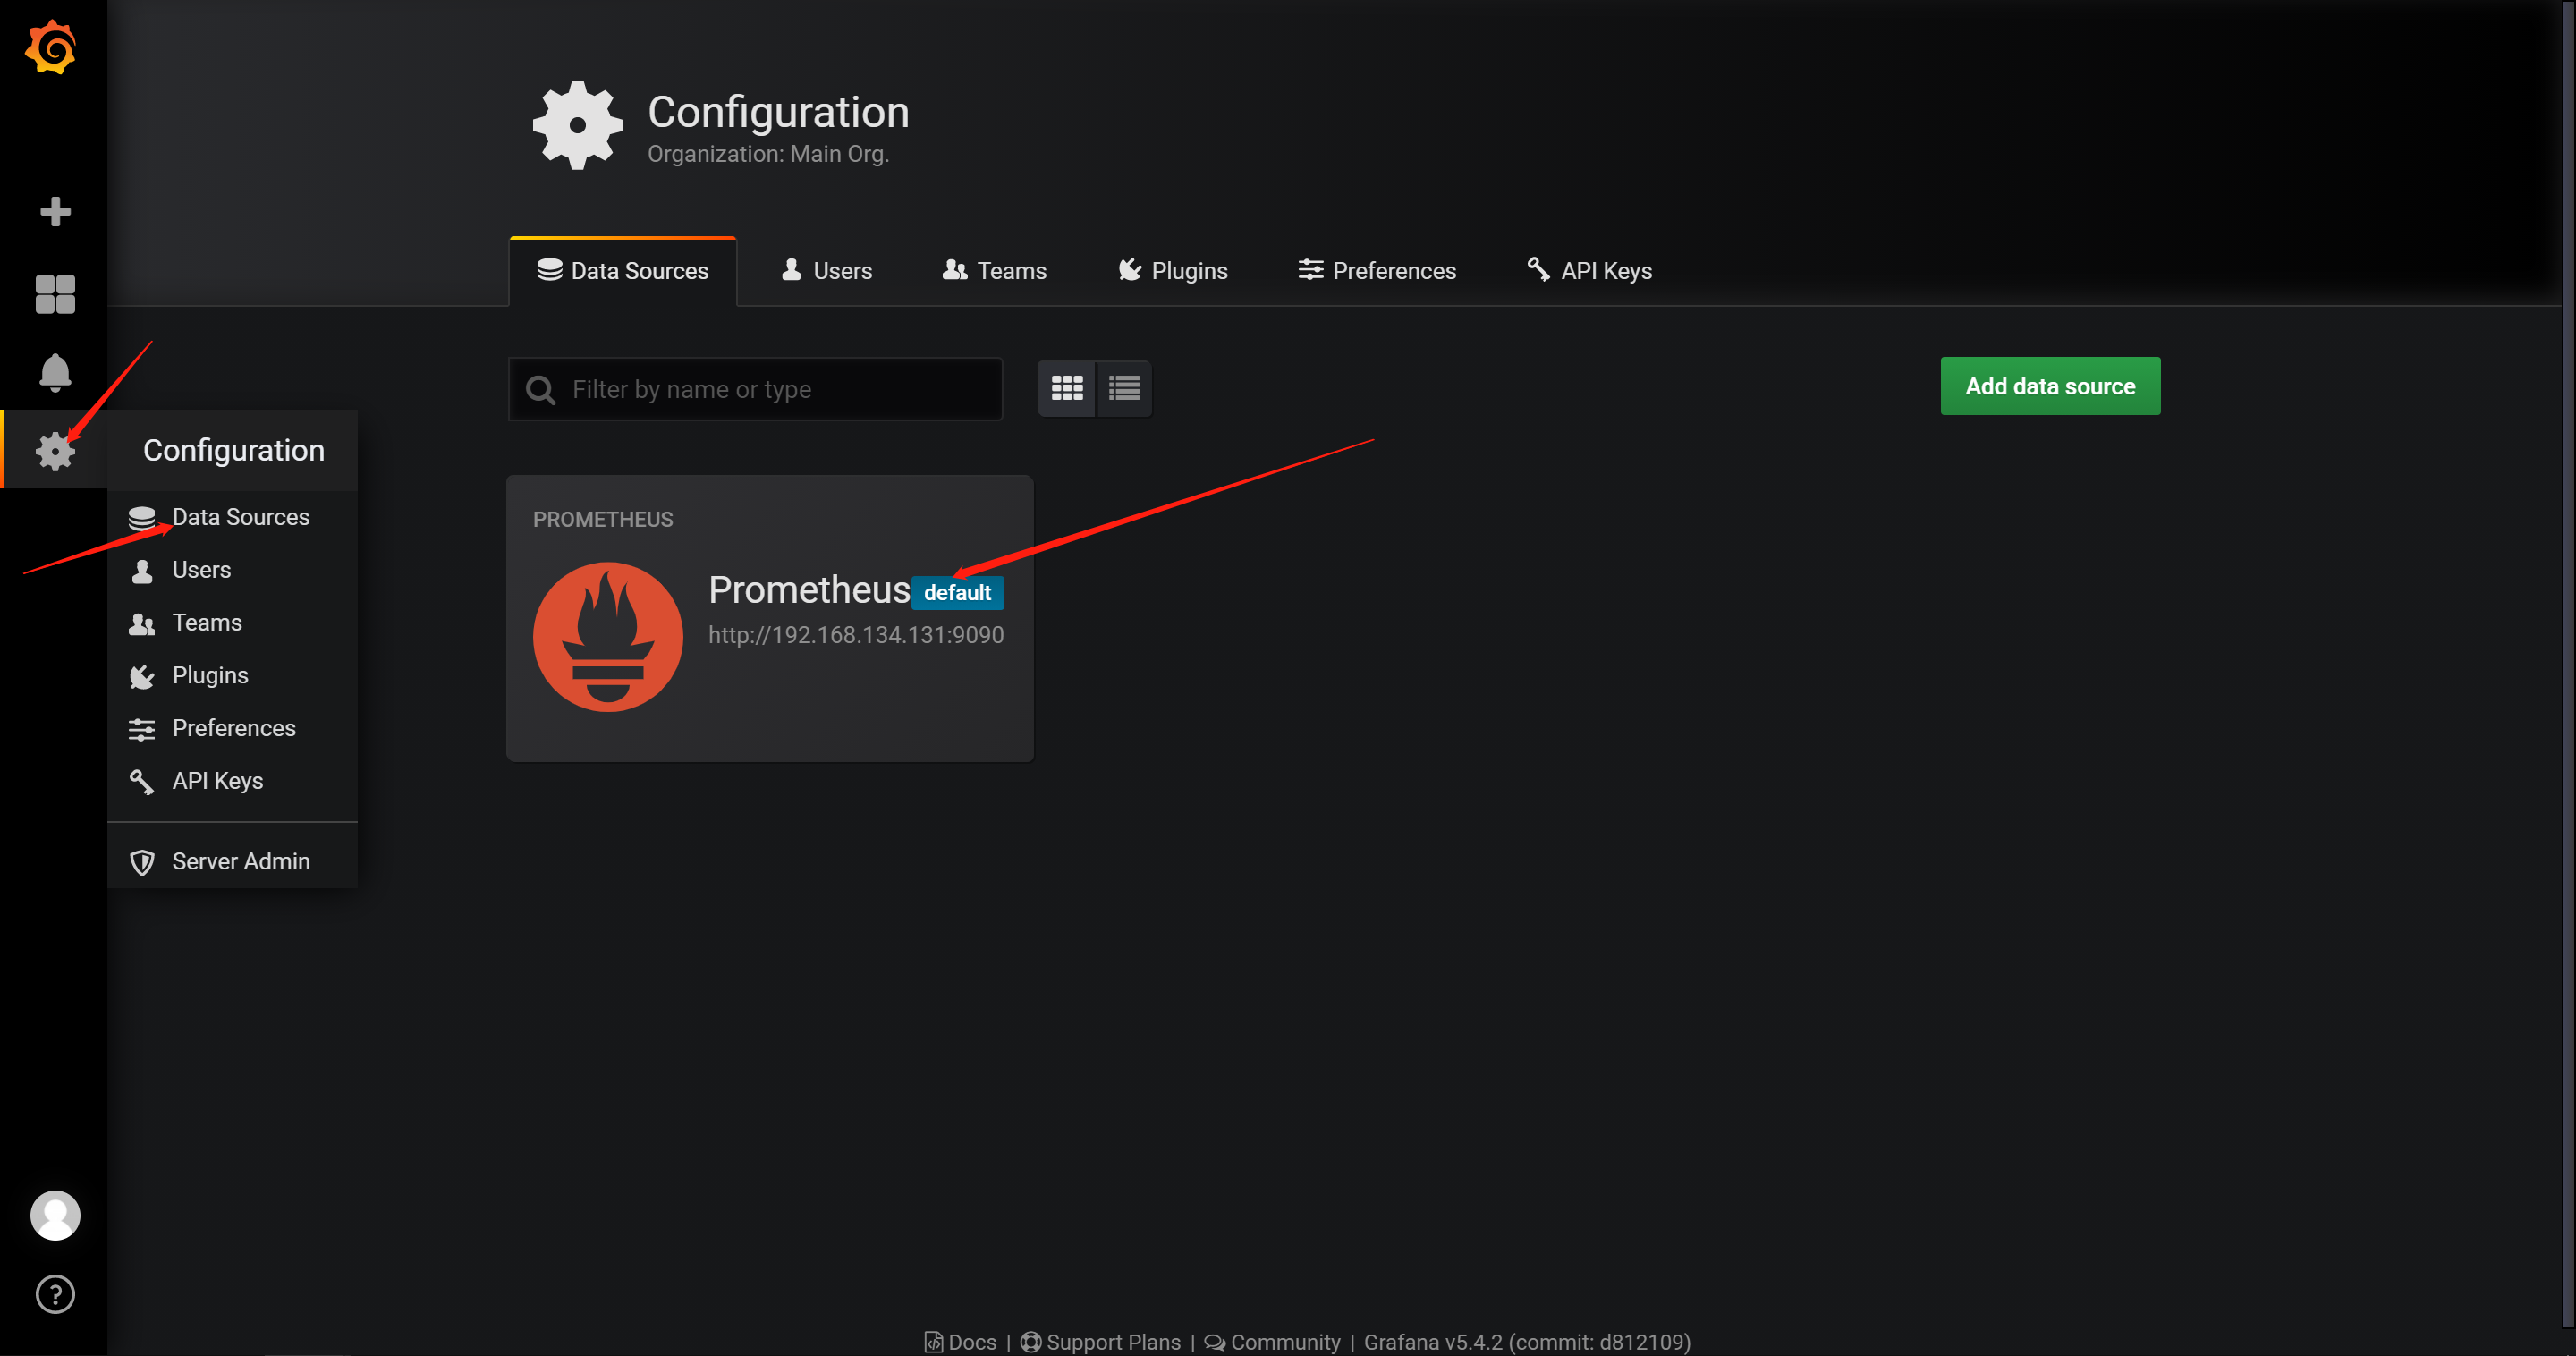
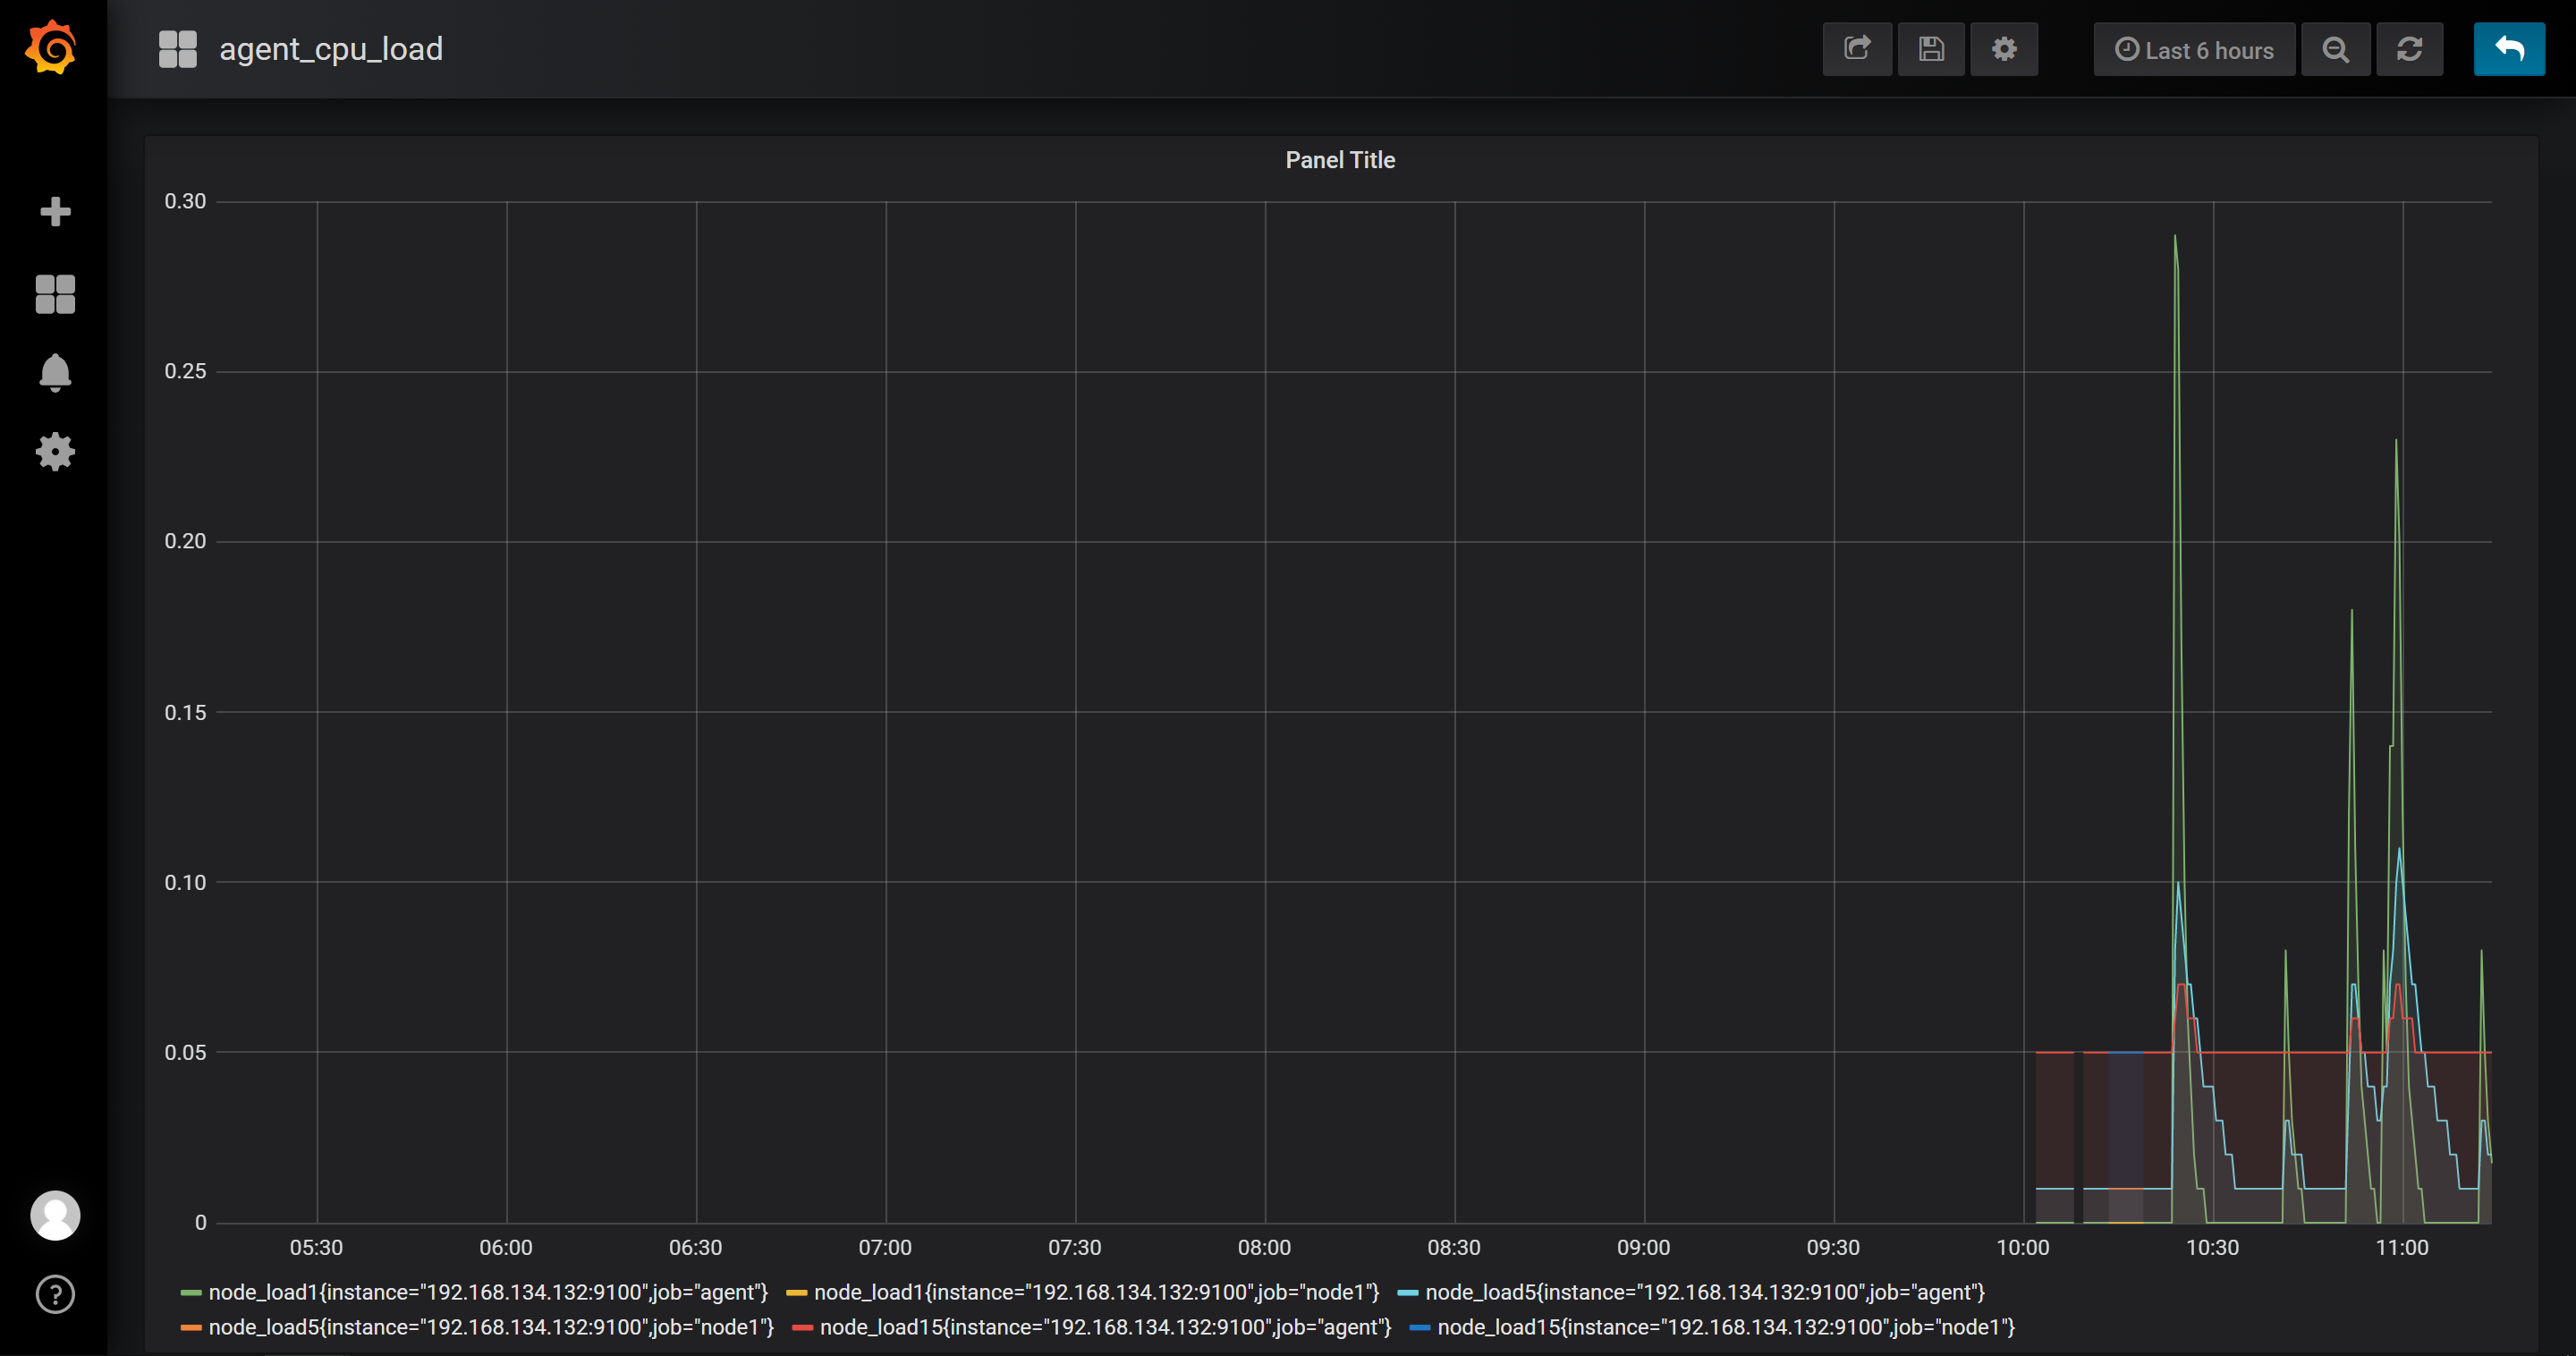
我们把prometheus服务器收集的数据做为一个数据源添加到 grafana,让grafana可以得到prometheus的数据。
然后为添加好的数据源做图形显示

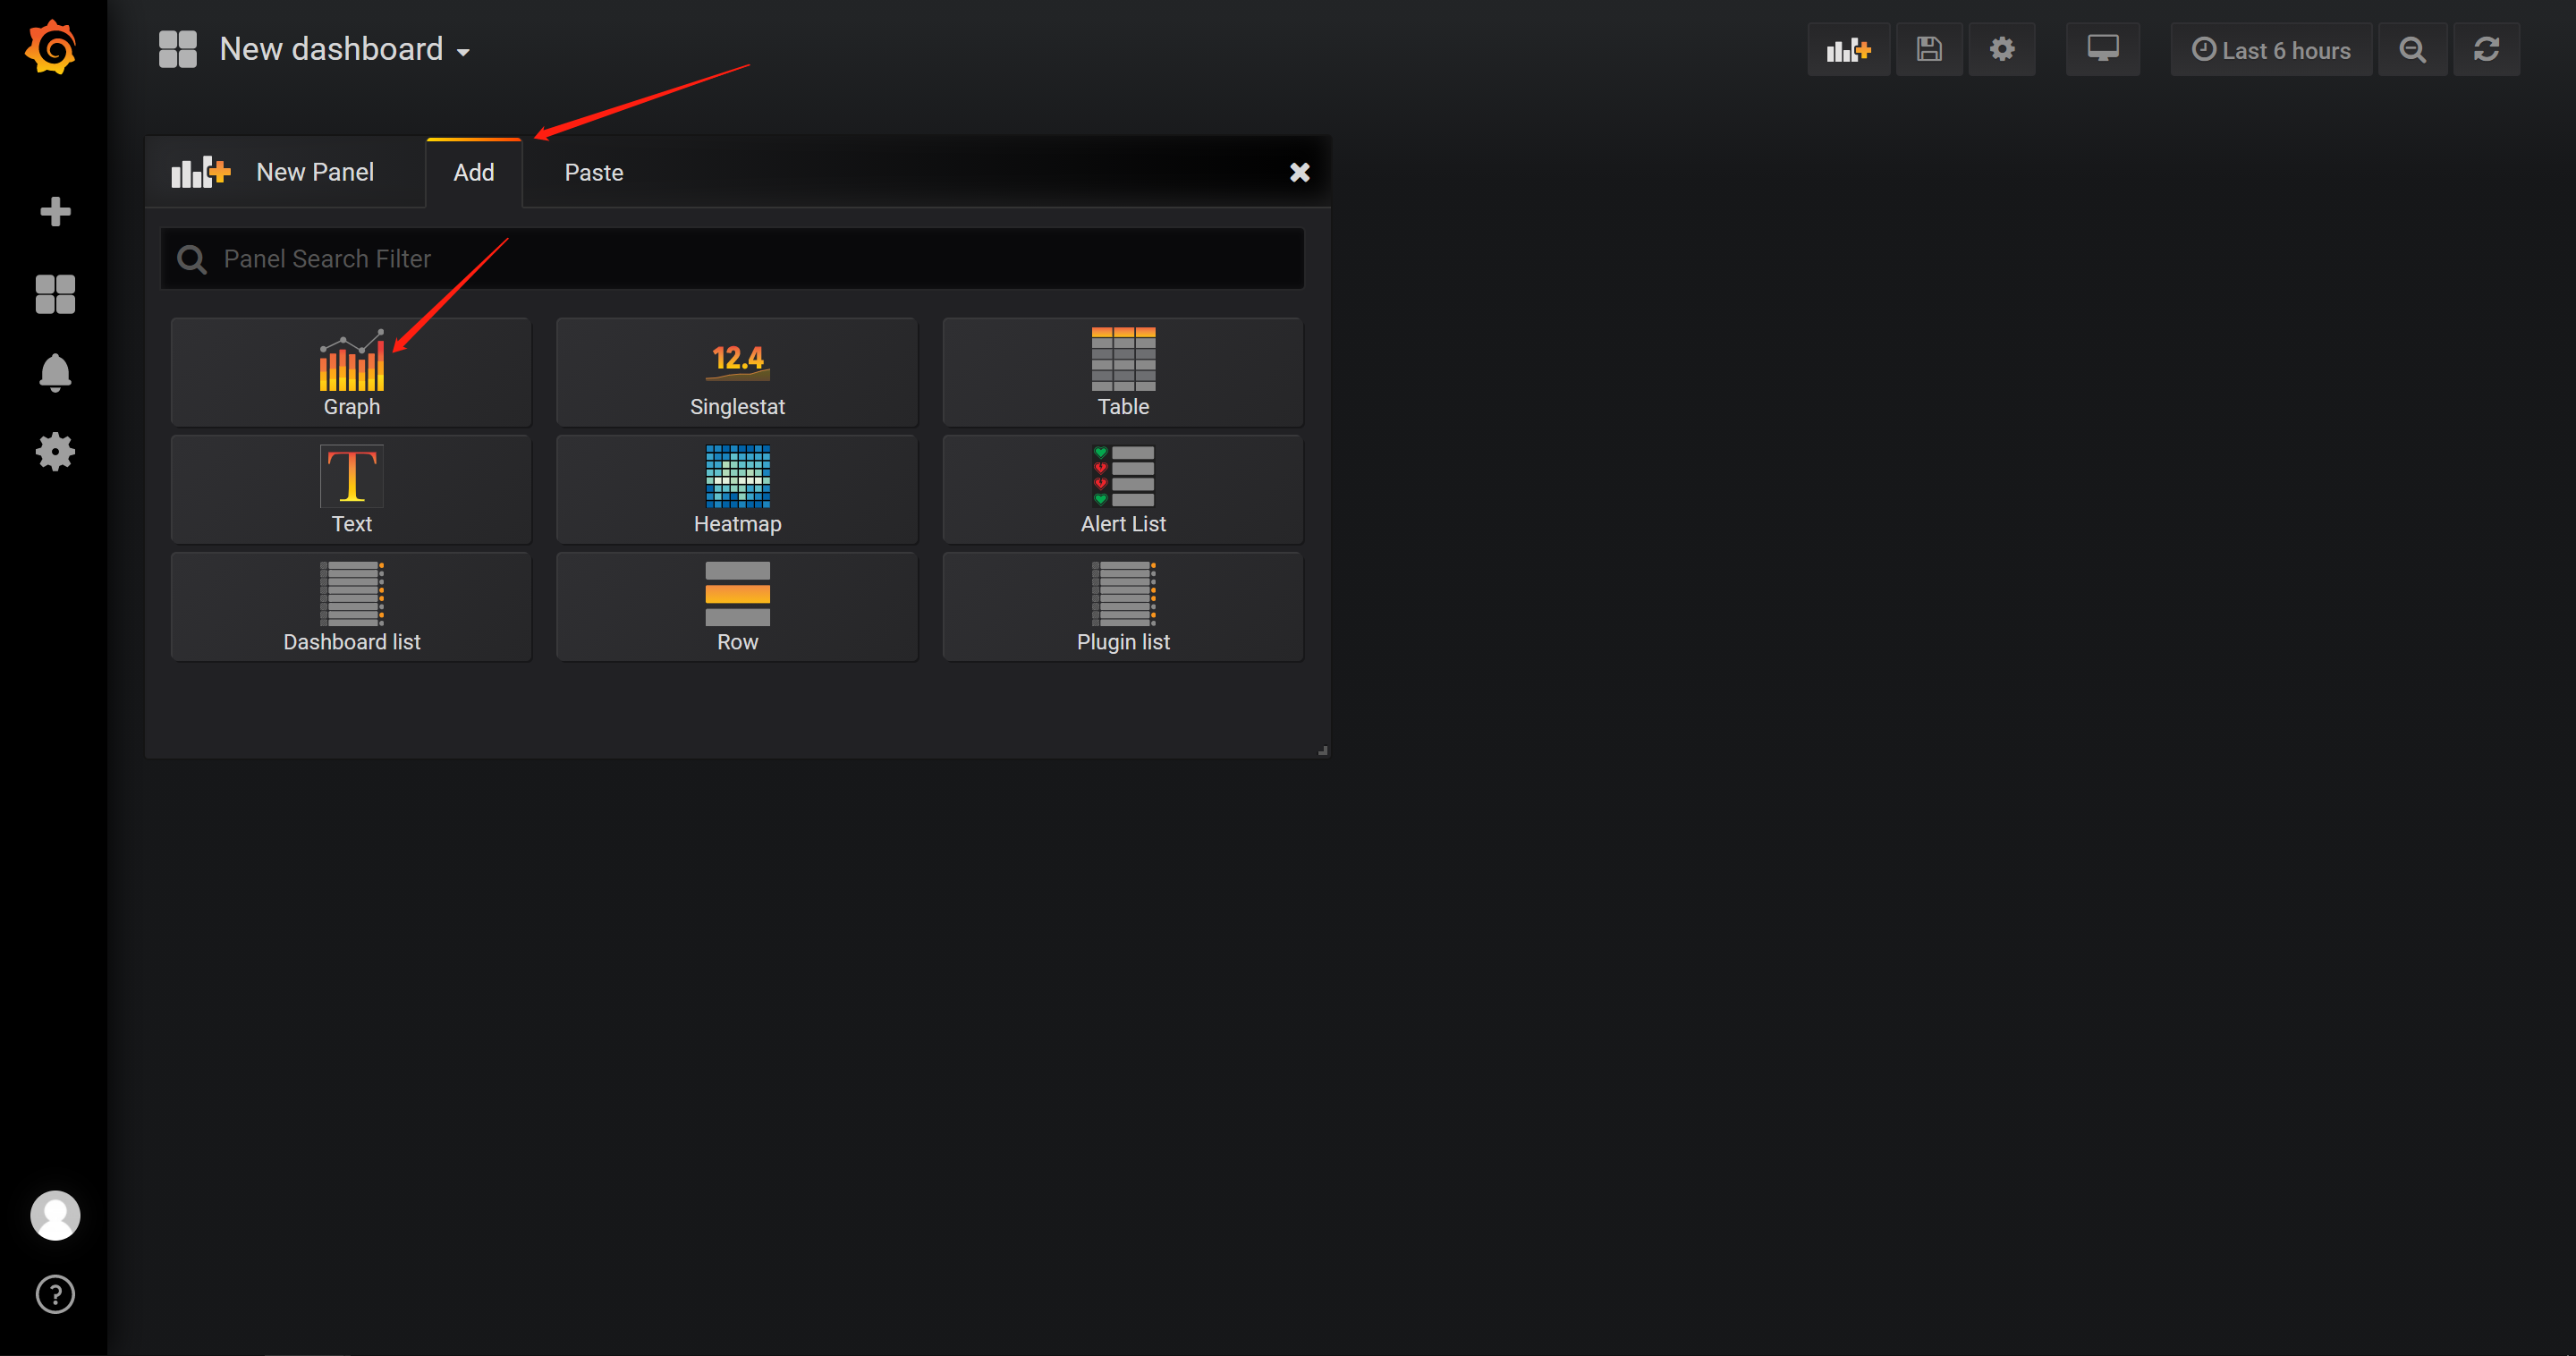
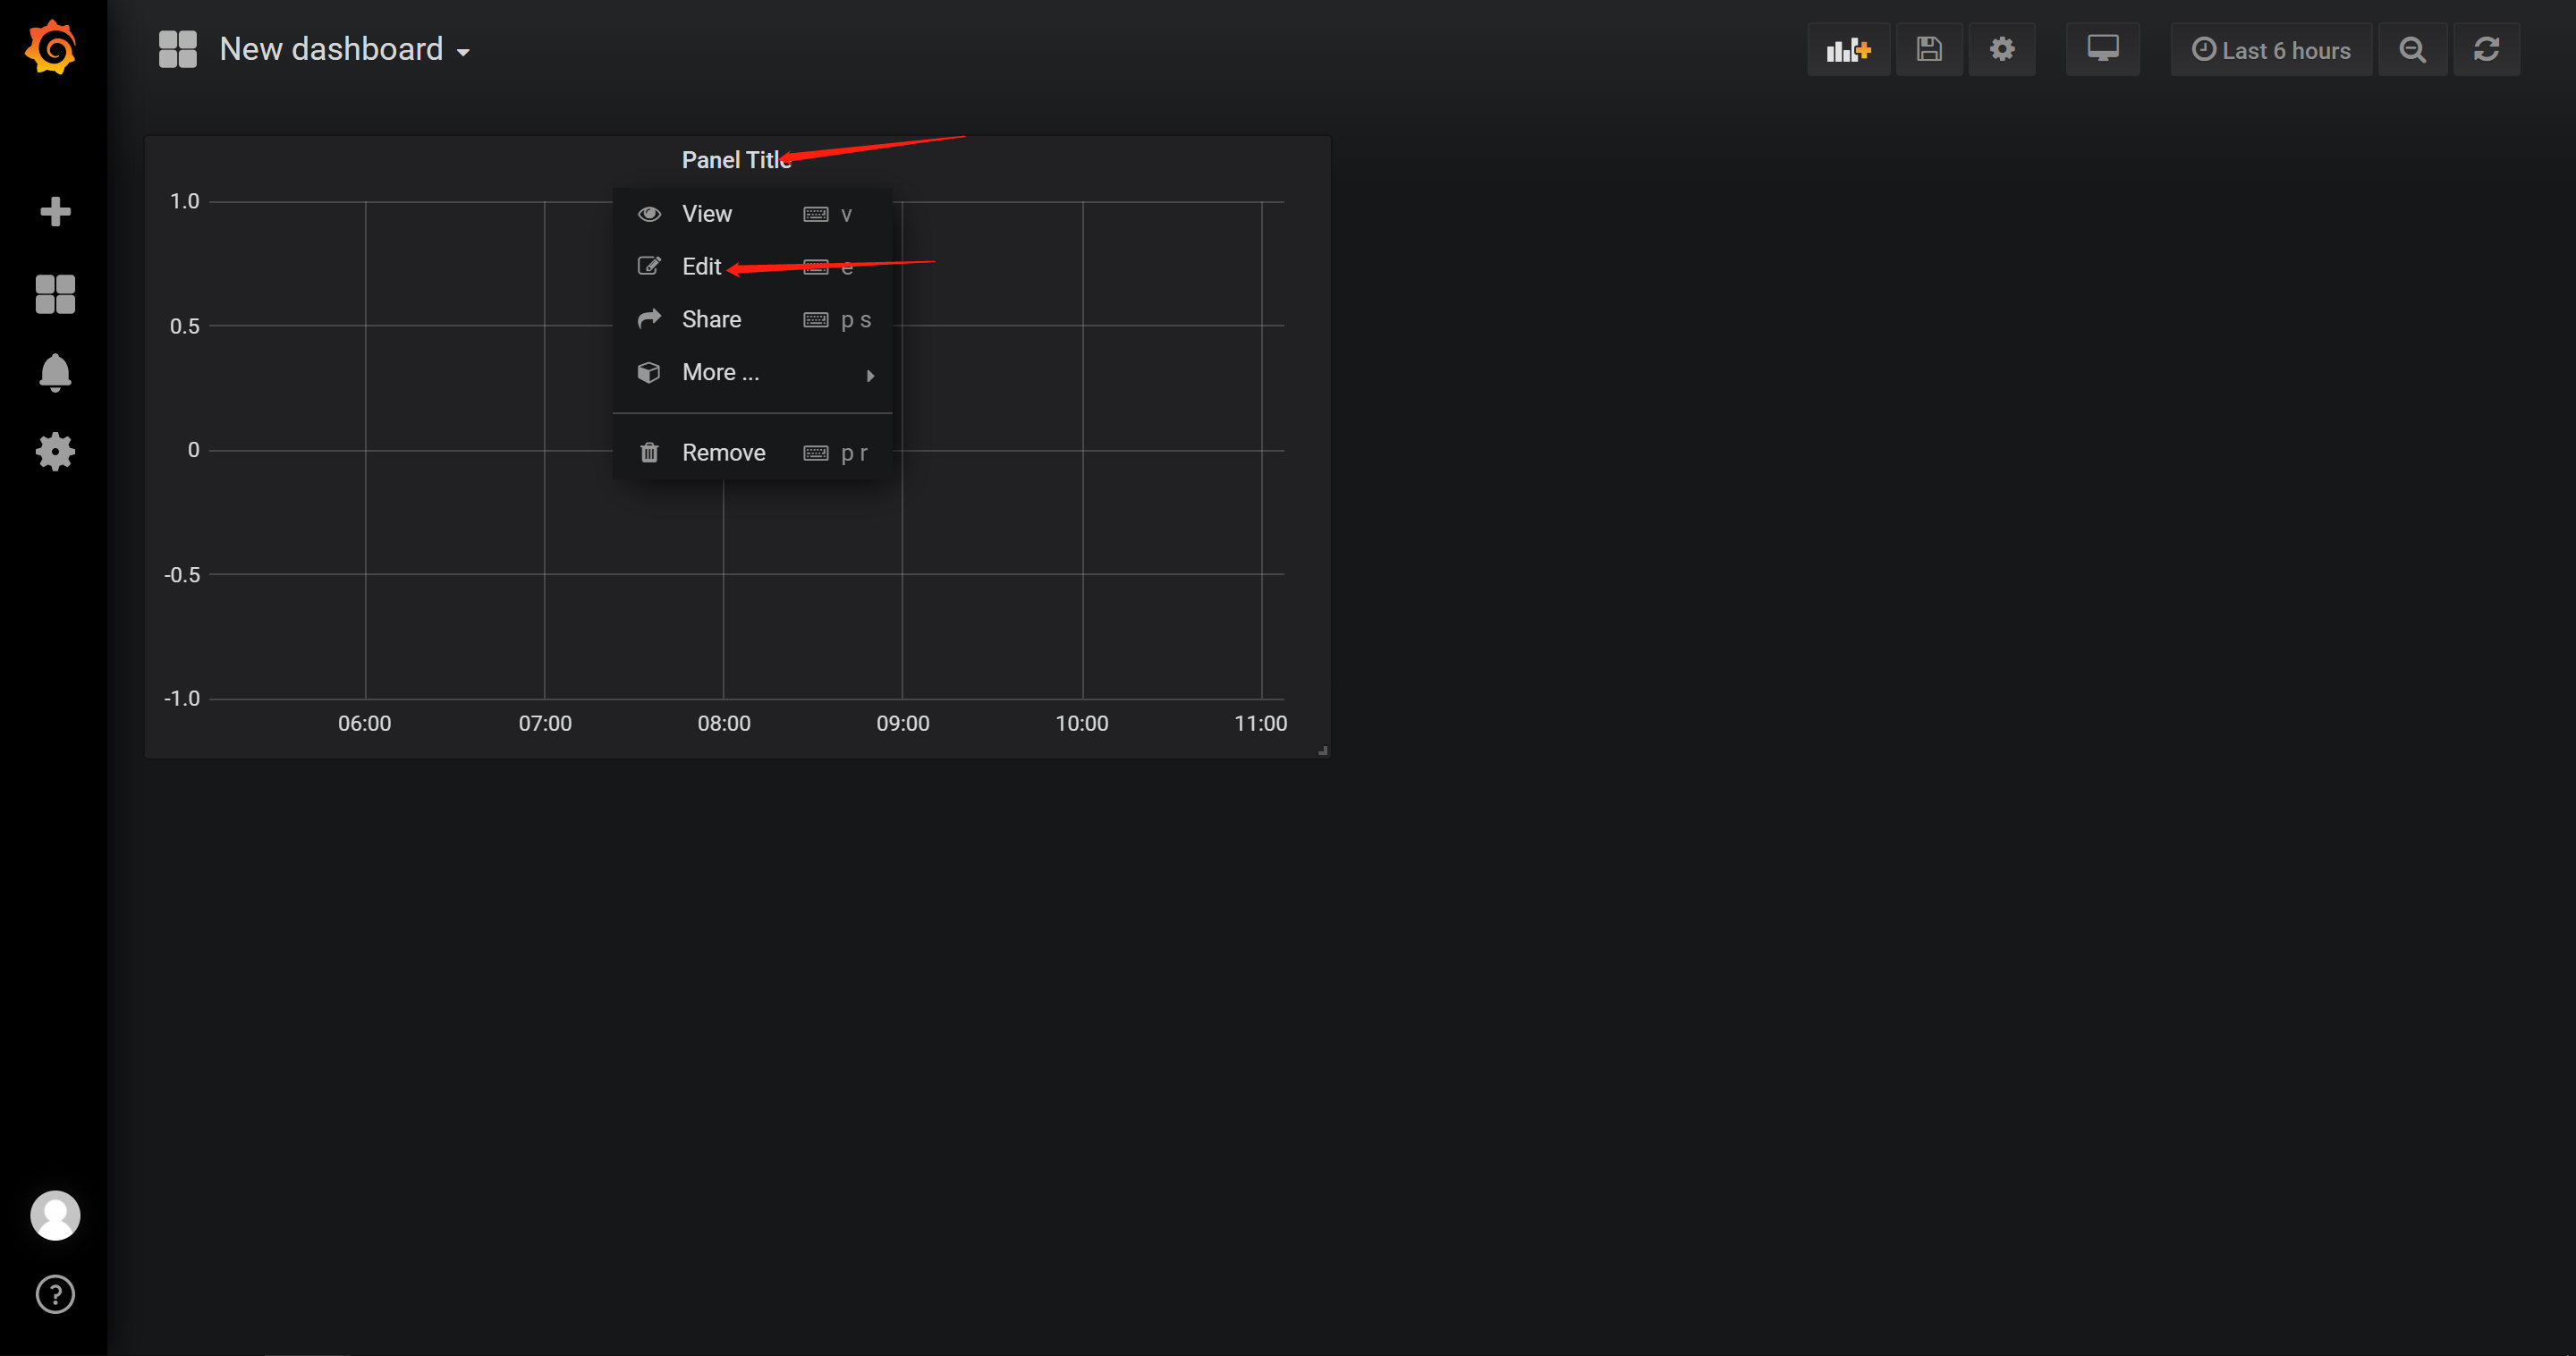
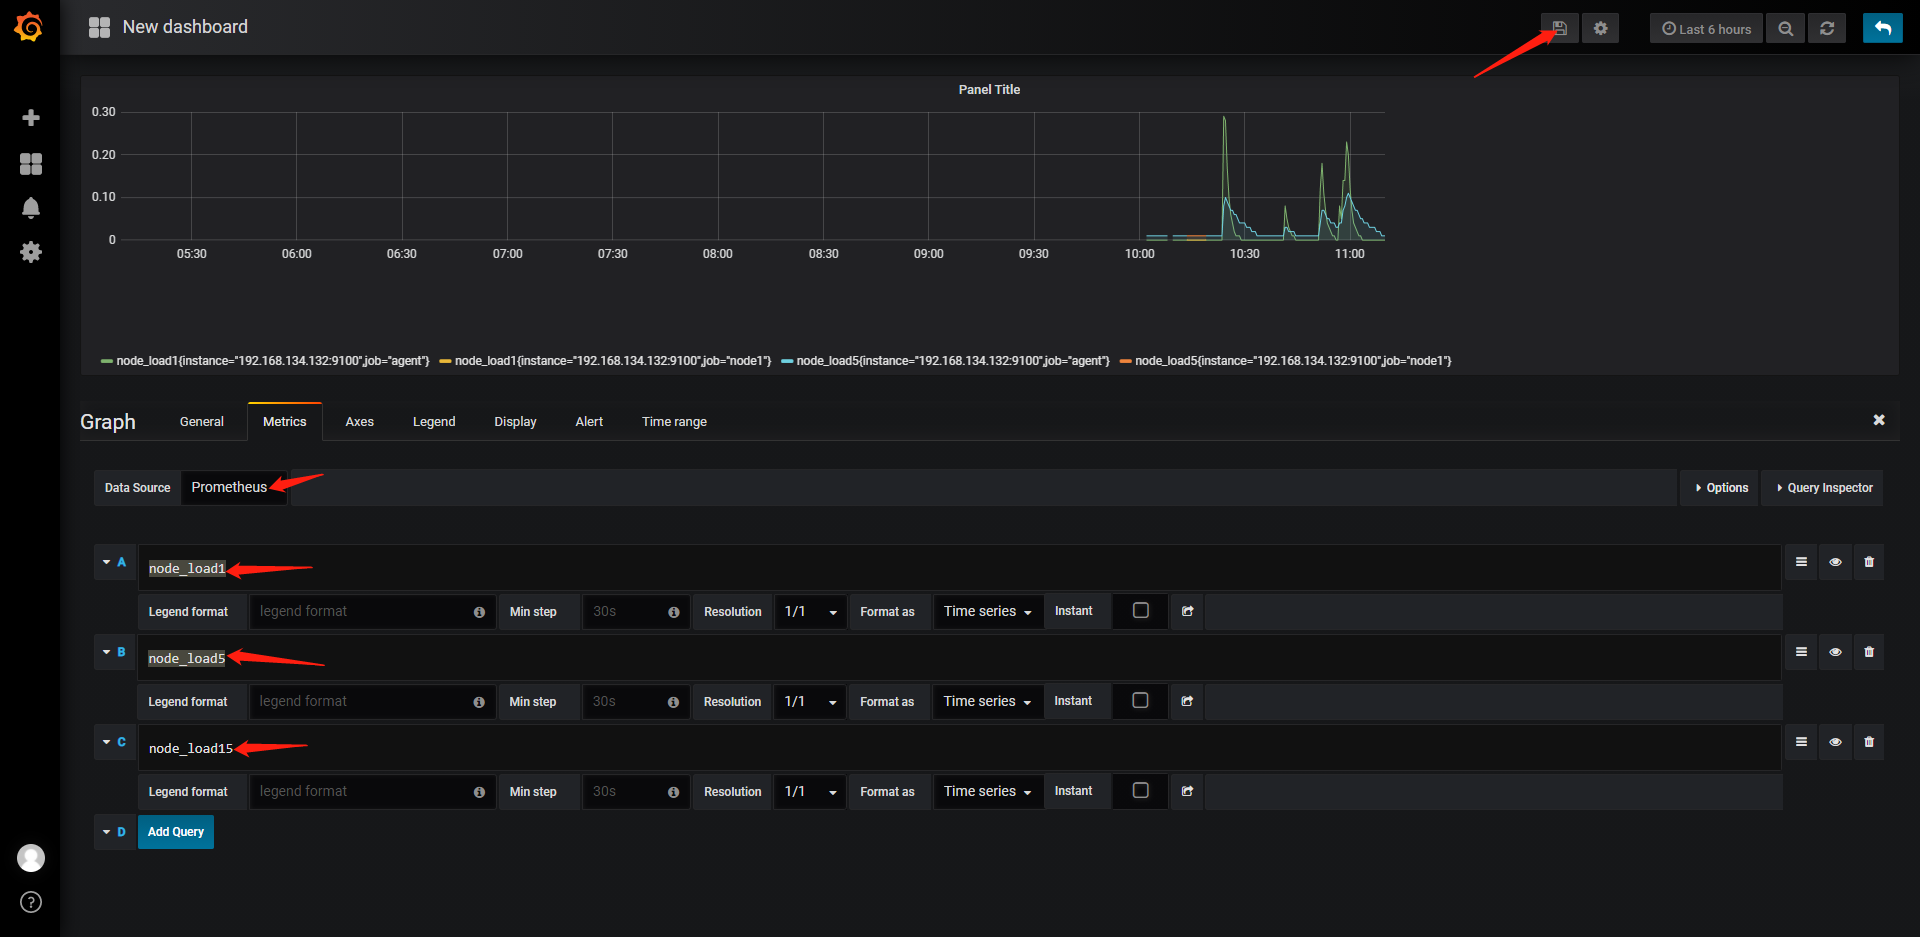
保存
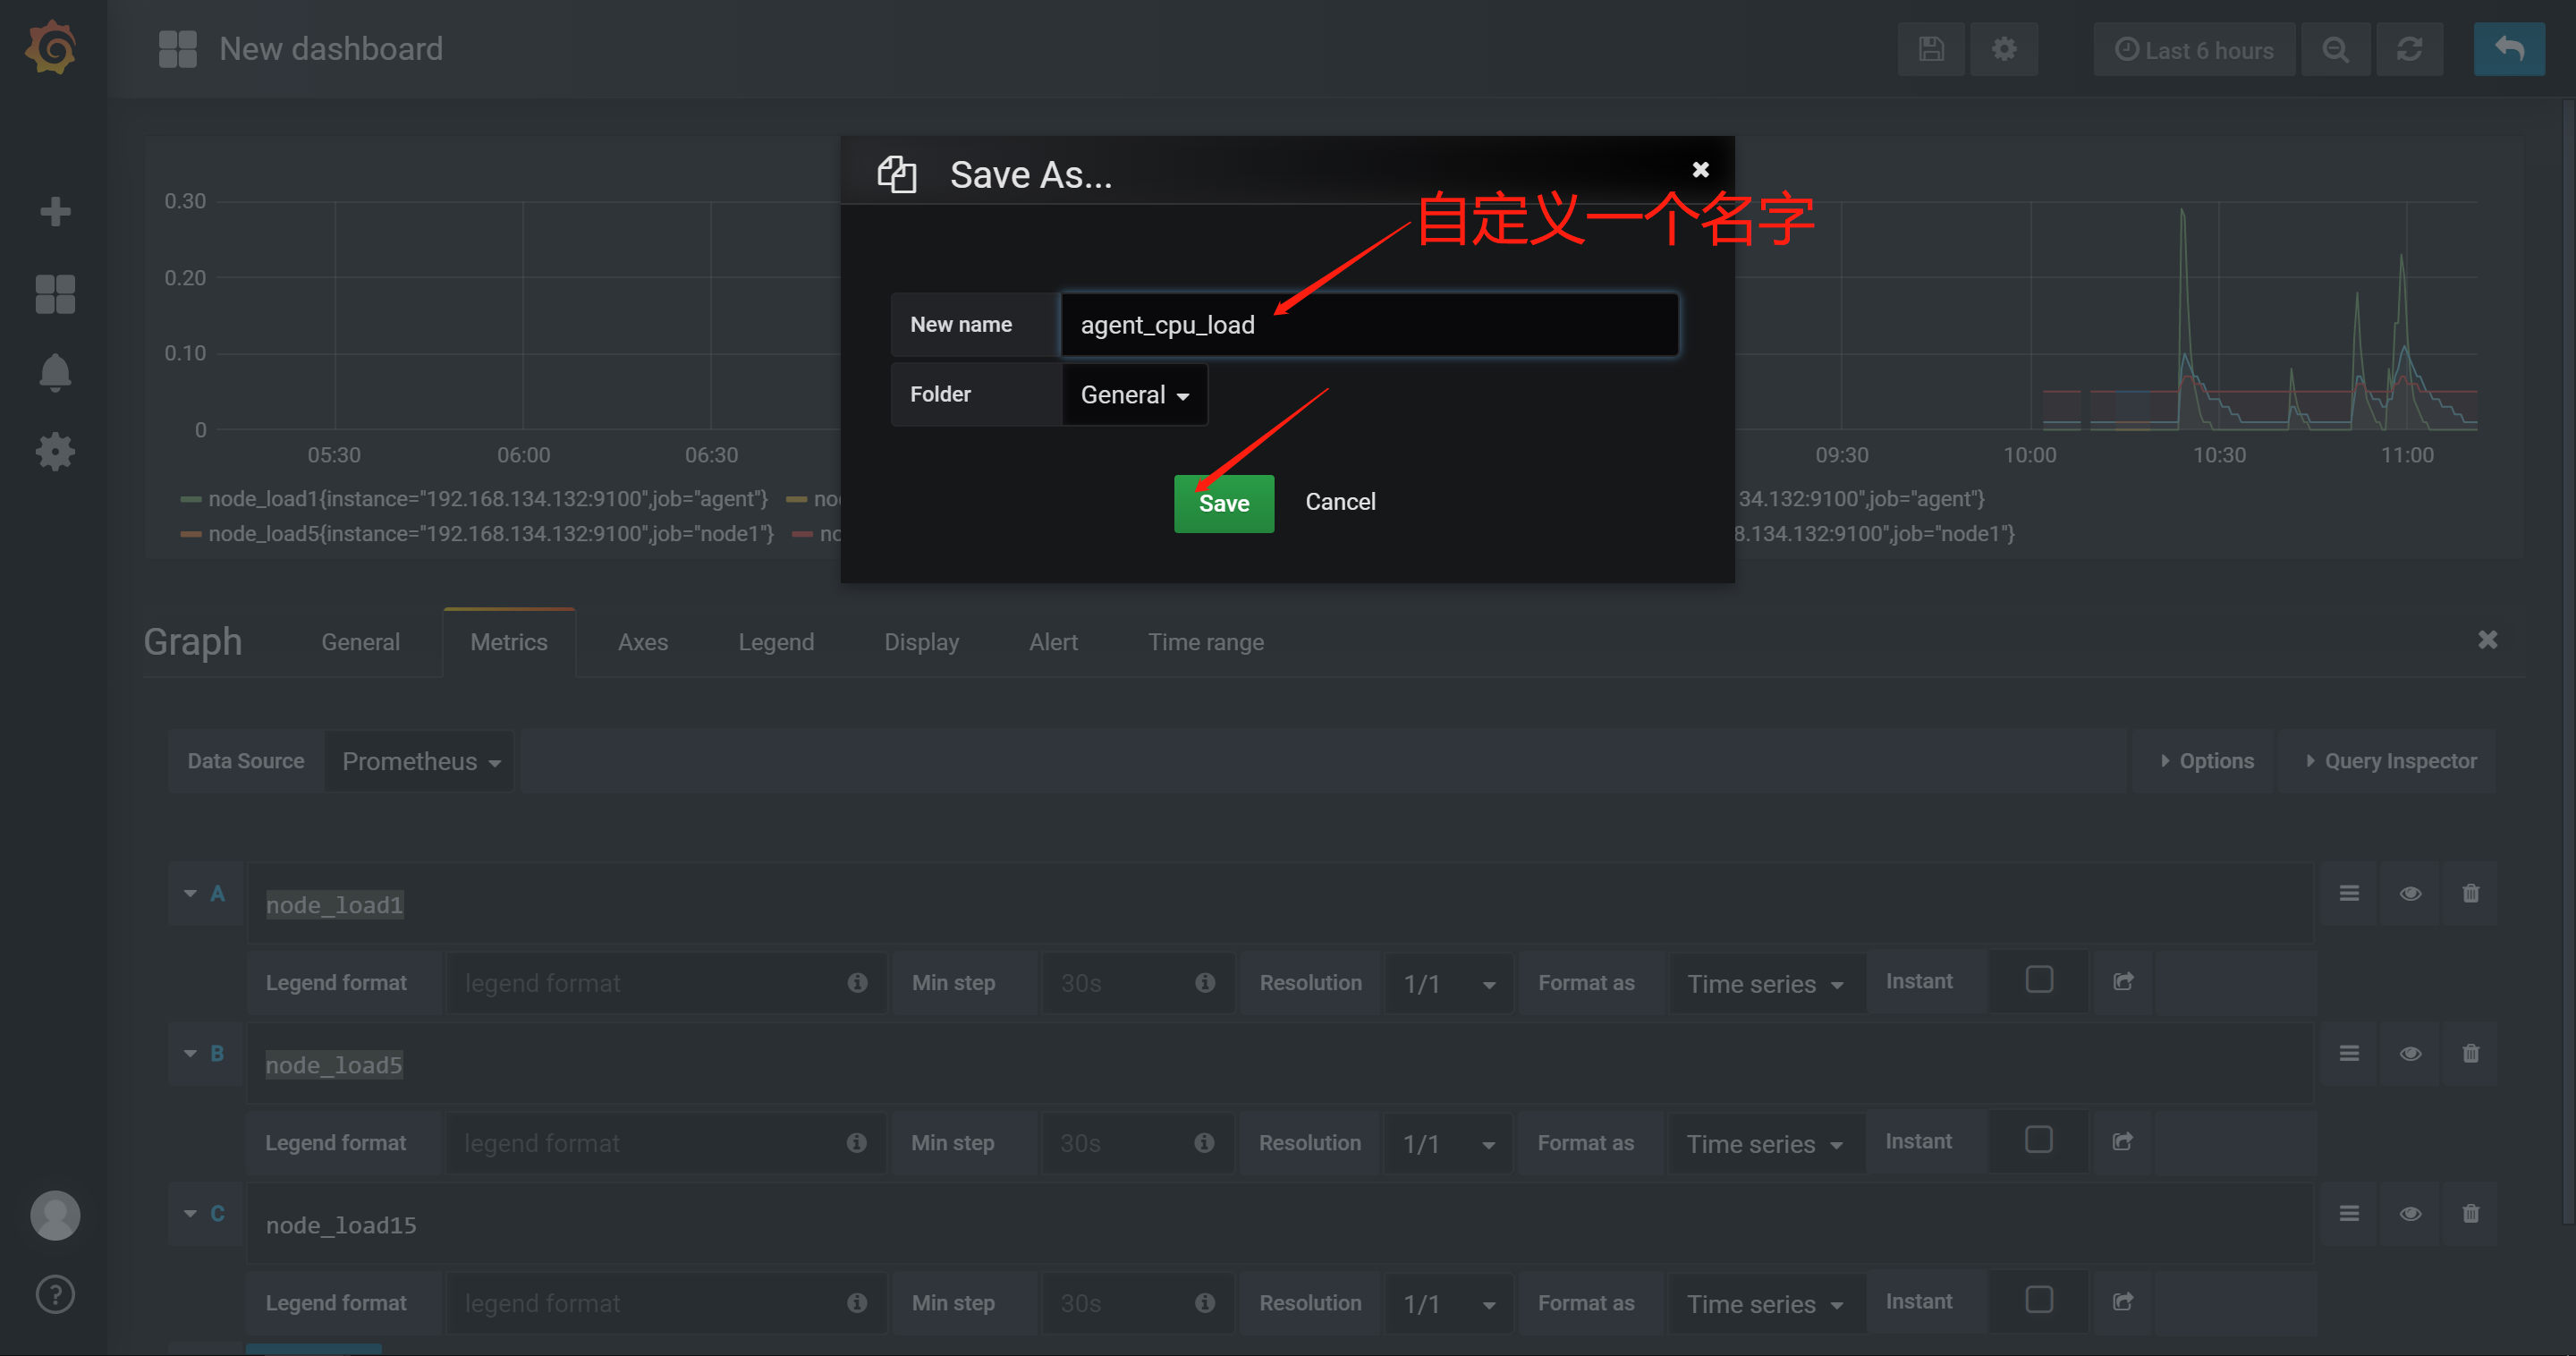
最后在dashboard可以查看到
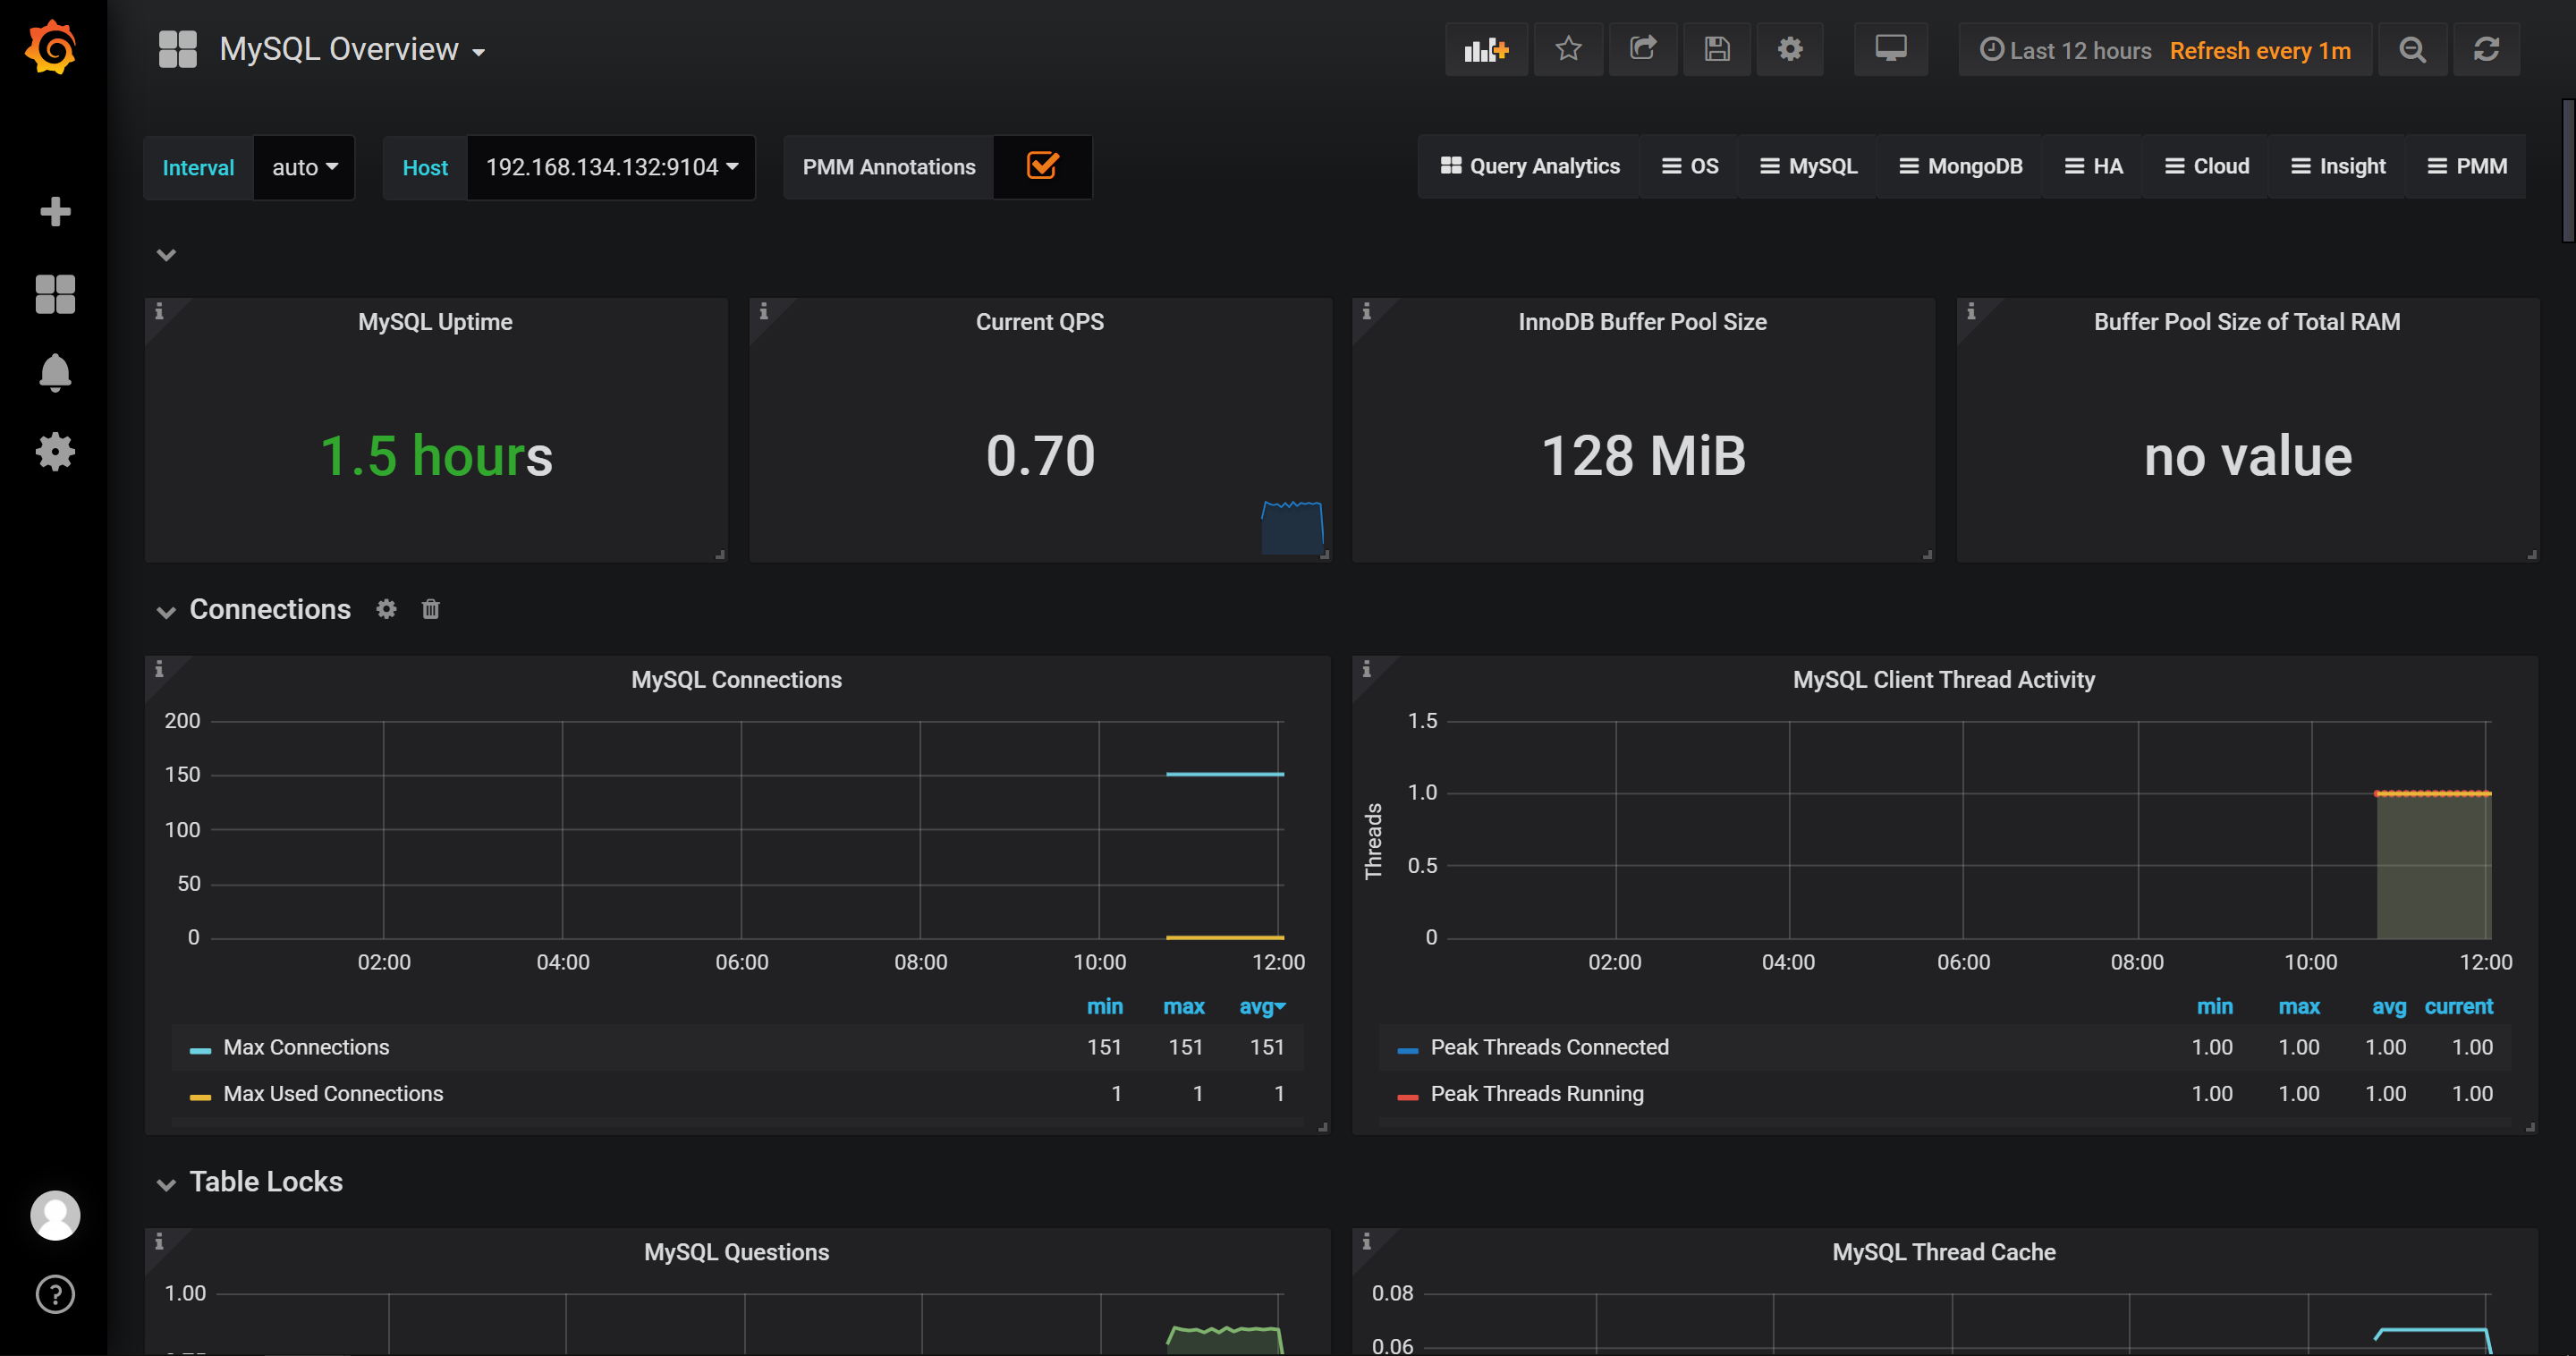
6.Promethus的Grafana图形显示MySQL监控数据
6.1在grafana上修改配置文件,并下载安装mysql监控的dashboard(包含 相关json文件,这些json文件可以看作是开发人员开发的一个监控模板)
参考网址: https://github.com/percona/grafana-dashboards
在grafana配置文件里最后加上以下三行
[root@grafana ~]# tail -3 /etc/grafana/grafana.ini
[dashboards.json]
enabled = true
path = /var/lib/grafana/dashboards
下载配置模板
cd /var/lib/grafana/
git clone https://github.com/percona/grafana-dashboards.git
cp -r /var/lib/grafana/grafana-dashboards-master/dashboards/ /var/lib/grafana/
[root@grafana grafana]# ls
dashboards  grafana.db  plugins  png  sessions
[root@grafana grafana]# ls dashboards/
Advanced_Data_Exploration.json               MySQL_InnoDB_Compression_Details.json   Node_Summary.json
CPU_Utilization_Details.json                 MySQL_InnoDB_Details.json               Node_Temperature_Details.json
Disk_Details.json                            MySQL_Instances_Compare.json            NUMA_Details.json
HAProxy_Instance_Summary.json                MySQL_Instances_Overview.json           pmm-qan.json
Home_Dashboard.json                          MySQL_Instance_Summary.json             PostgreSQL_Instances_Compare.json
Memory_Details.json                          MySQL_MyISAM_Aria_Details.json          PostgreSQL_Instances_Overview.json
MongoDB_Cluster_Summary.json                 MySQL_MyRocks_Details.json              PostgreSQL_Instance_Summary.json
MongoDB_InMemory_Details.json                MySQL_Performance_Schema_Details.json   Processes_Details.json
MongoDB_Instances_Compare.json               MySQL_Query_Response_Time_Details.json  Prometheus_Exporters_Overview.json
MongoDB_Instances_Overview.json              MySQL_Replication_Summary.json          Prometheus_Exporter_Status.json
MongoDB_Instance_Summary.json                MySQL_Table_Details.json                ProxySQL_Instance_Summary.json
MongoDB_MMAPv1_Details.json                  MySQL_TokuDB_Details.json               PXC_Galera_Cluster_Summary.json
MongoDB_ReplSet_Summary.json                 MySQL_User_Details.json                 PXC_Galera_Nodes_Compare.json
MongoDB_WiredTiger_Details.json              MySQL_Wait_Event_Analyses_Details.json  PXC_Galera_Node_Summary.json
MySQL_Amazon_Aurora_Details.json             Network_Details.json                    VictoriaMetrics_Agents_Overview.json
MySQL_Command_Handler_Counters_Compare.json  Nodes_Compare.json                      VictoriaMetrics.json
MySQL_Group_Replication_Summary.json         Nodes_Overview.json
重启grafana服务
[root@grafana grafana]# systemctl restart grafana-server.service
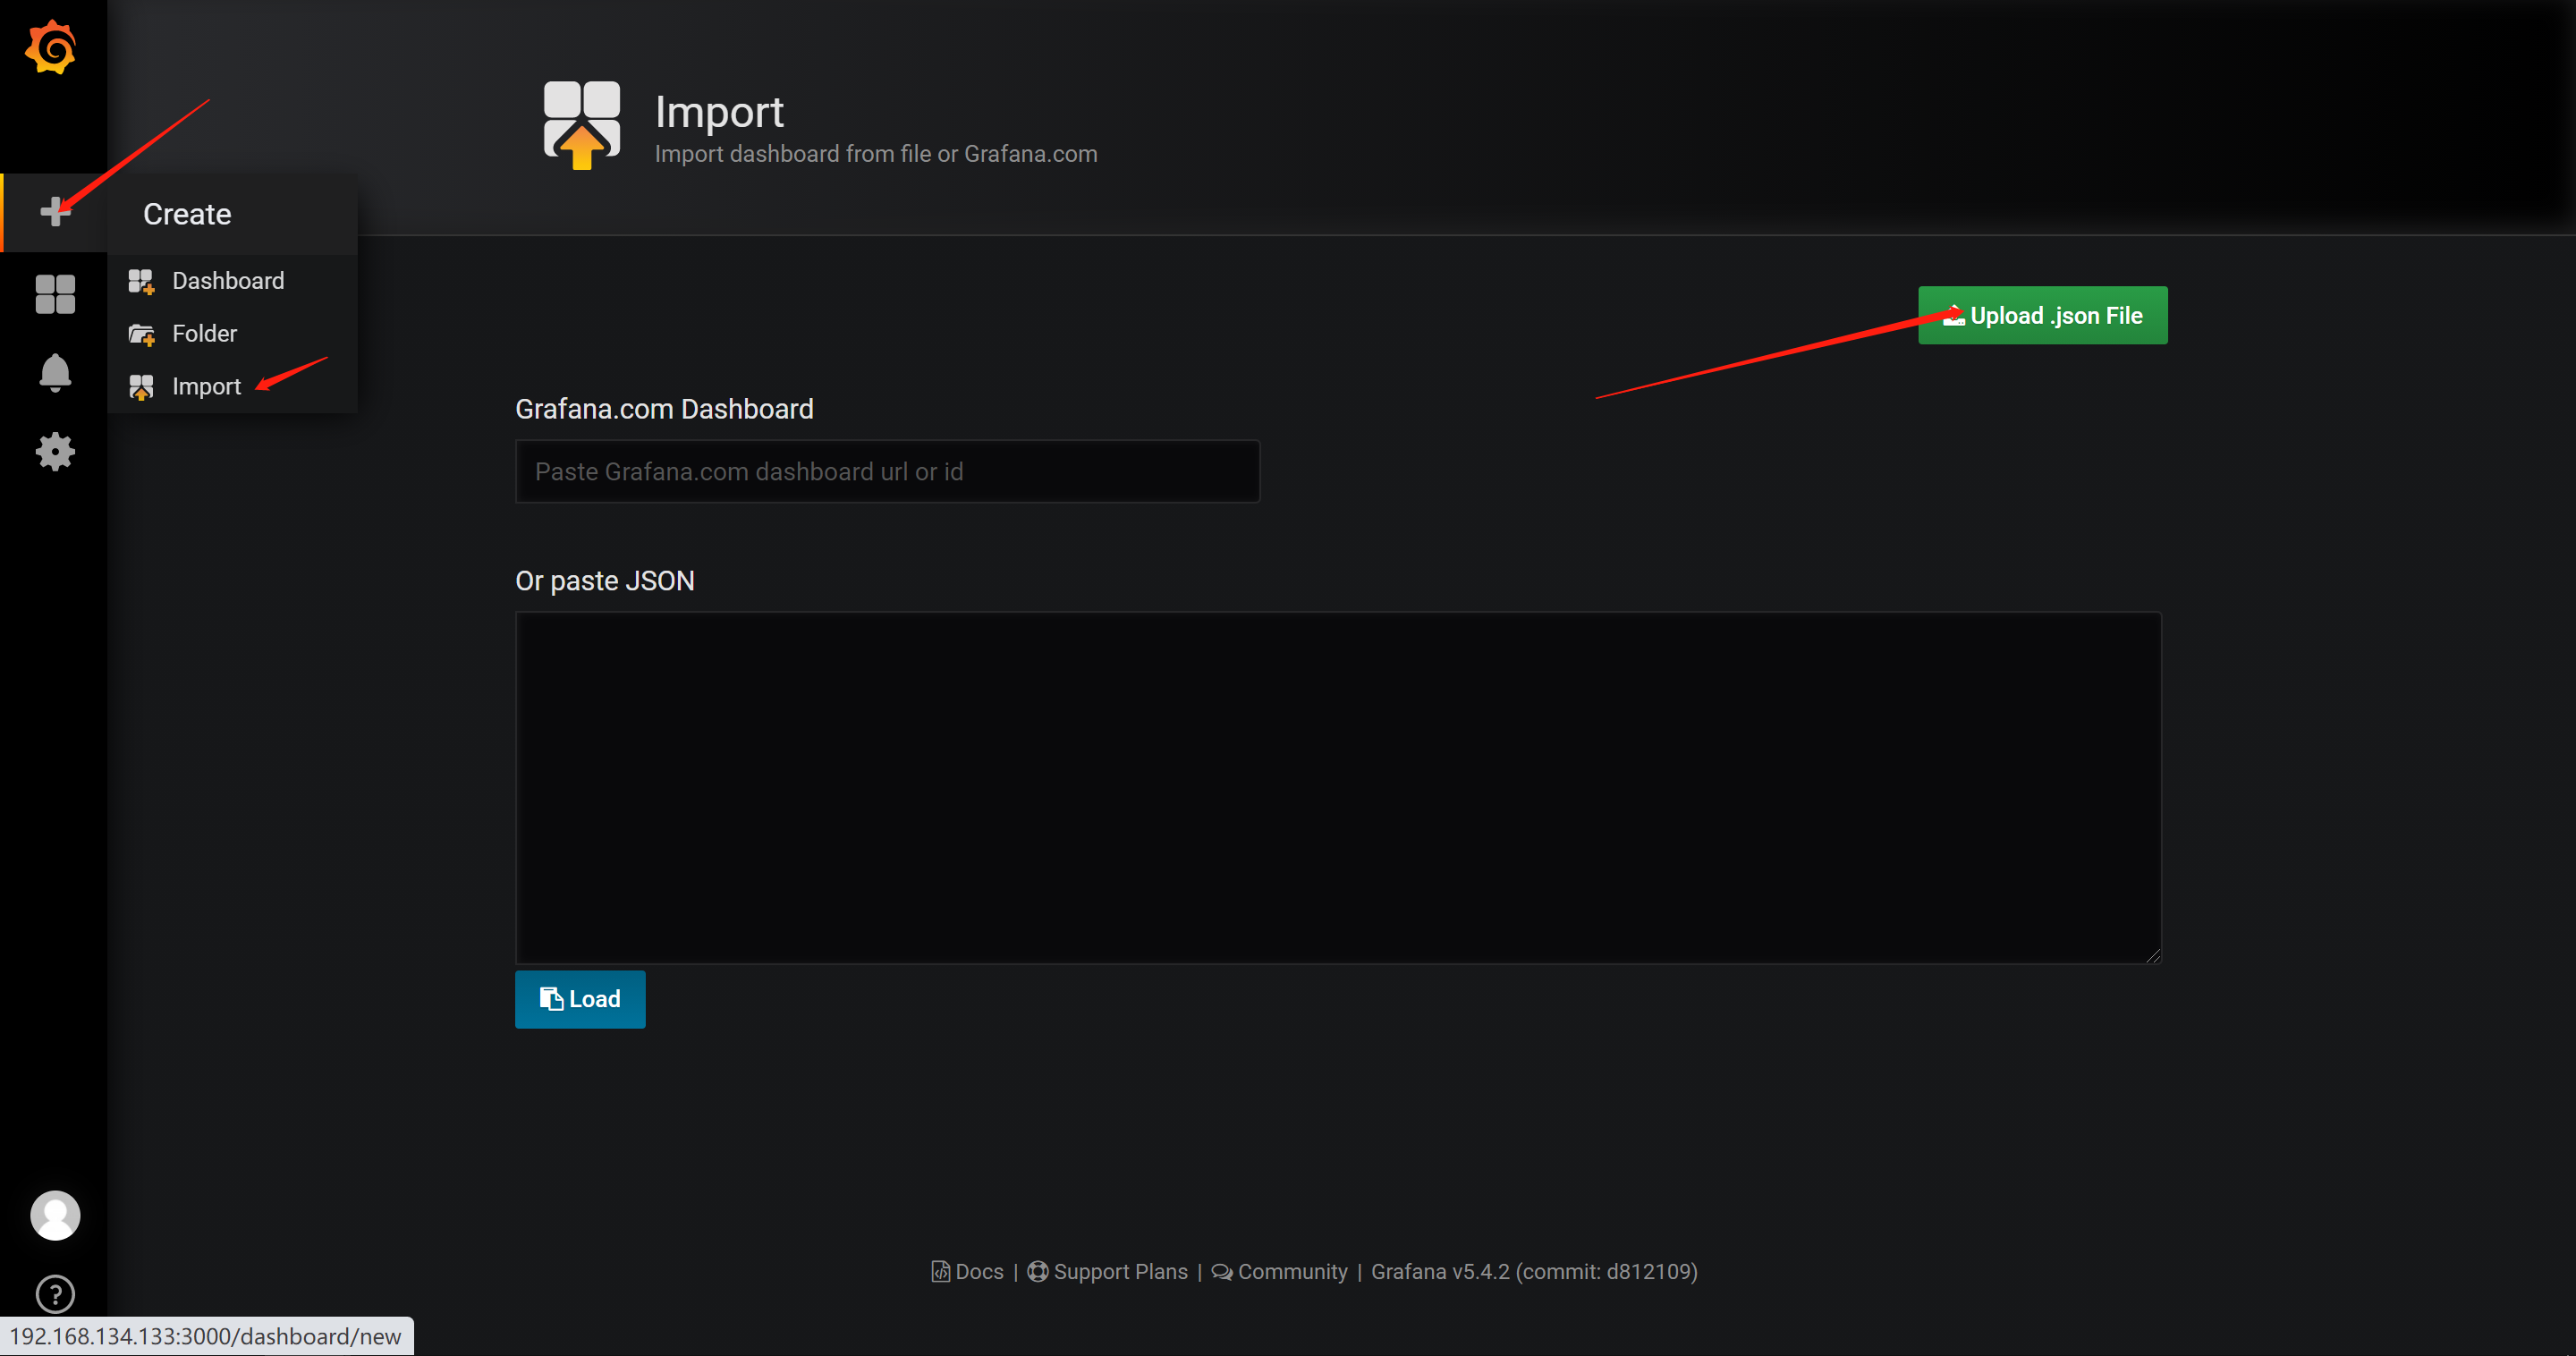
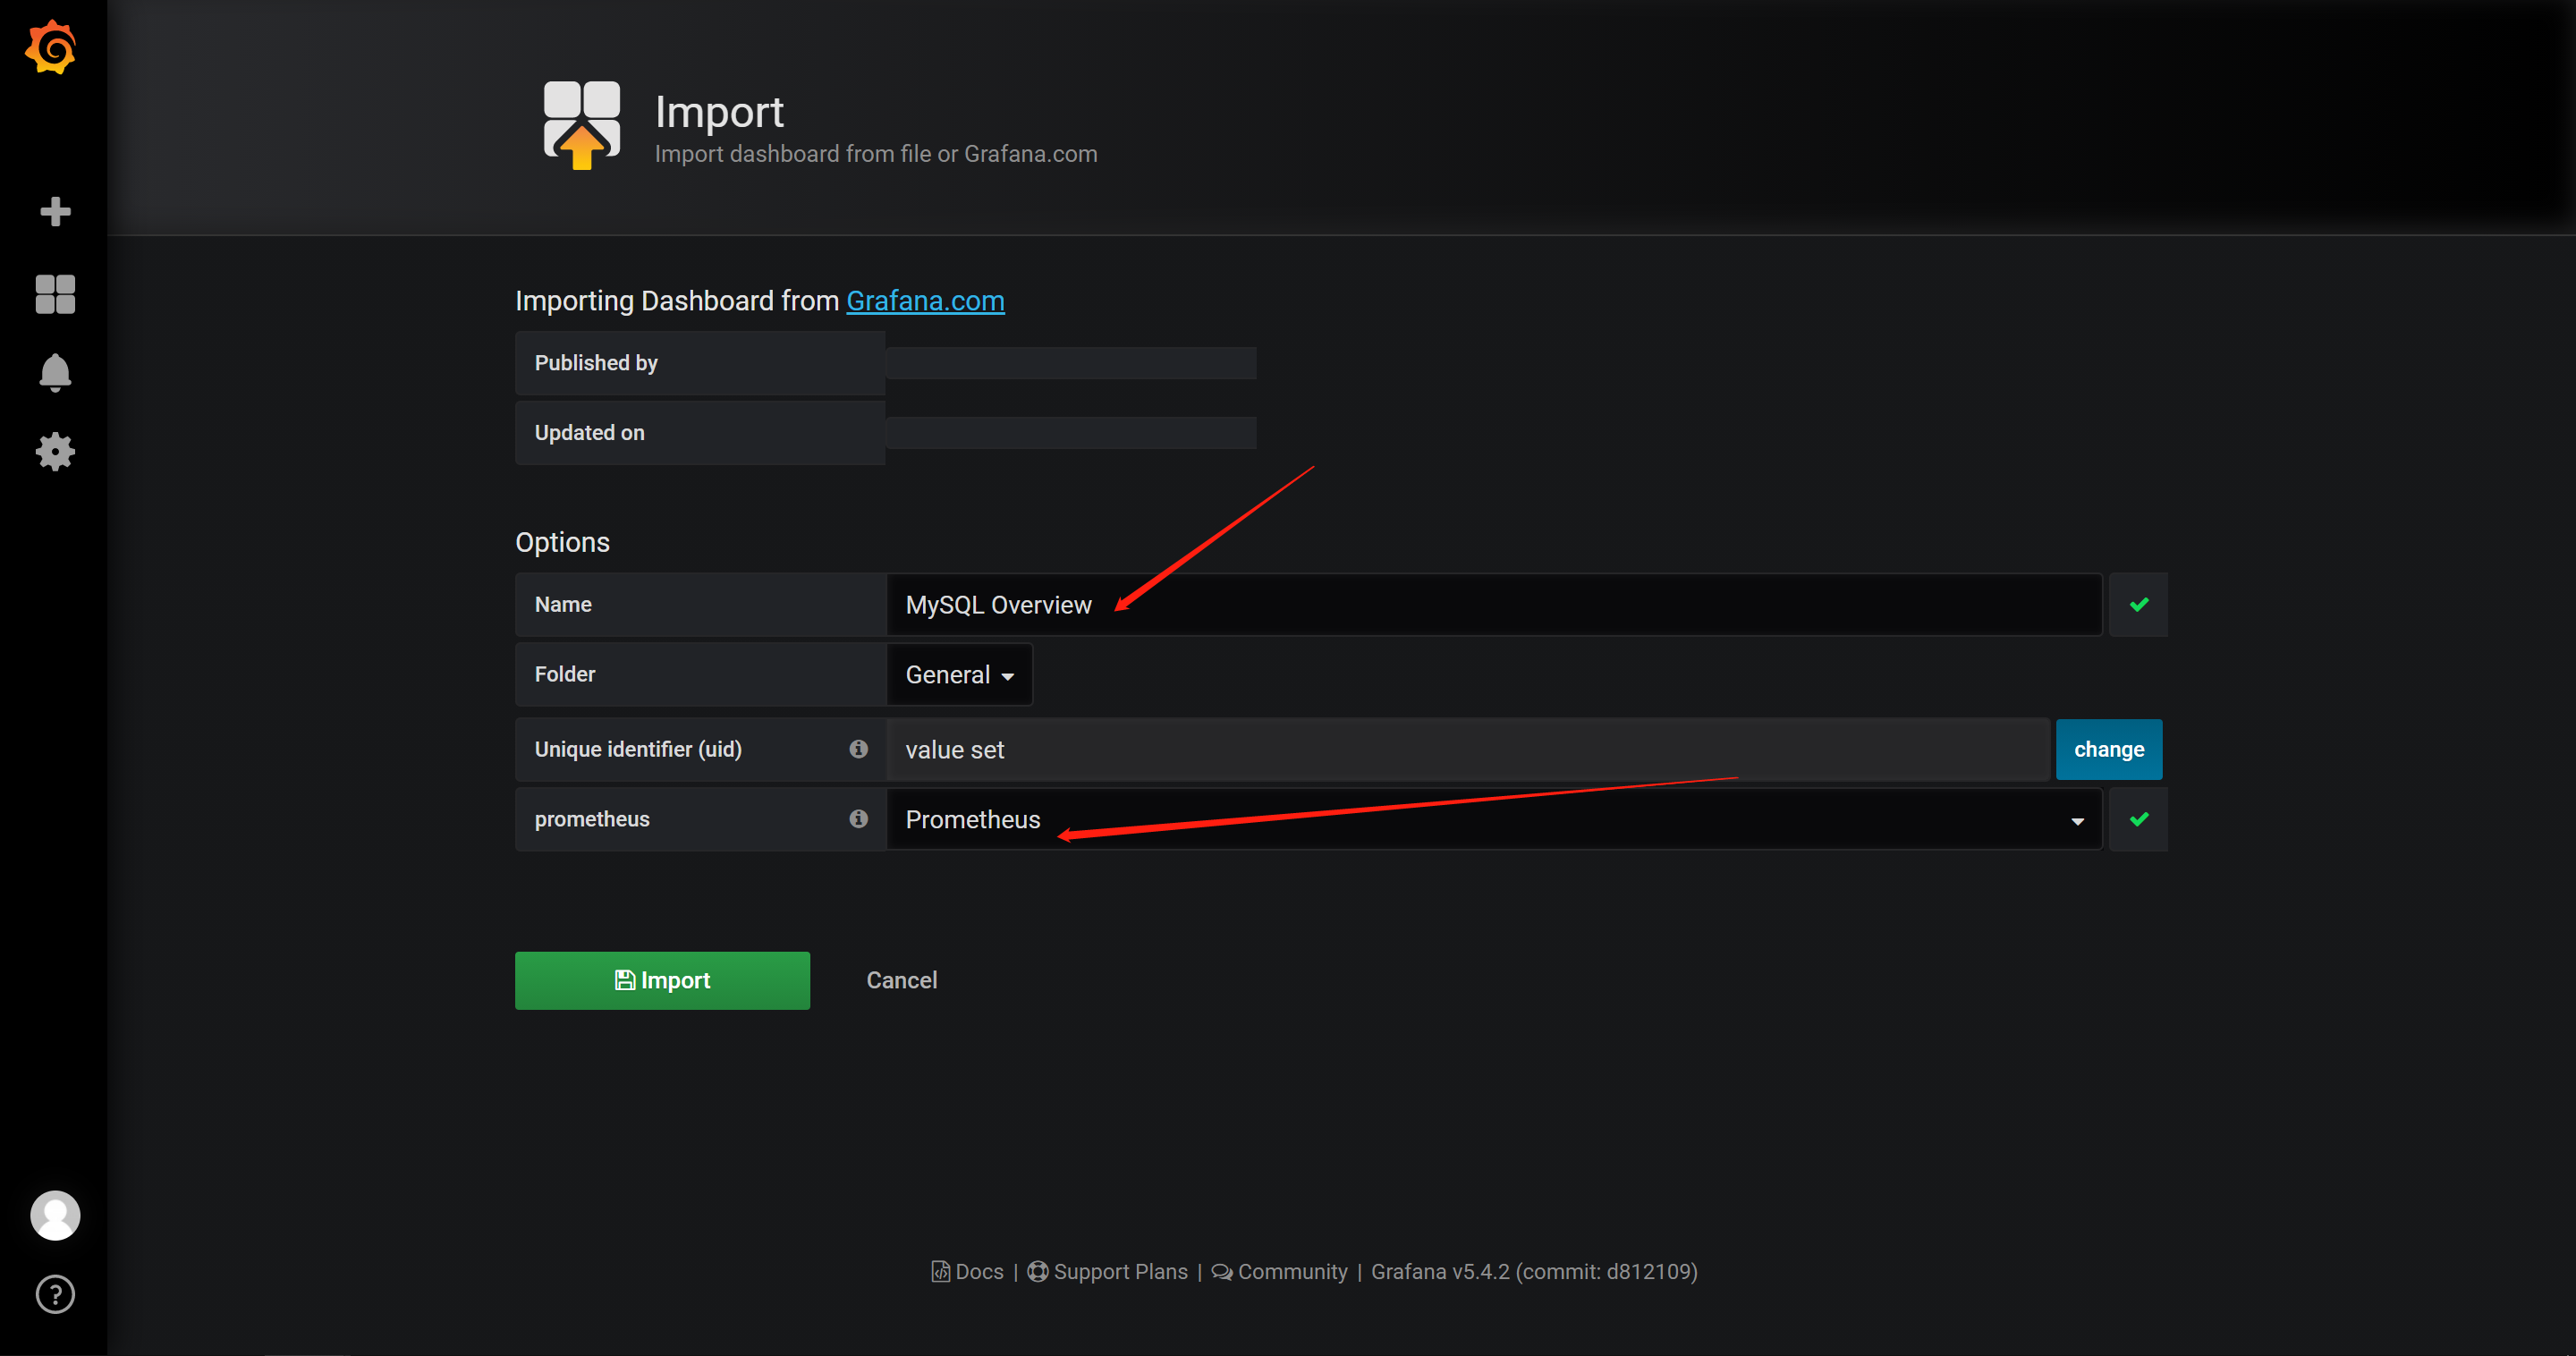
6.2在grafana图形界面导入相关json文件
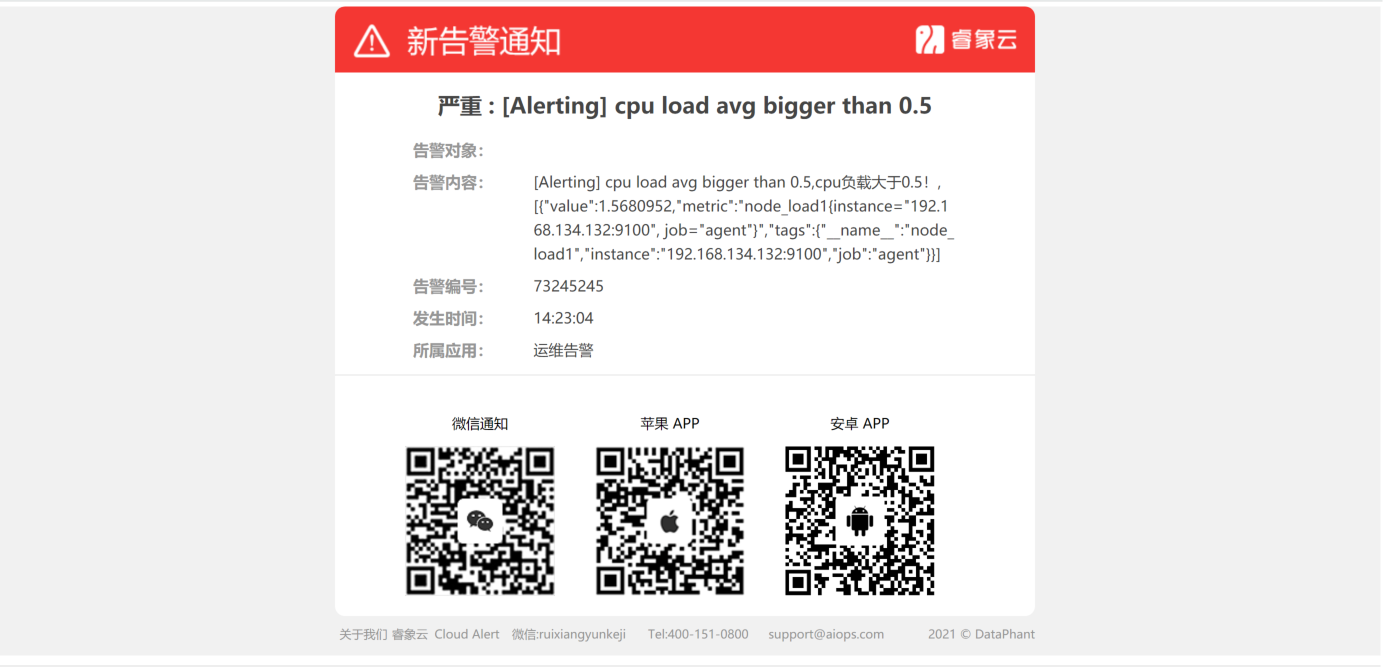
7.Promethus的Grafana+onealert实现报警功能
7.1先在onealert里添加grafana应用(申请onealert账号)
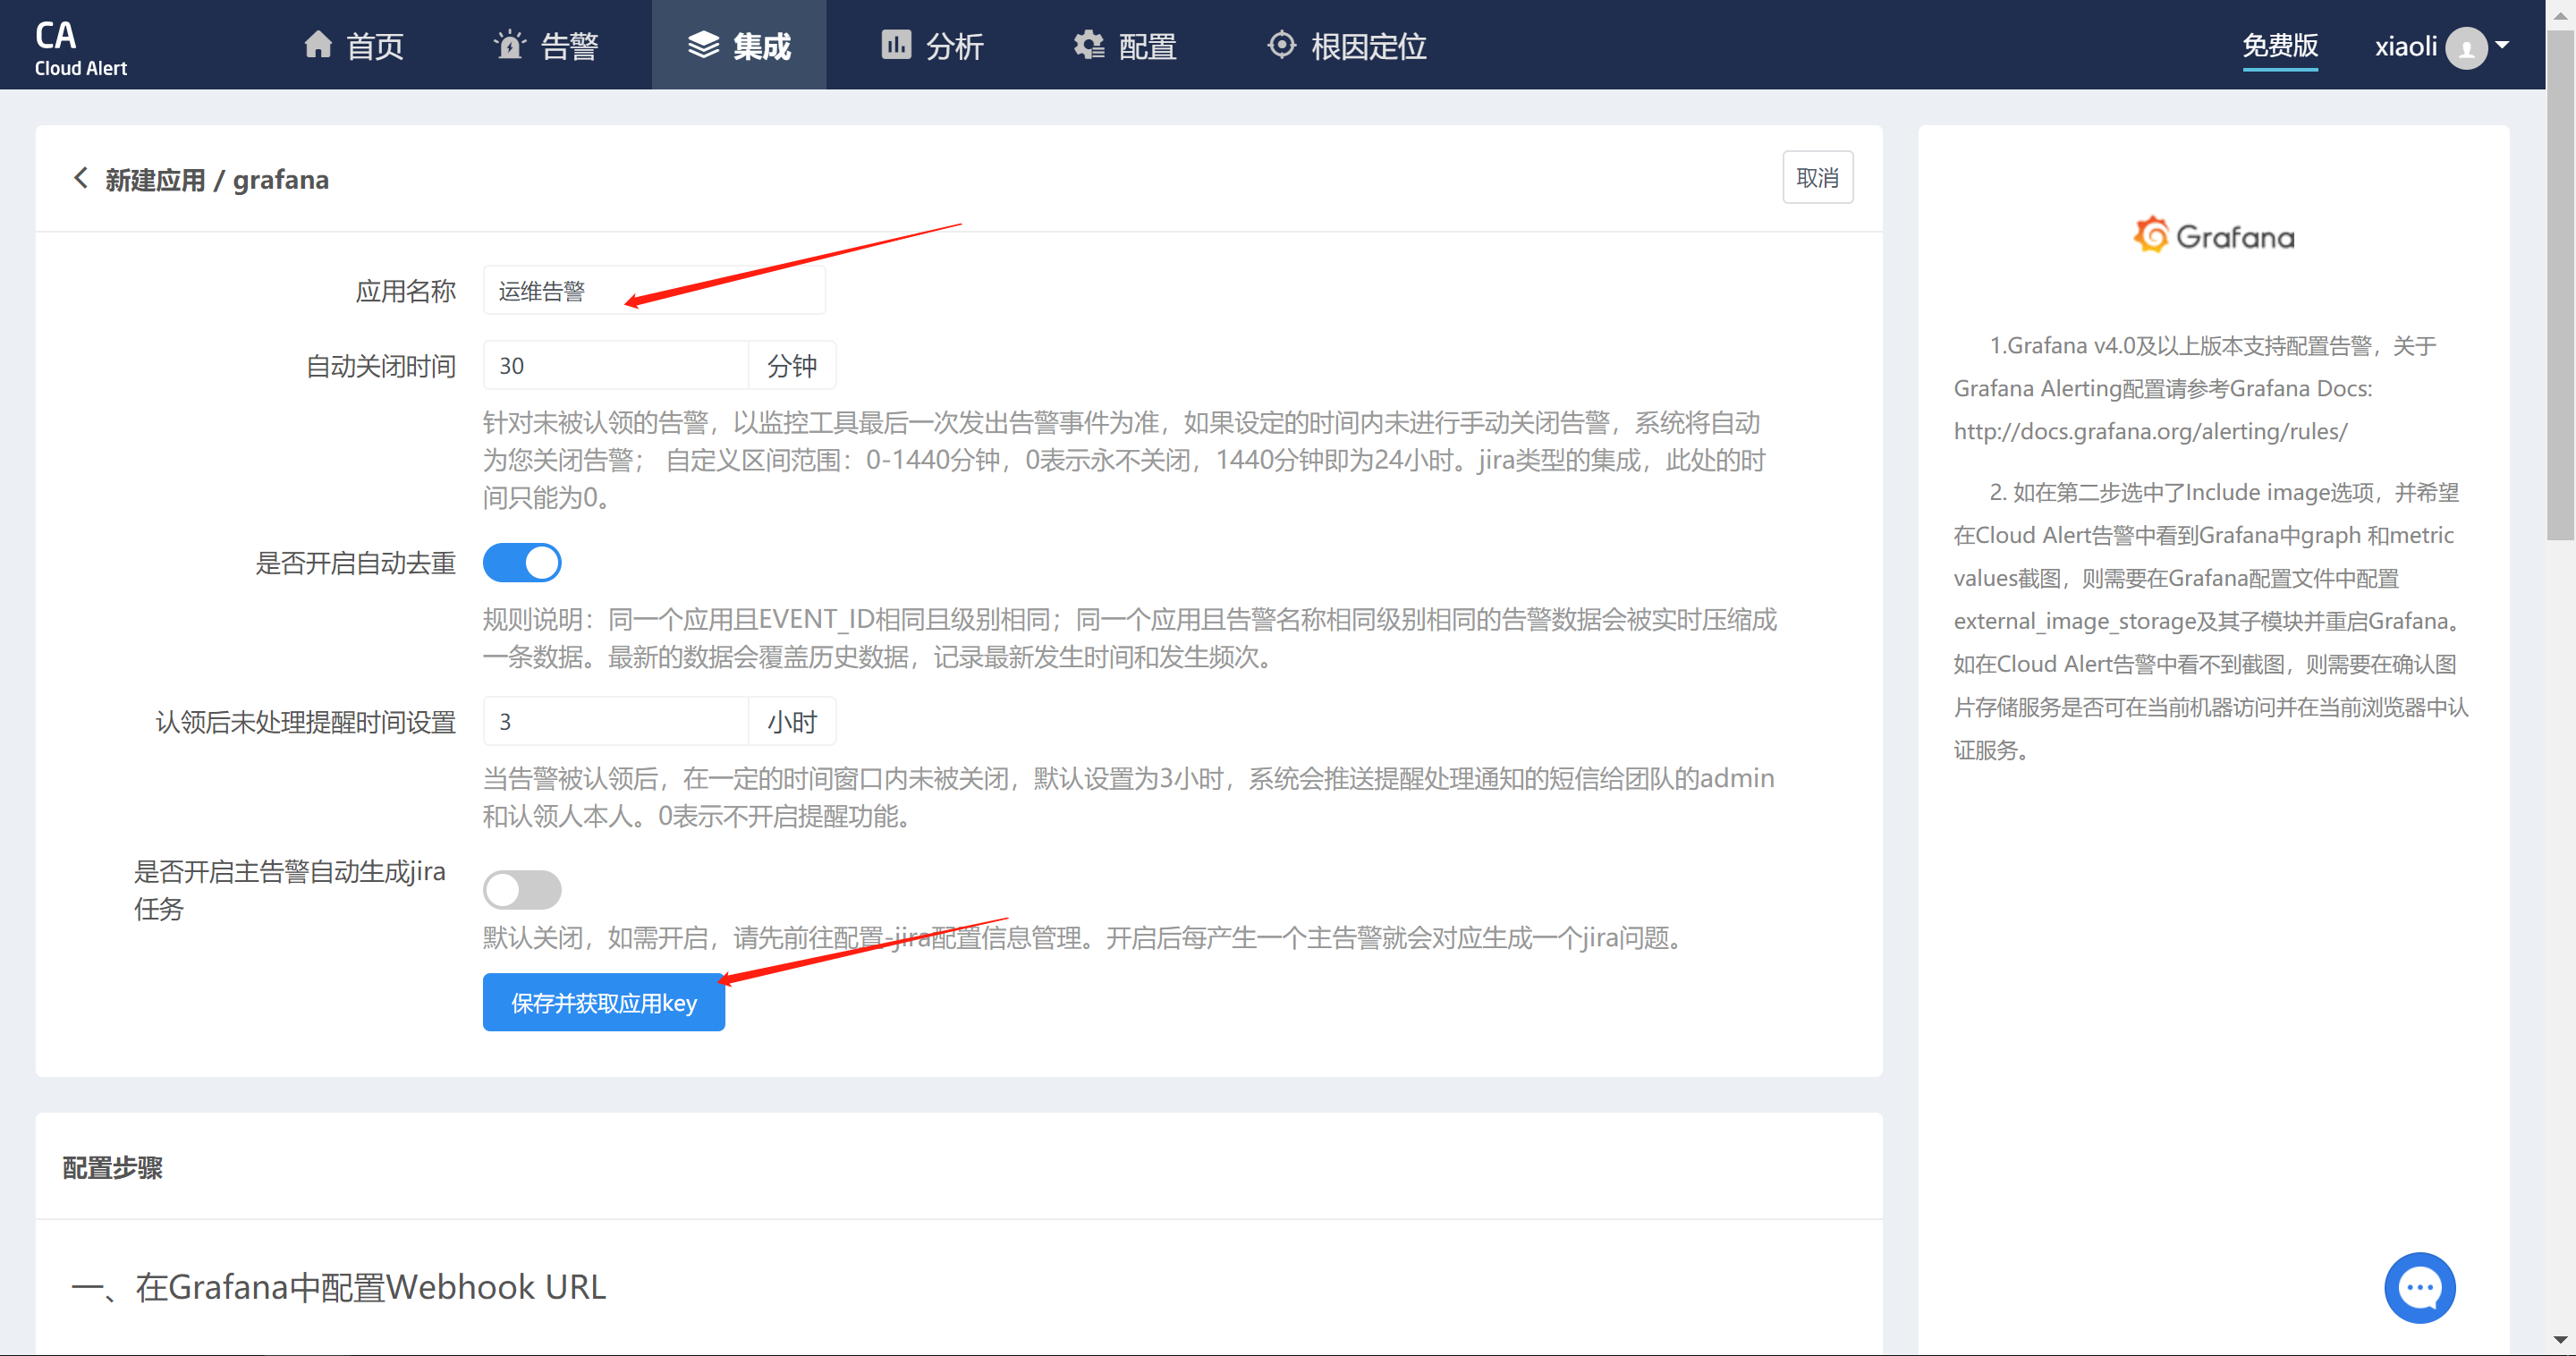
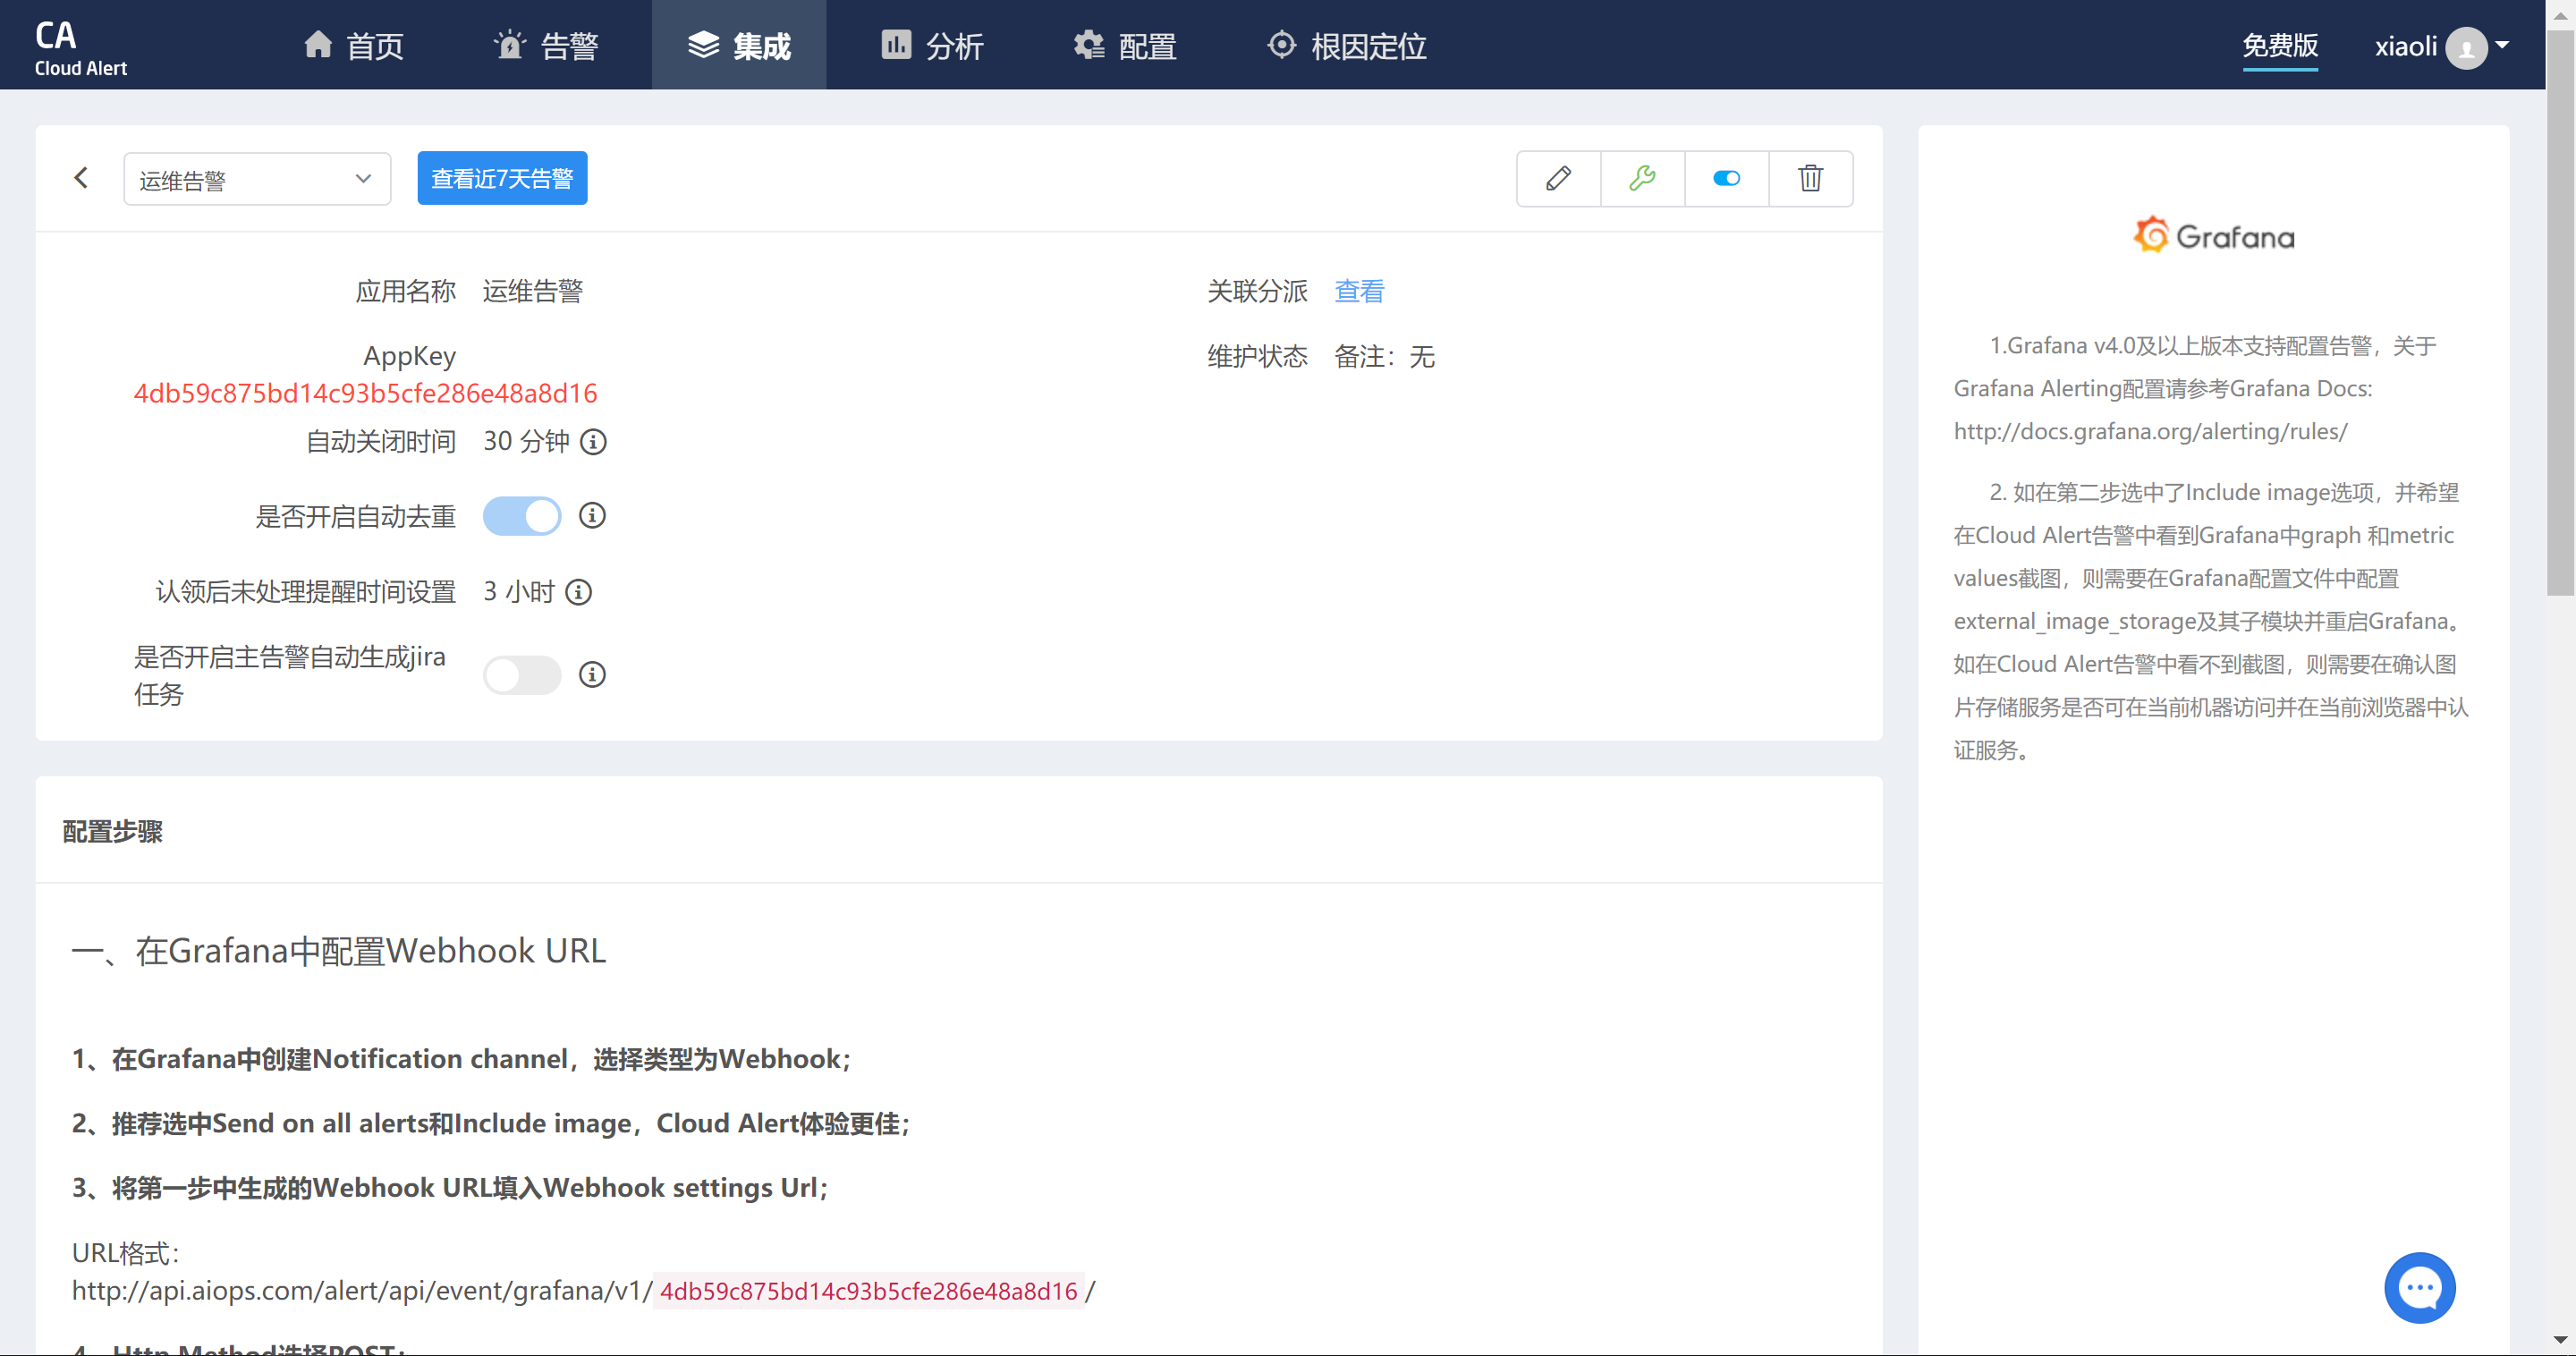
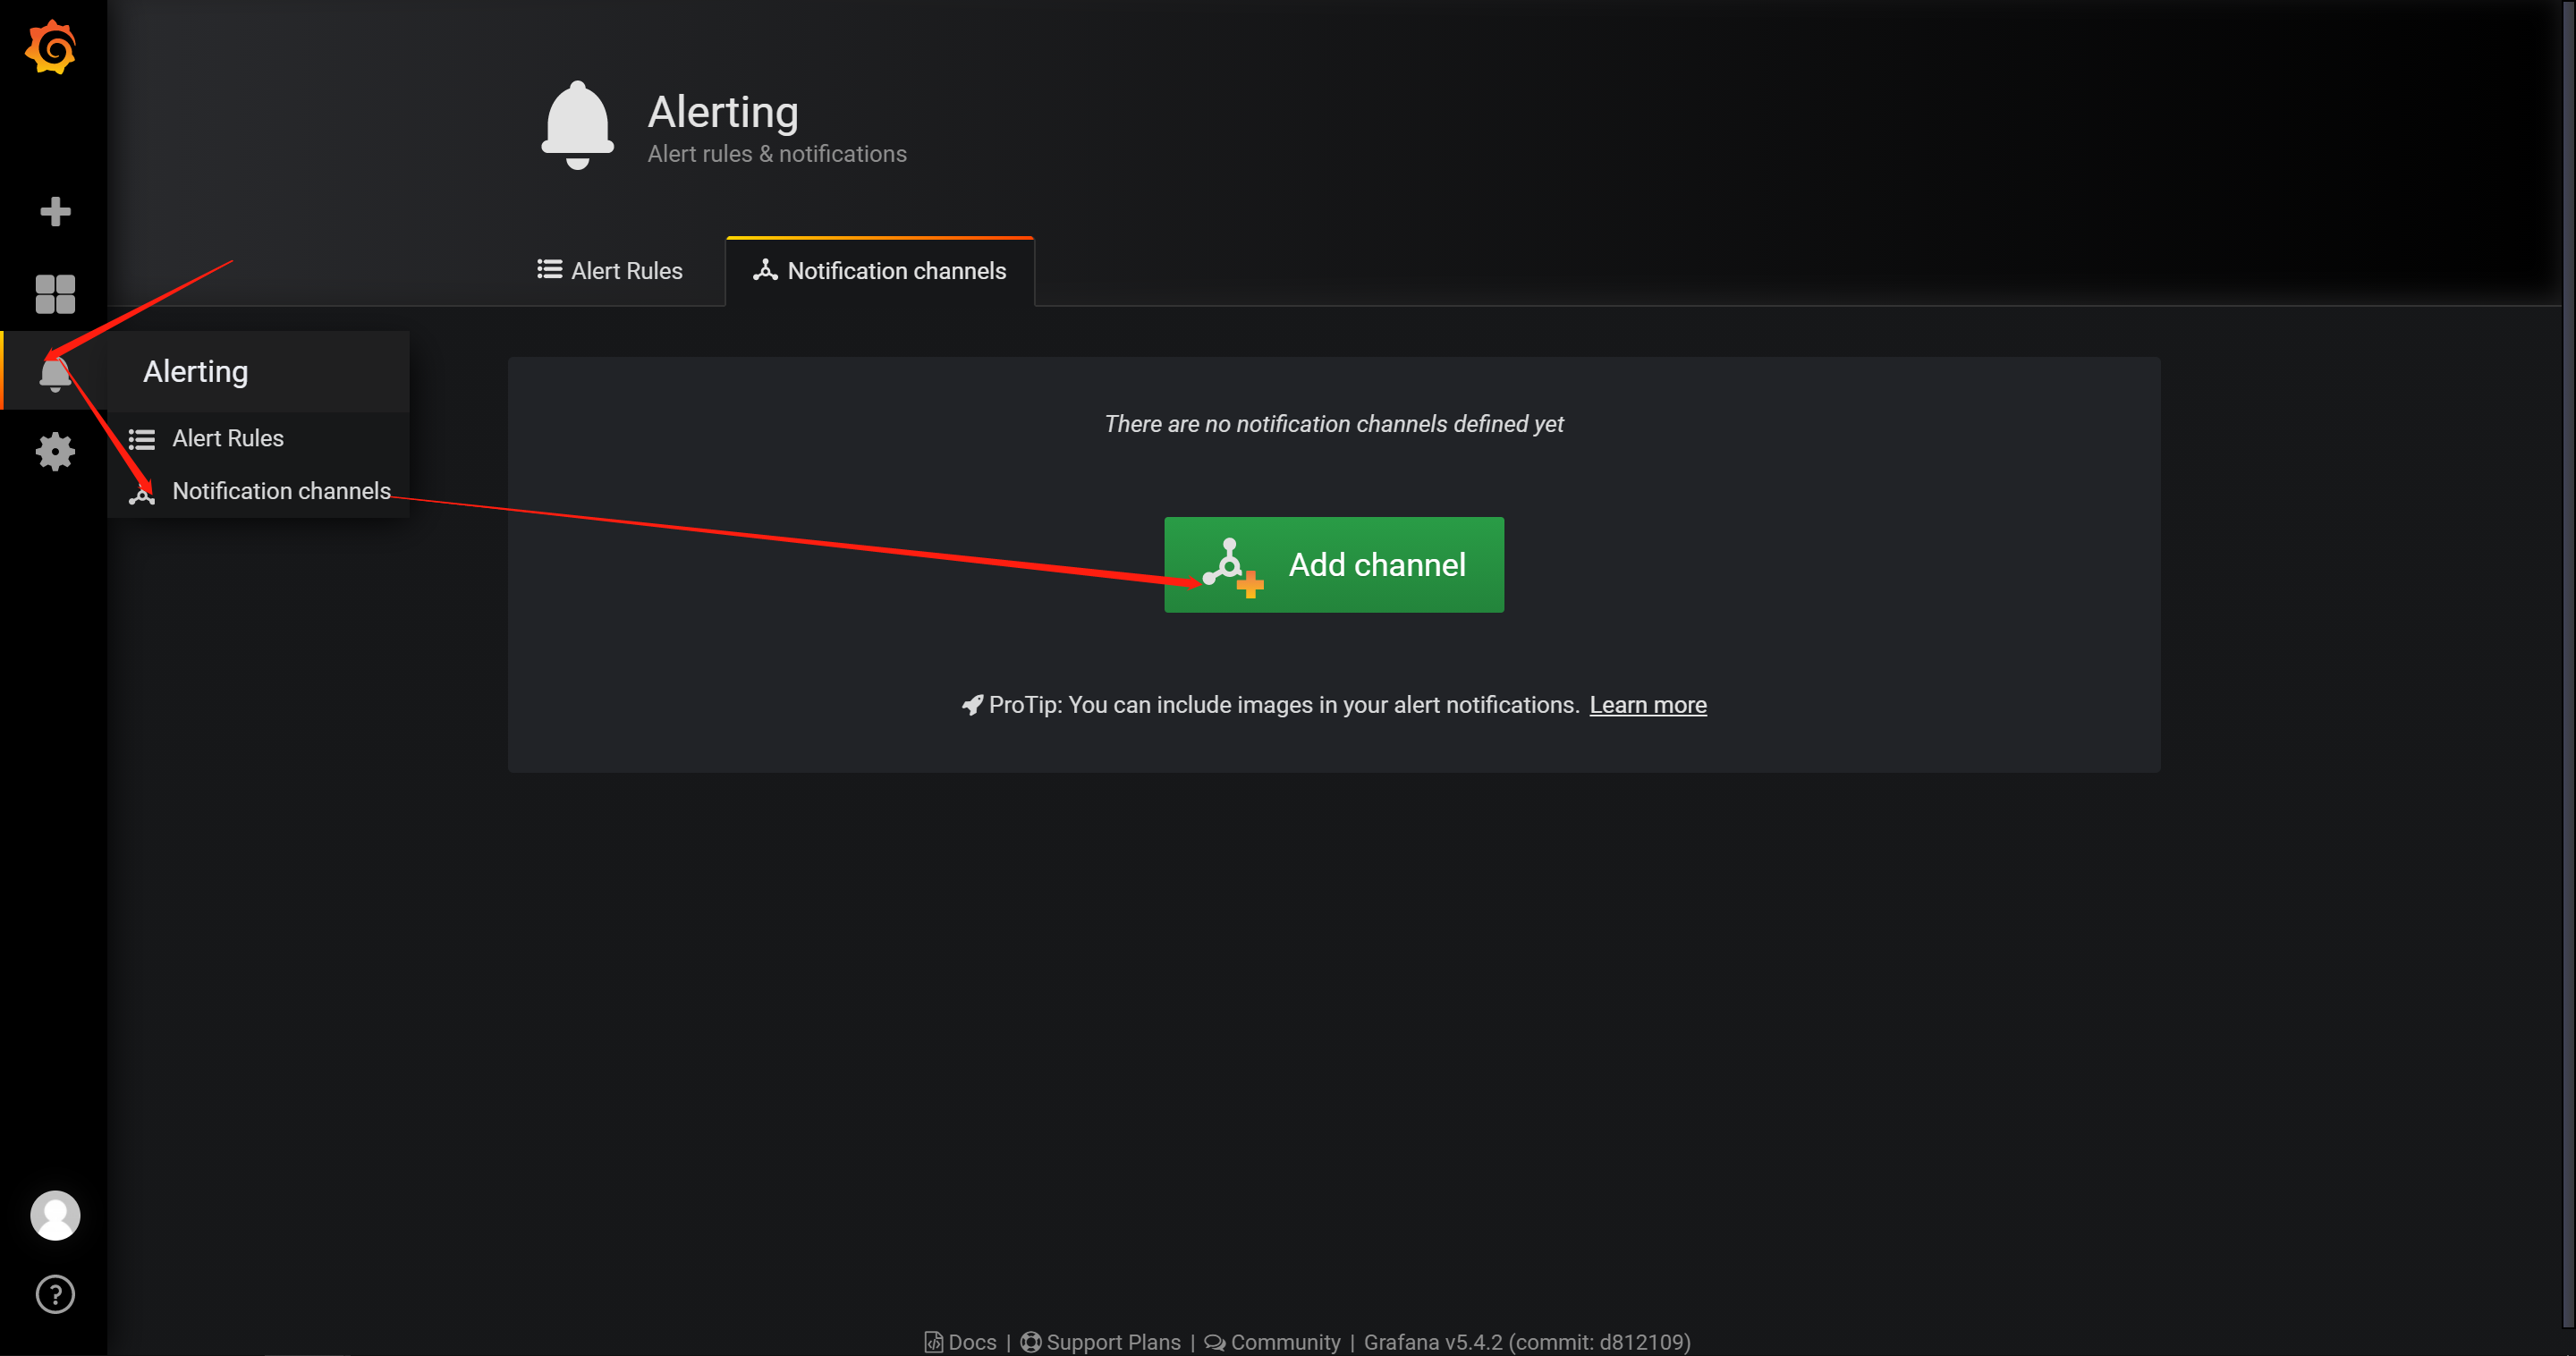
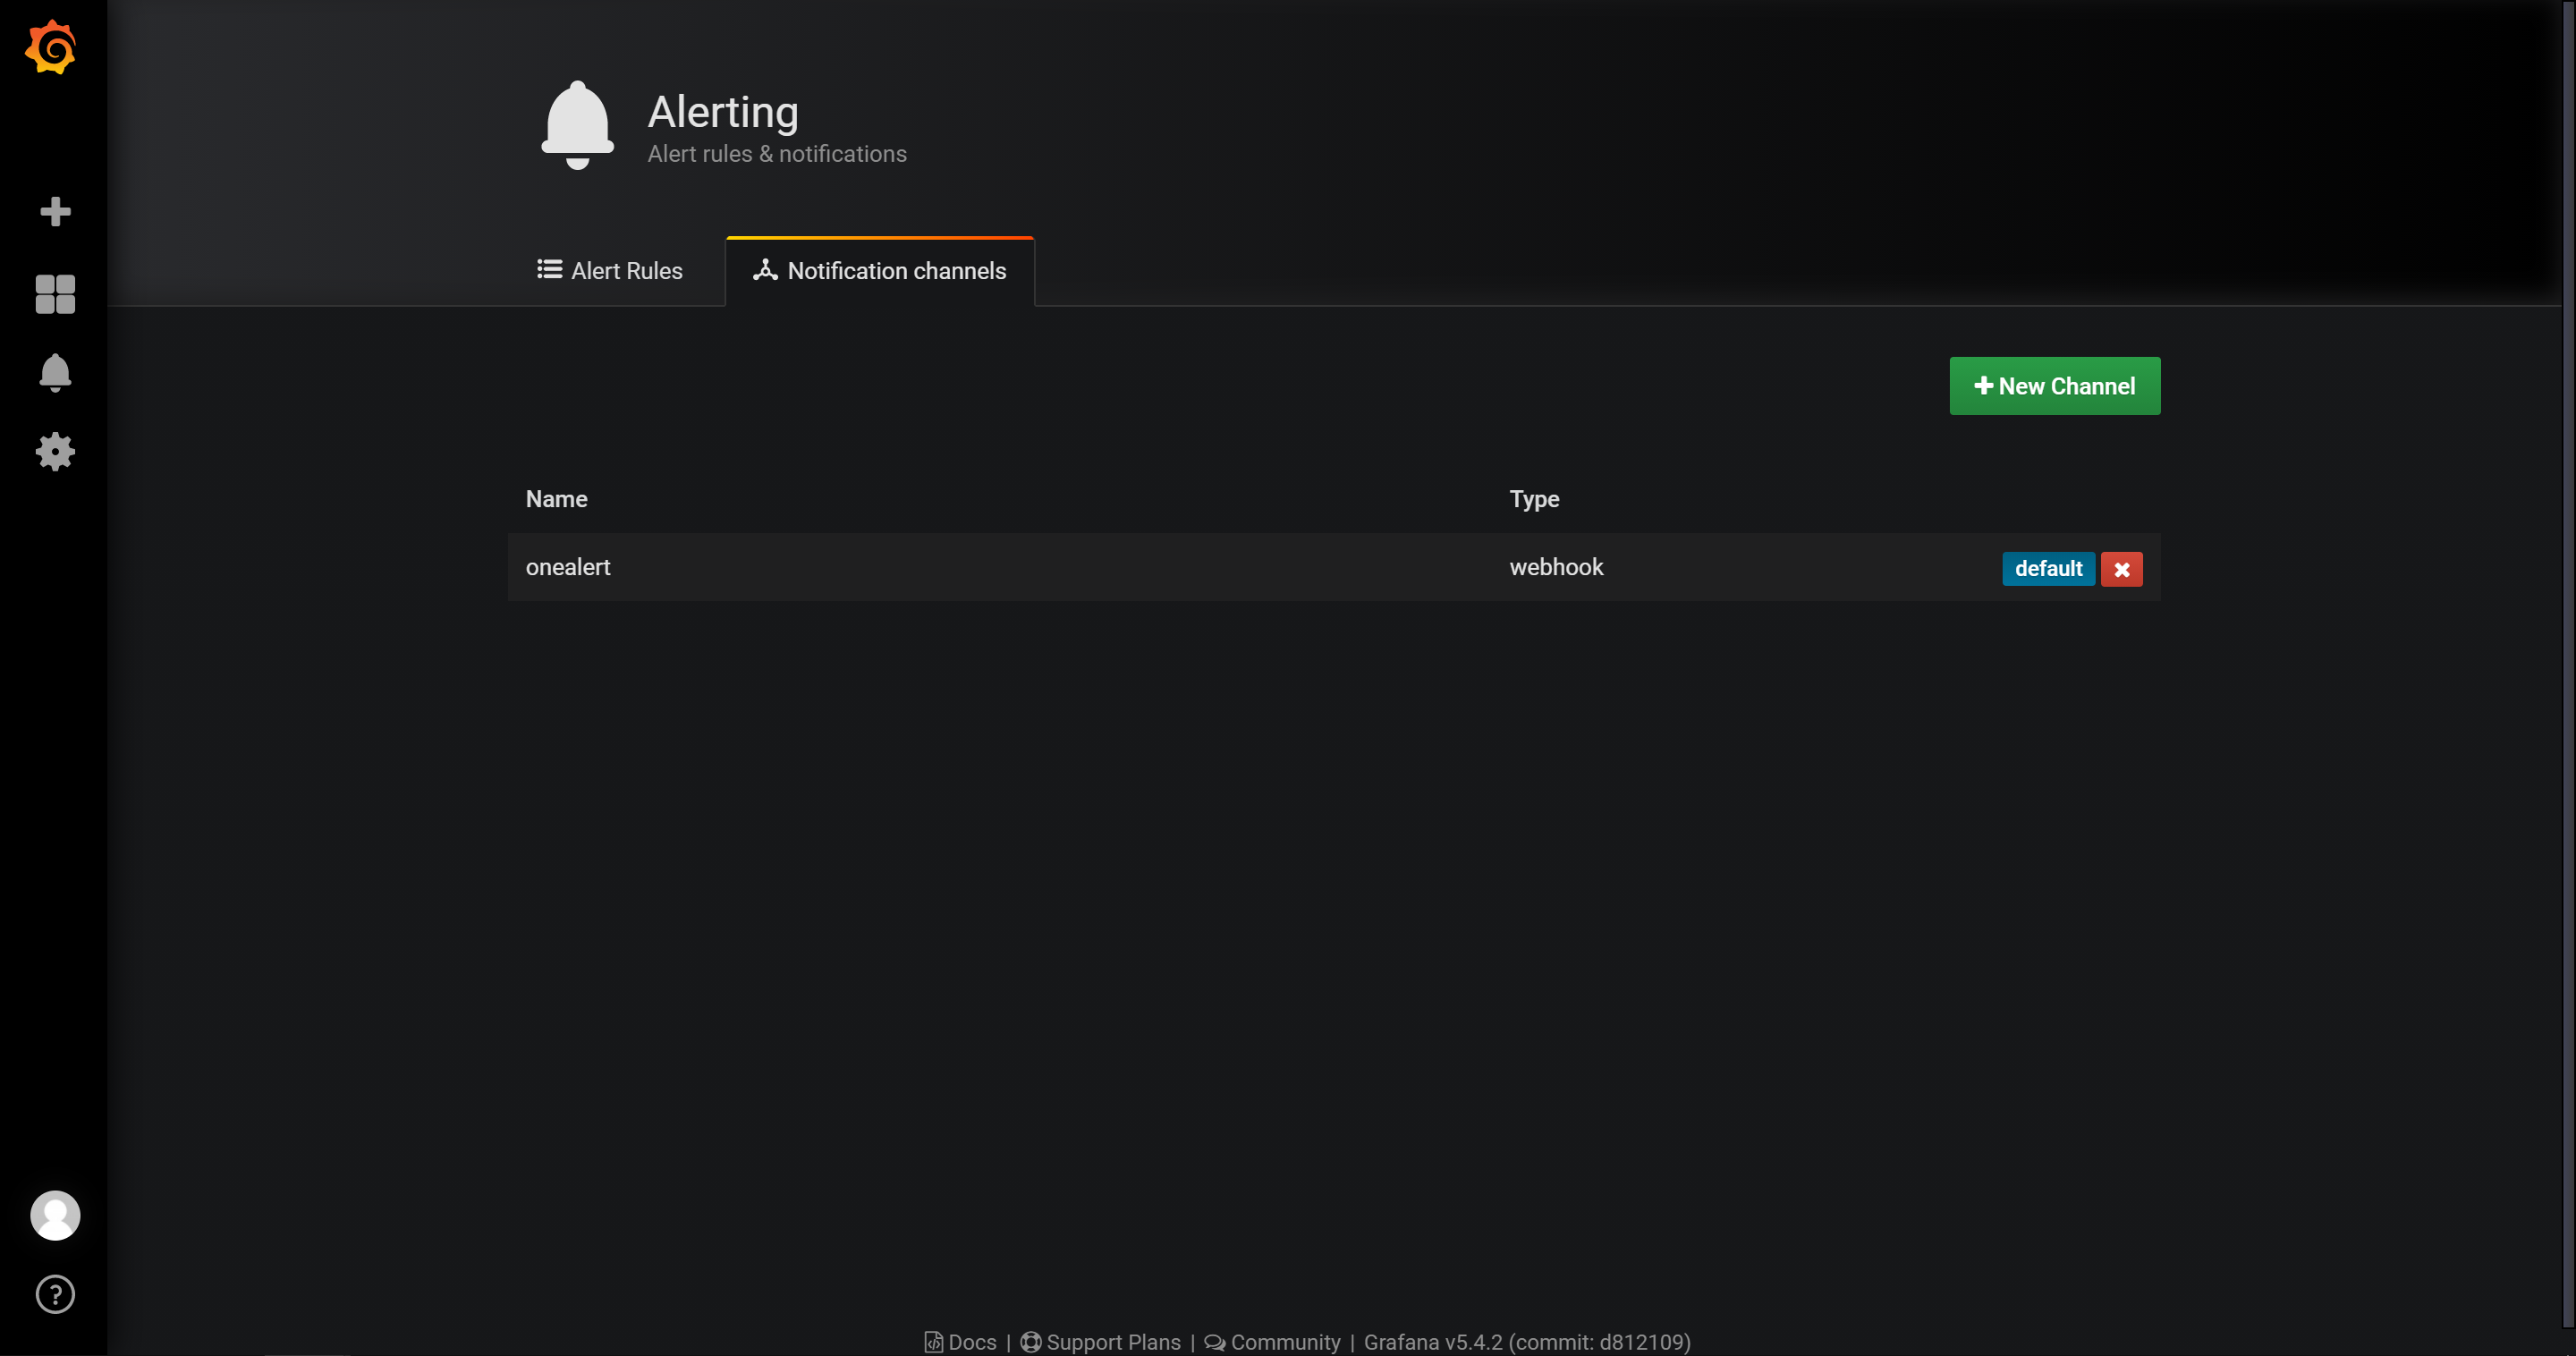
7.2在Grafana中配置Webhook URL
在Grafana中创建Notification channel,选择类型为Webhook
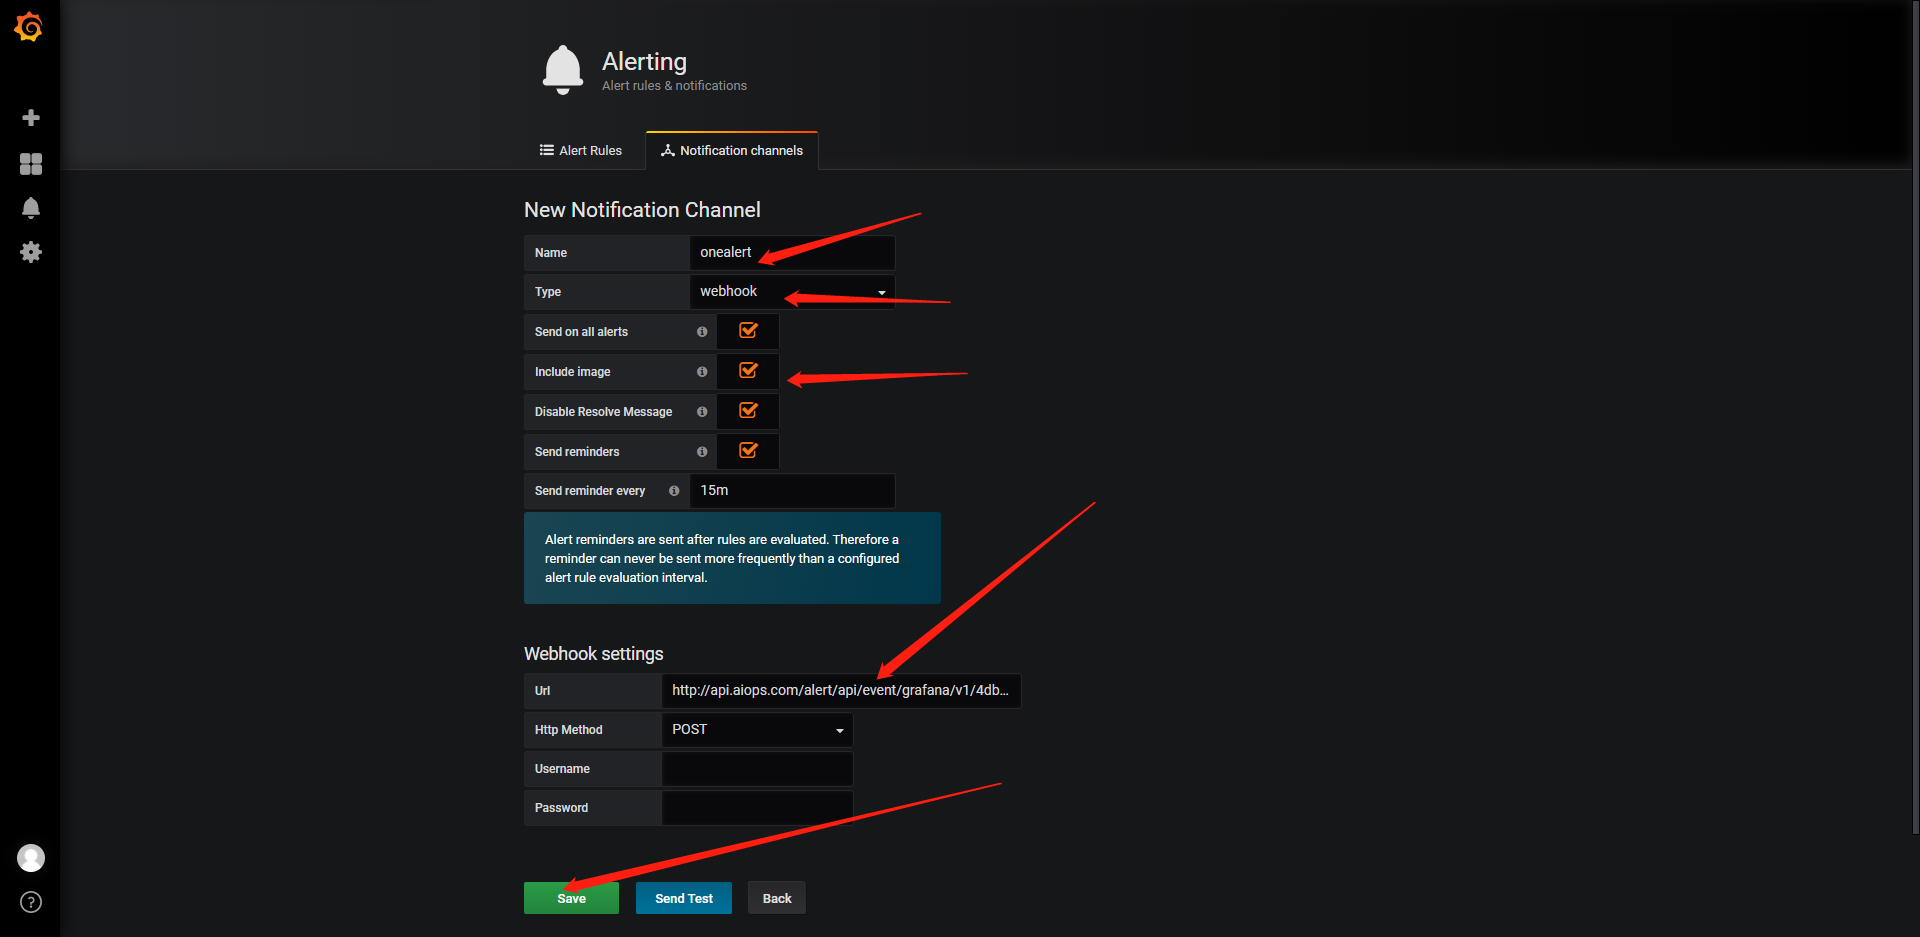
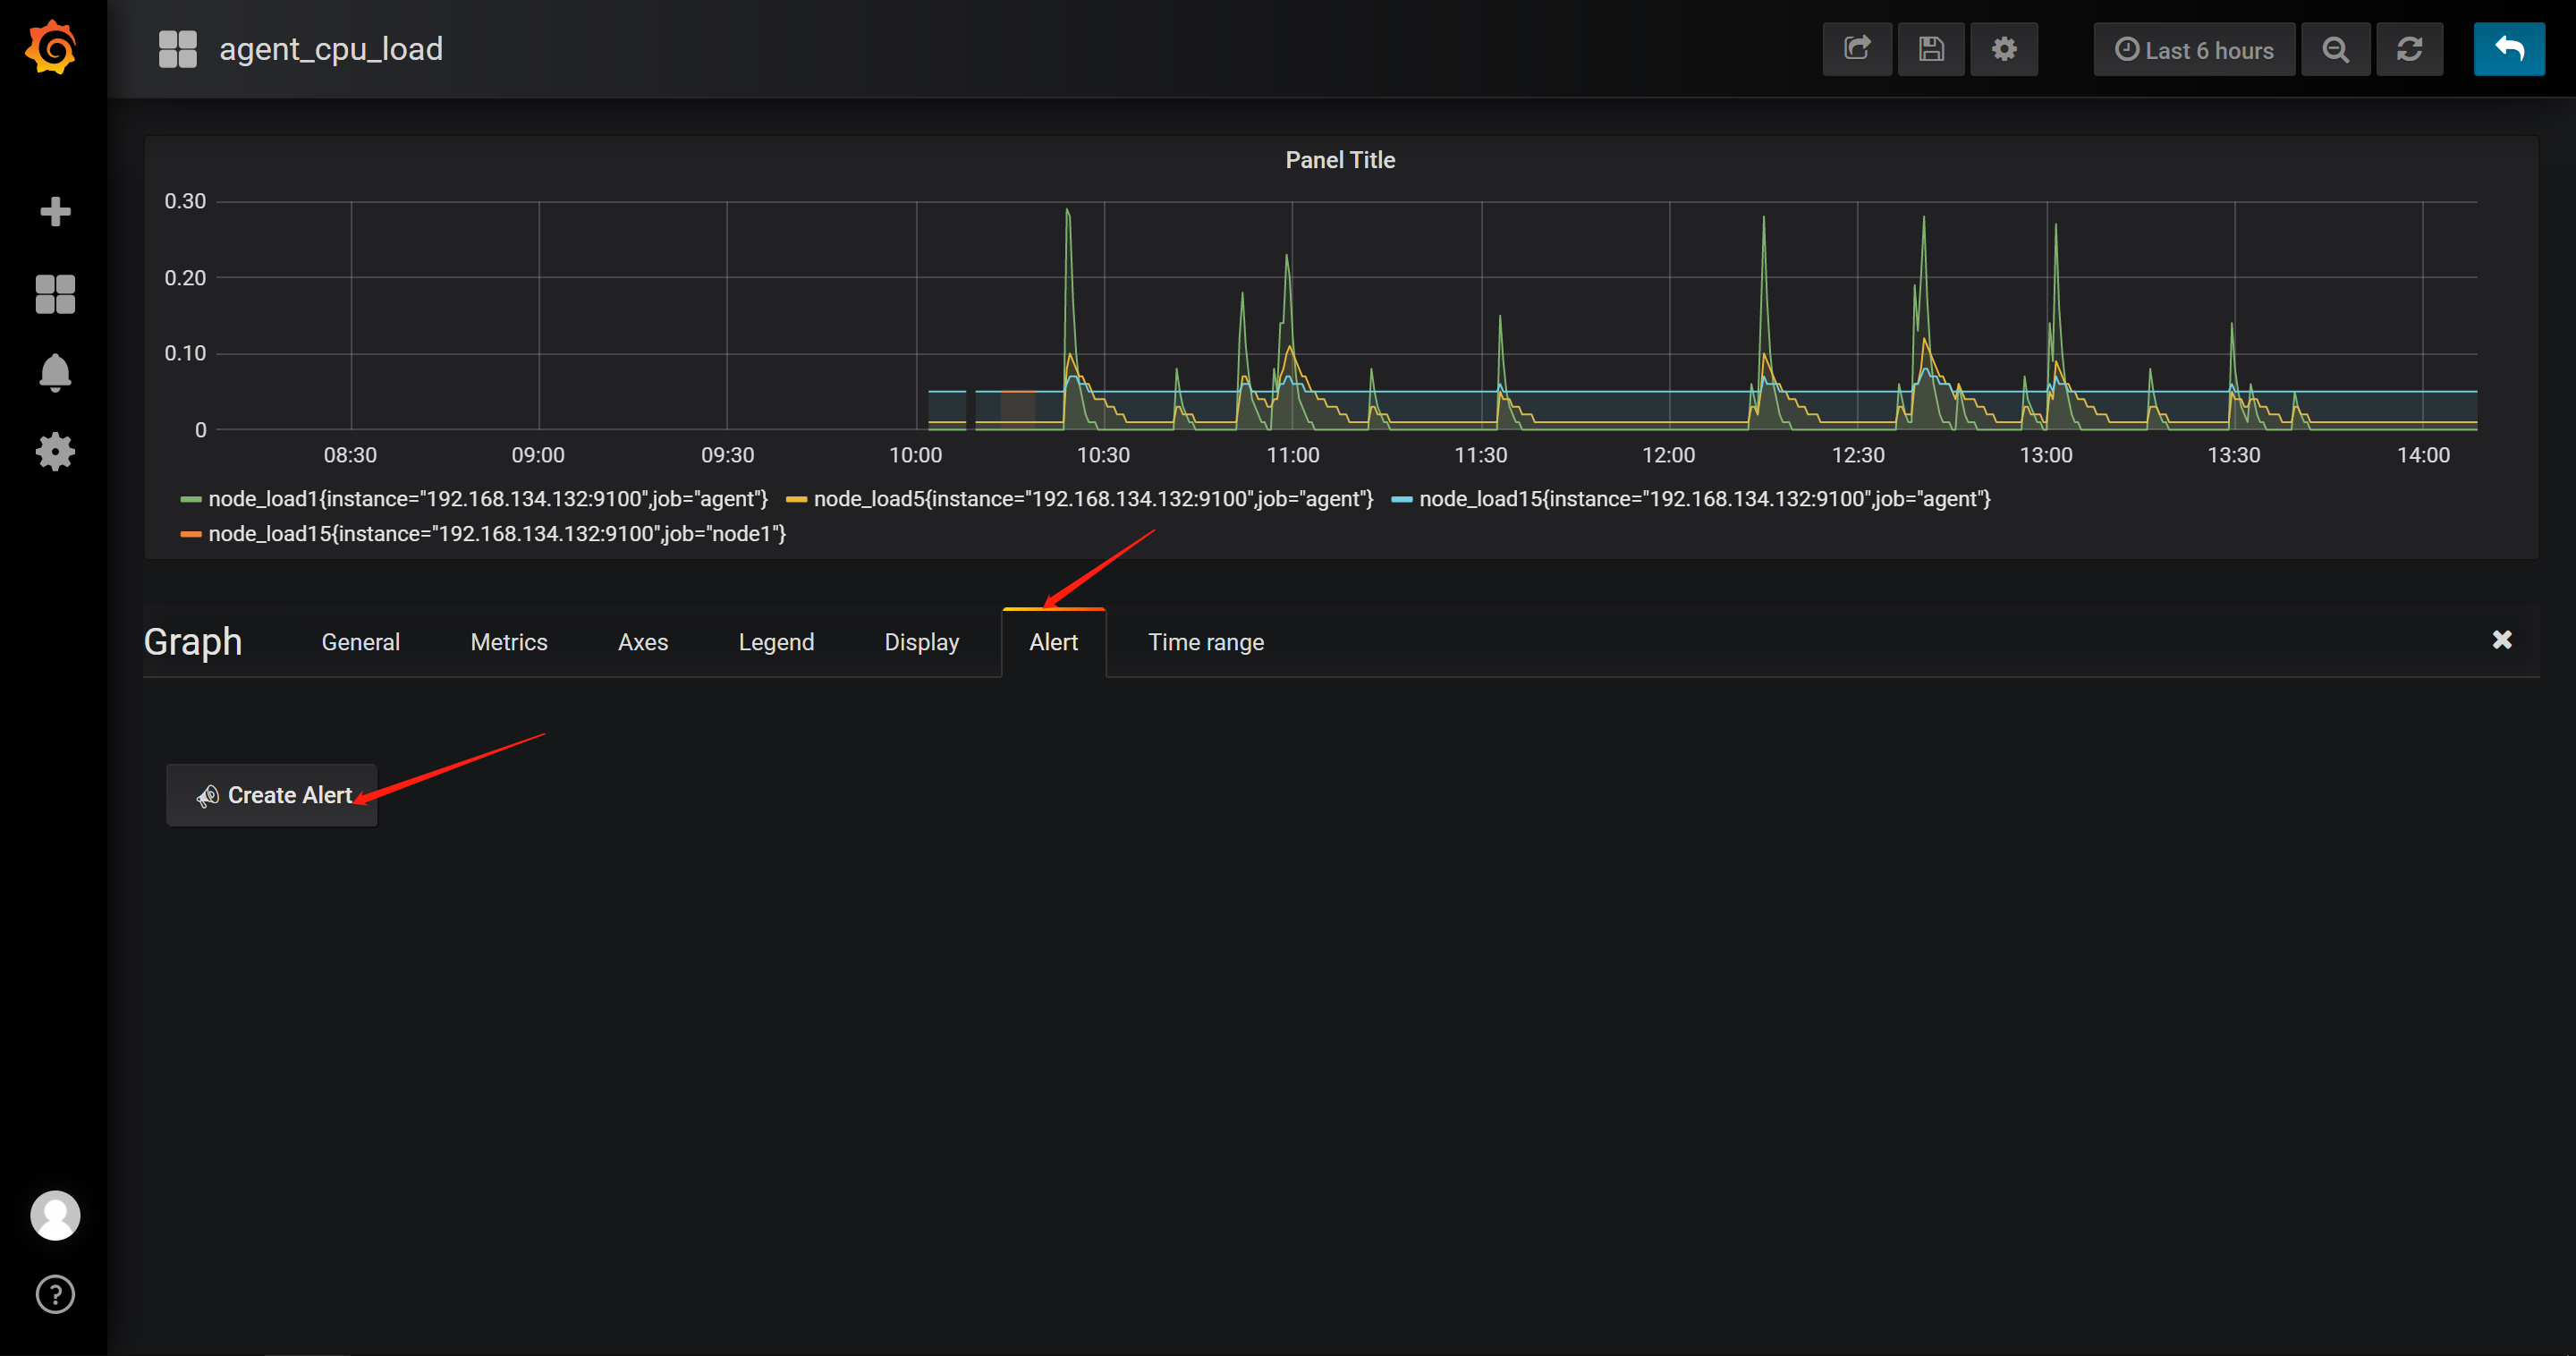
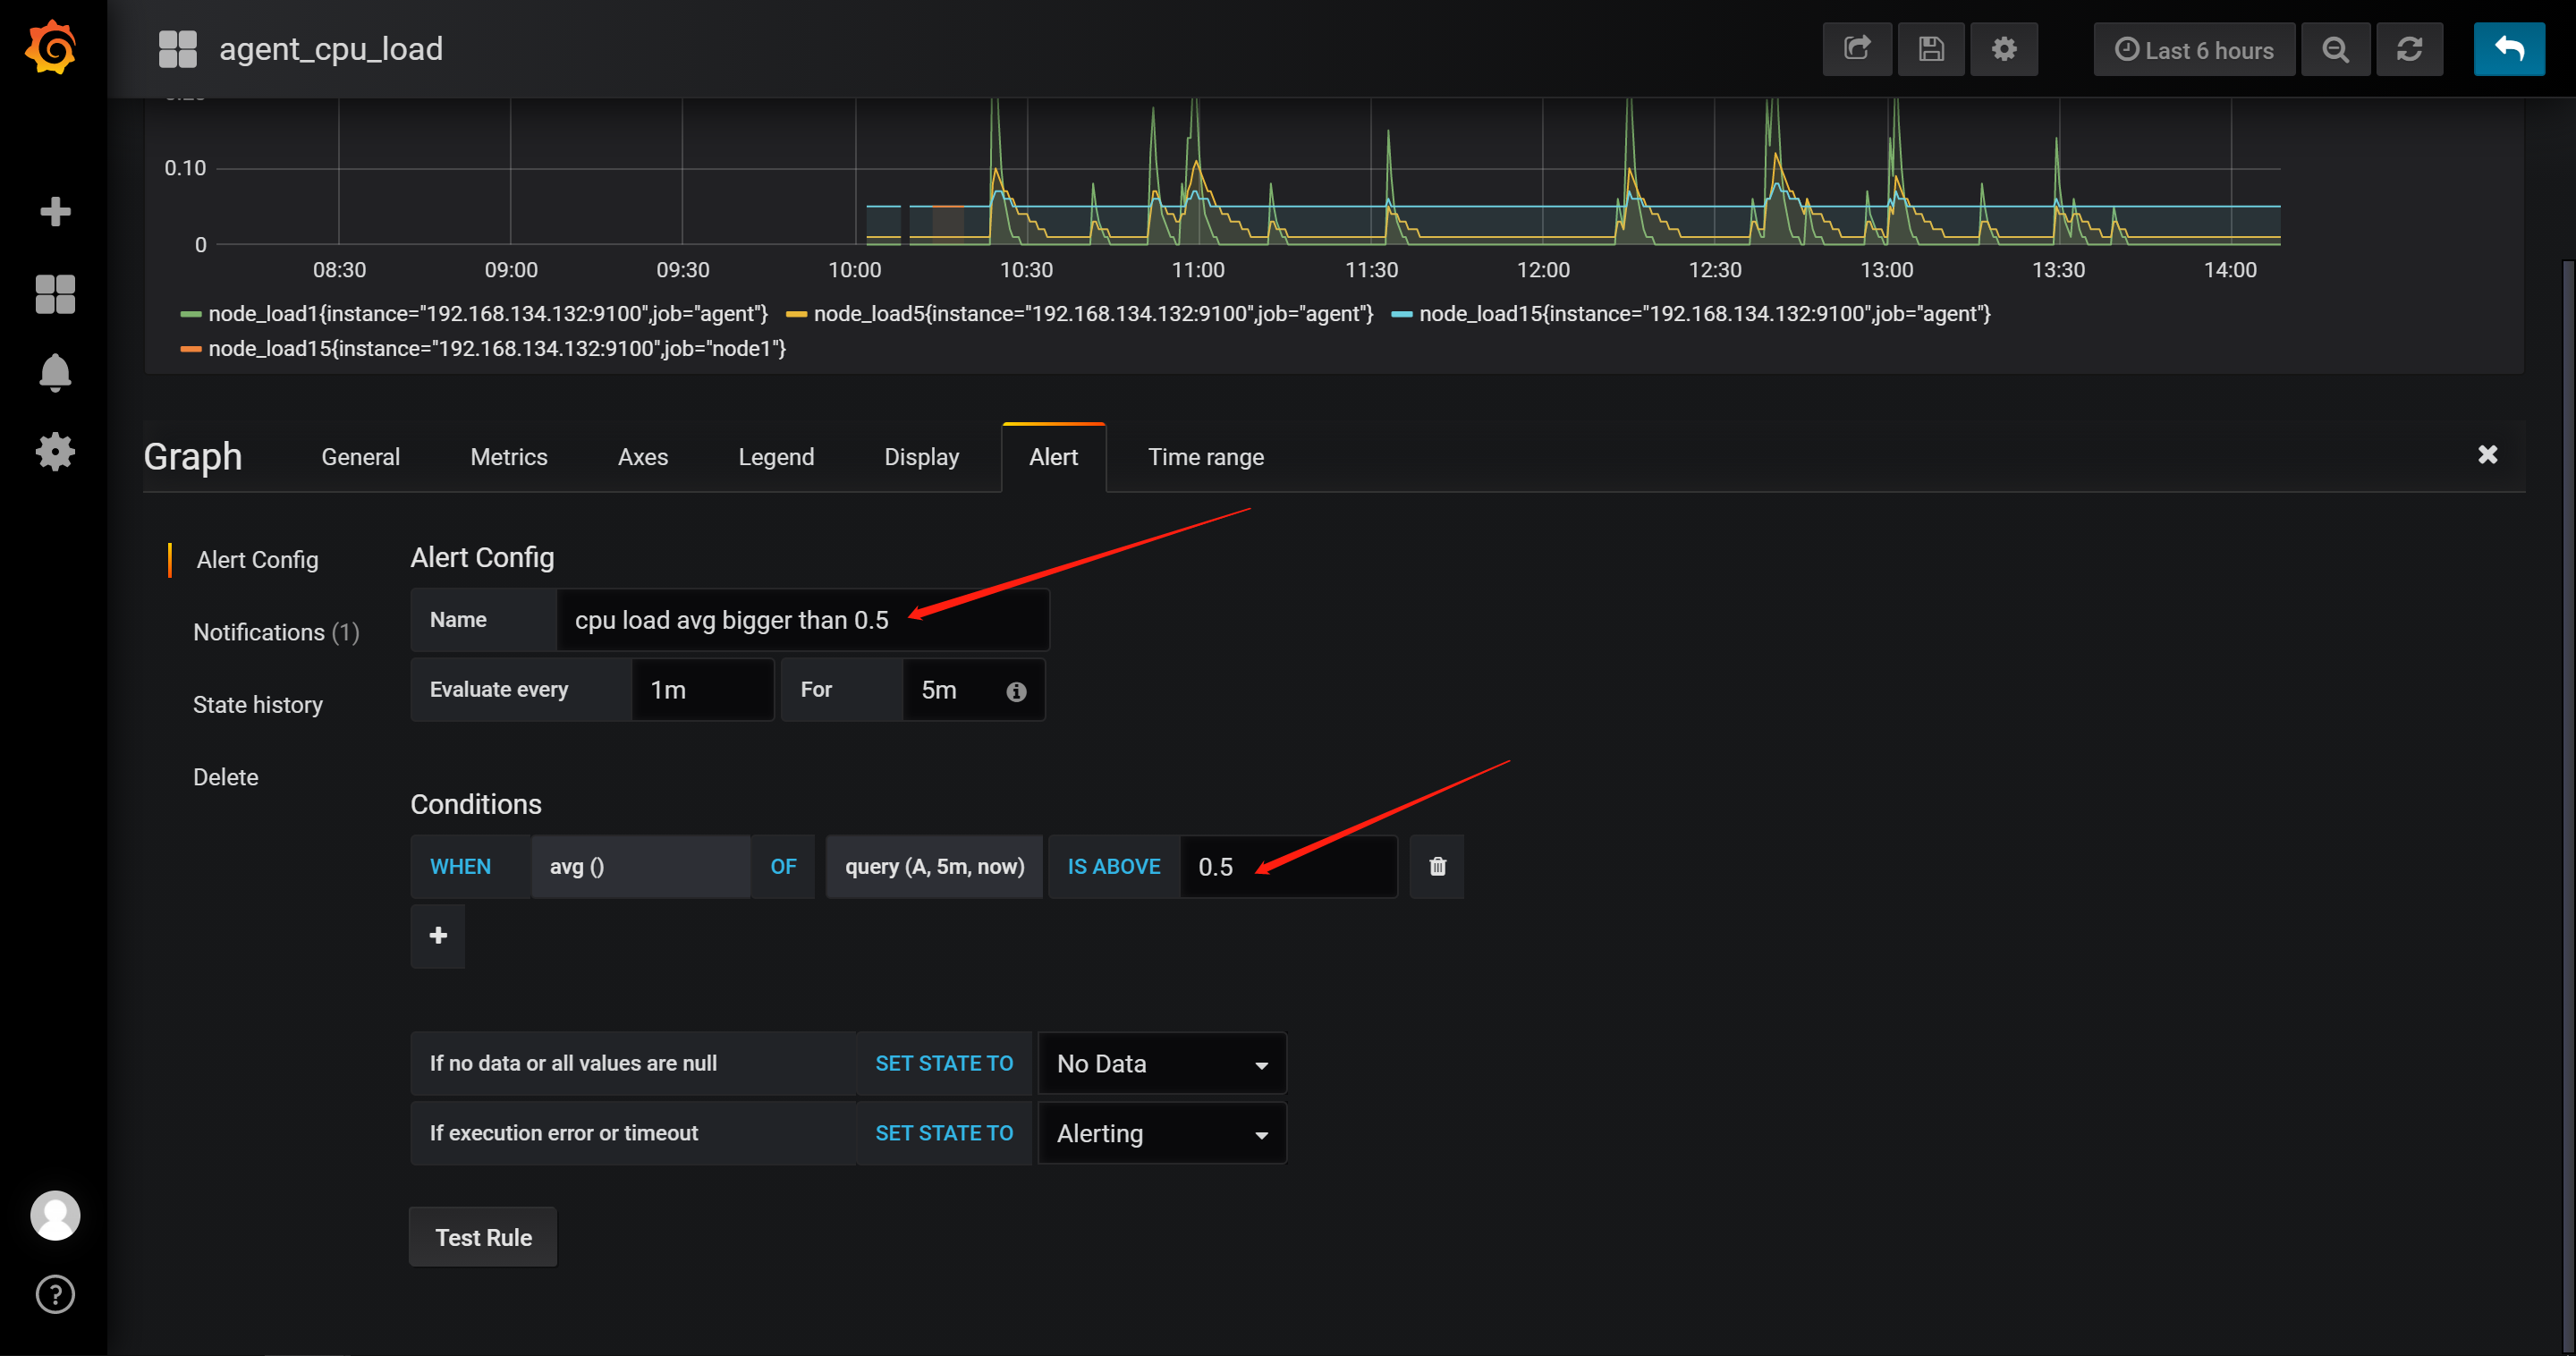
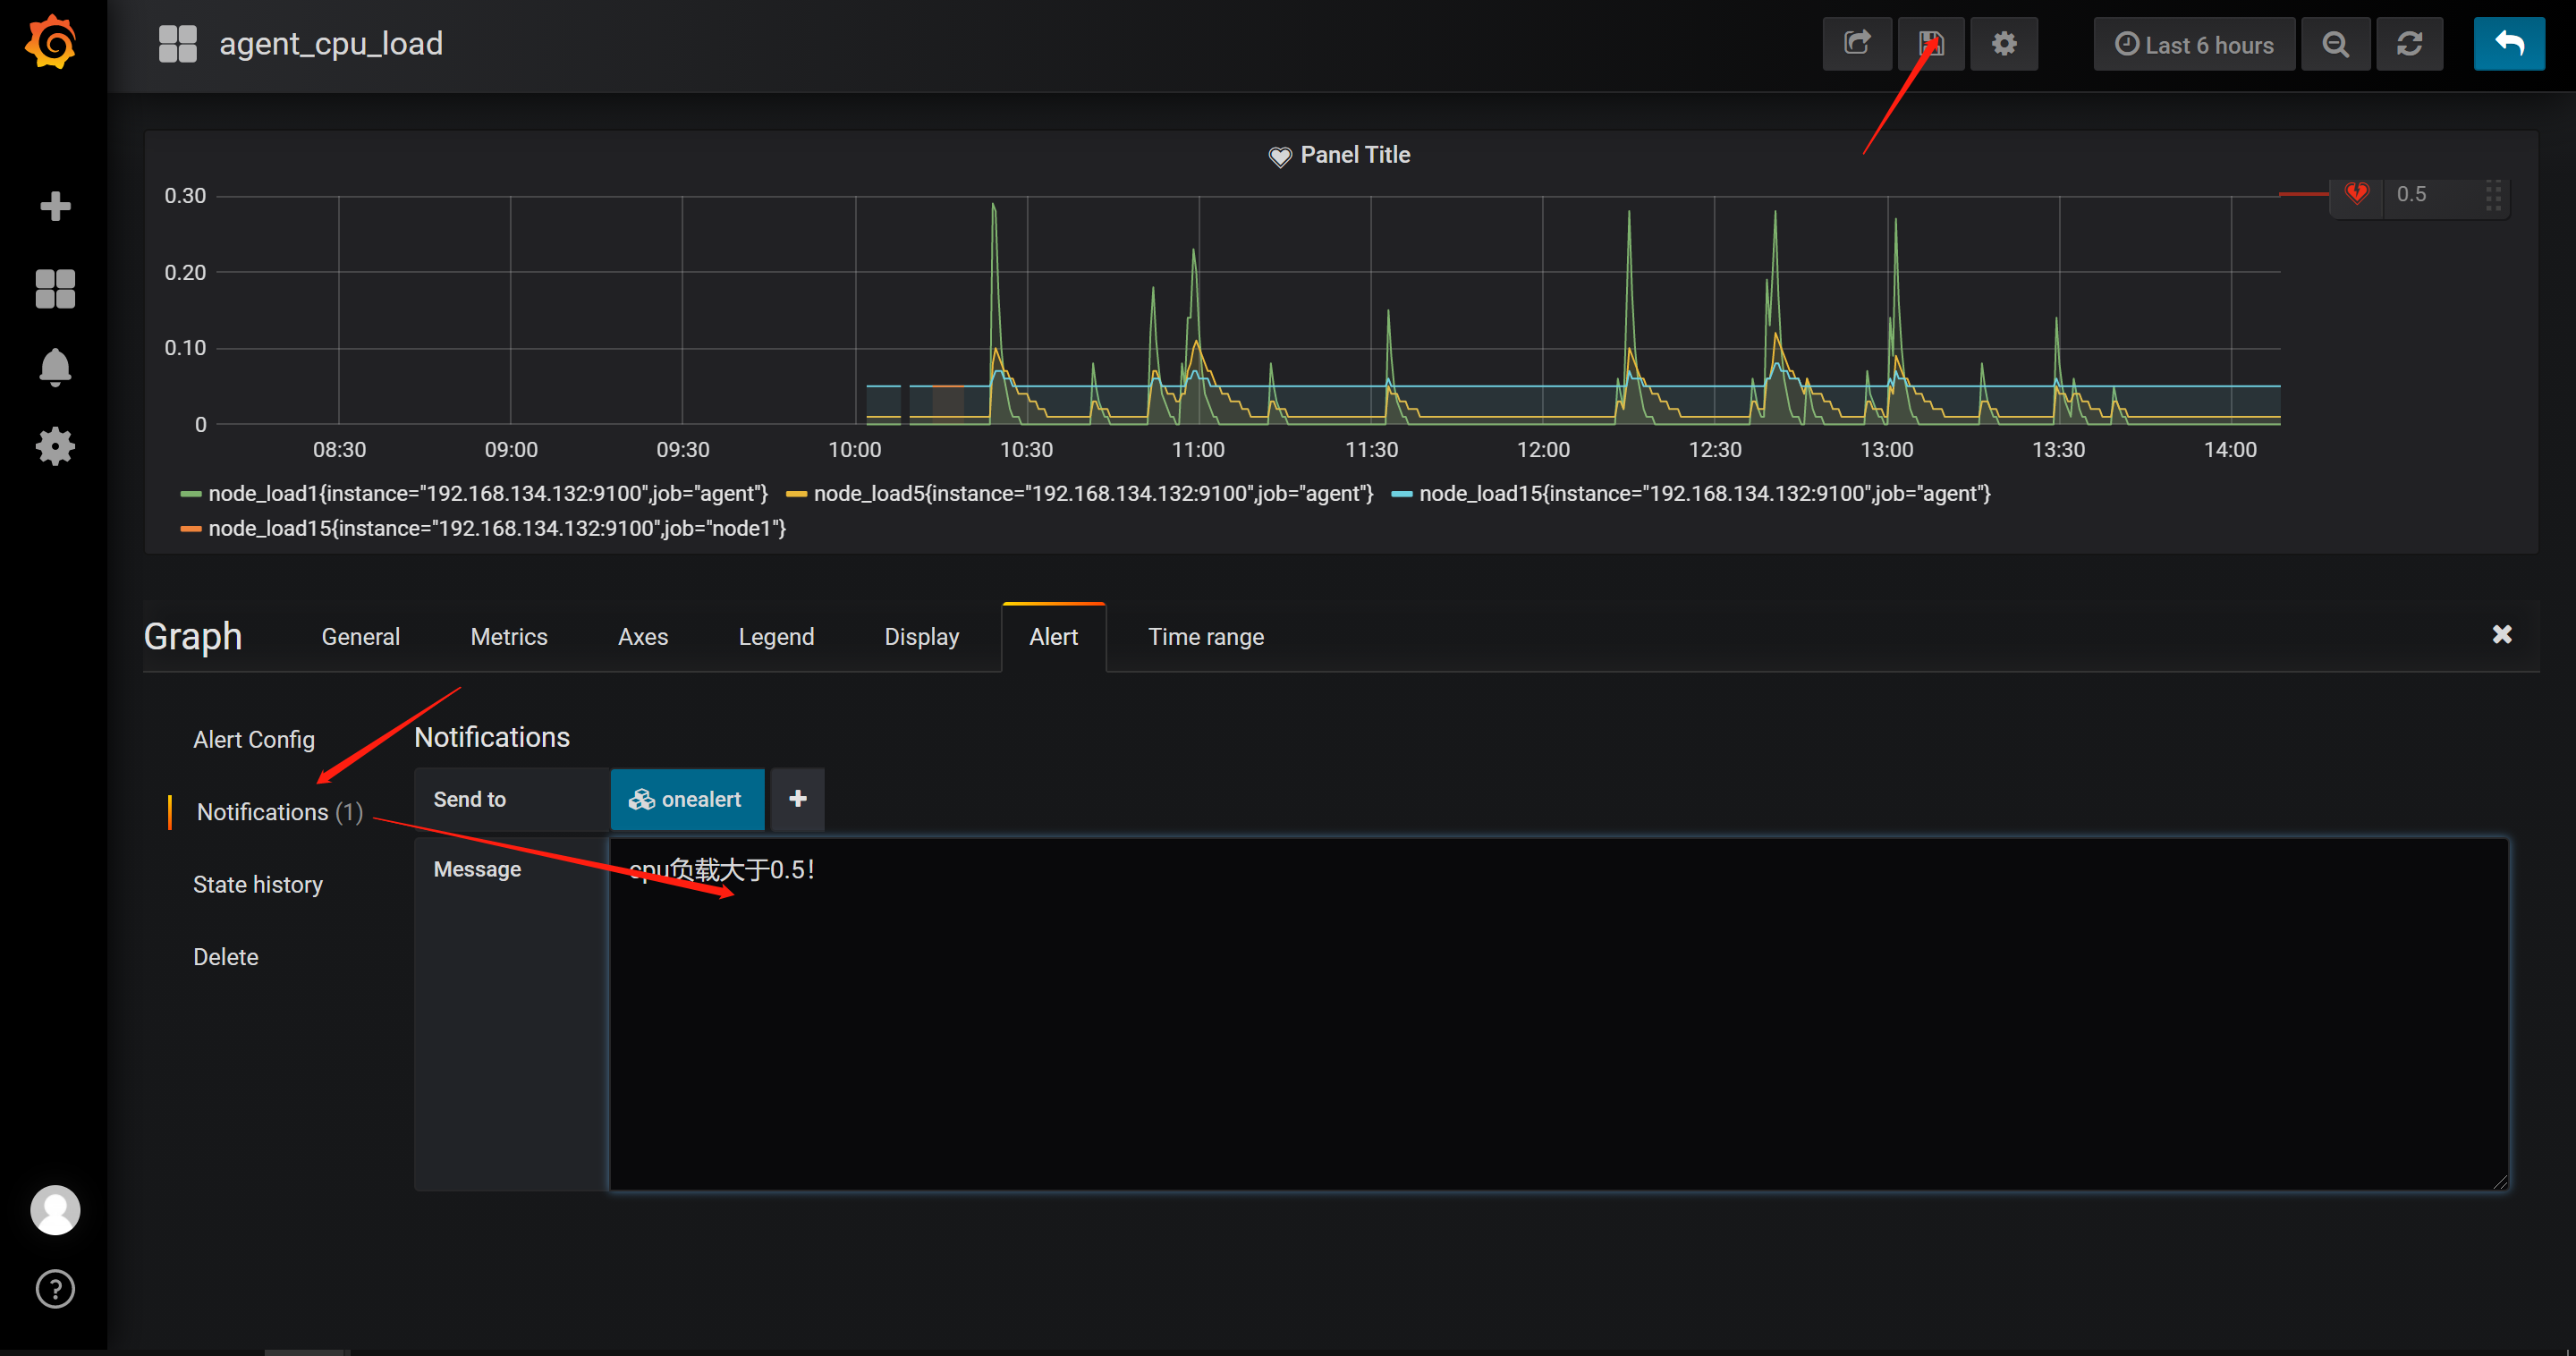
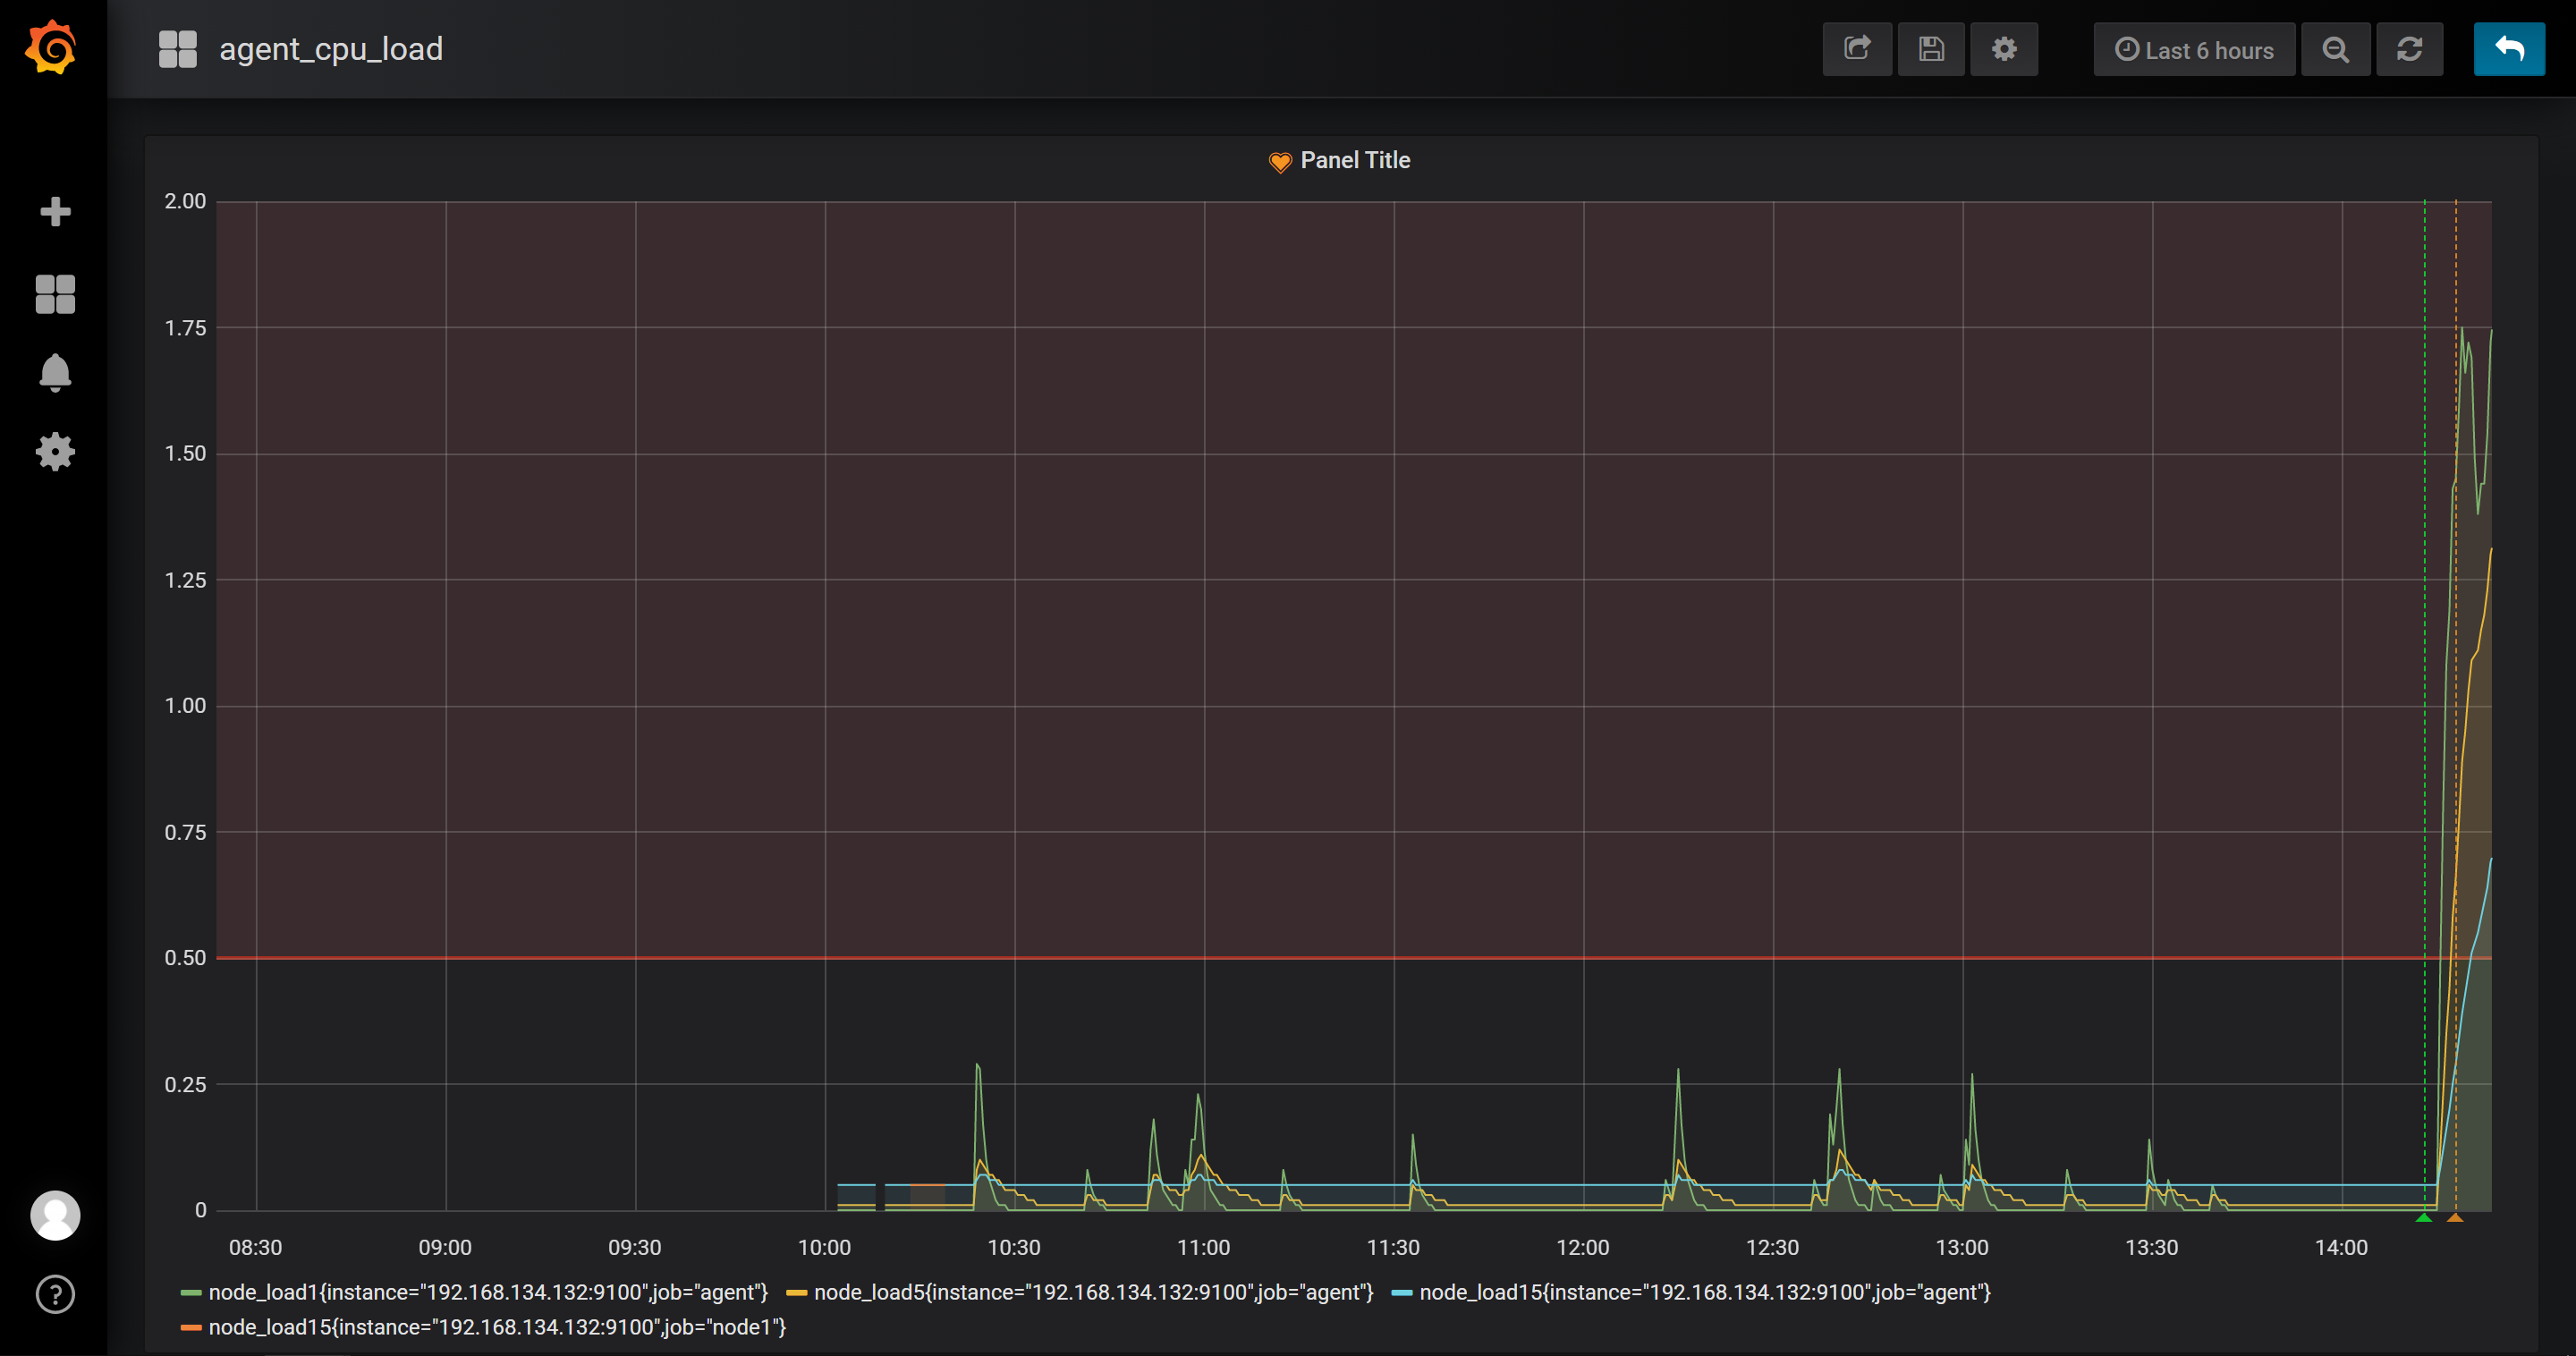
现在可以去设置一个报警来测试了(这里以我们前面加的cpu负载监控来做测试)
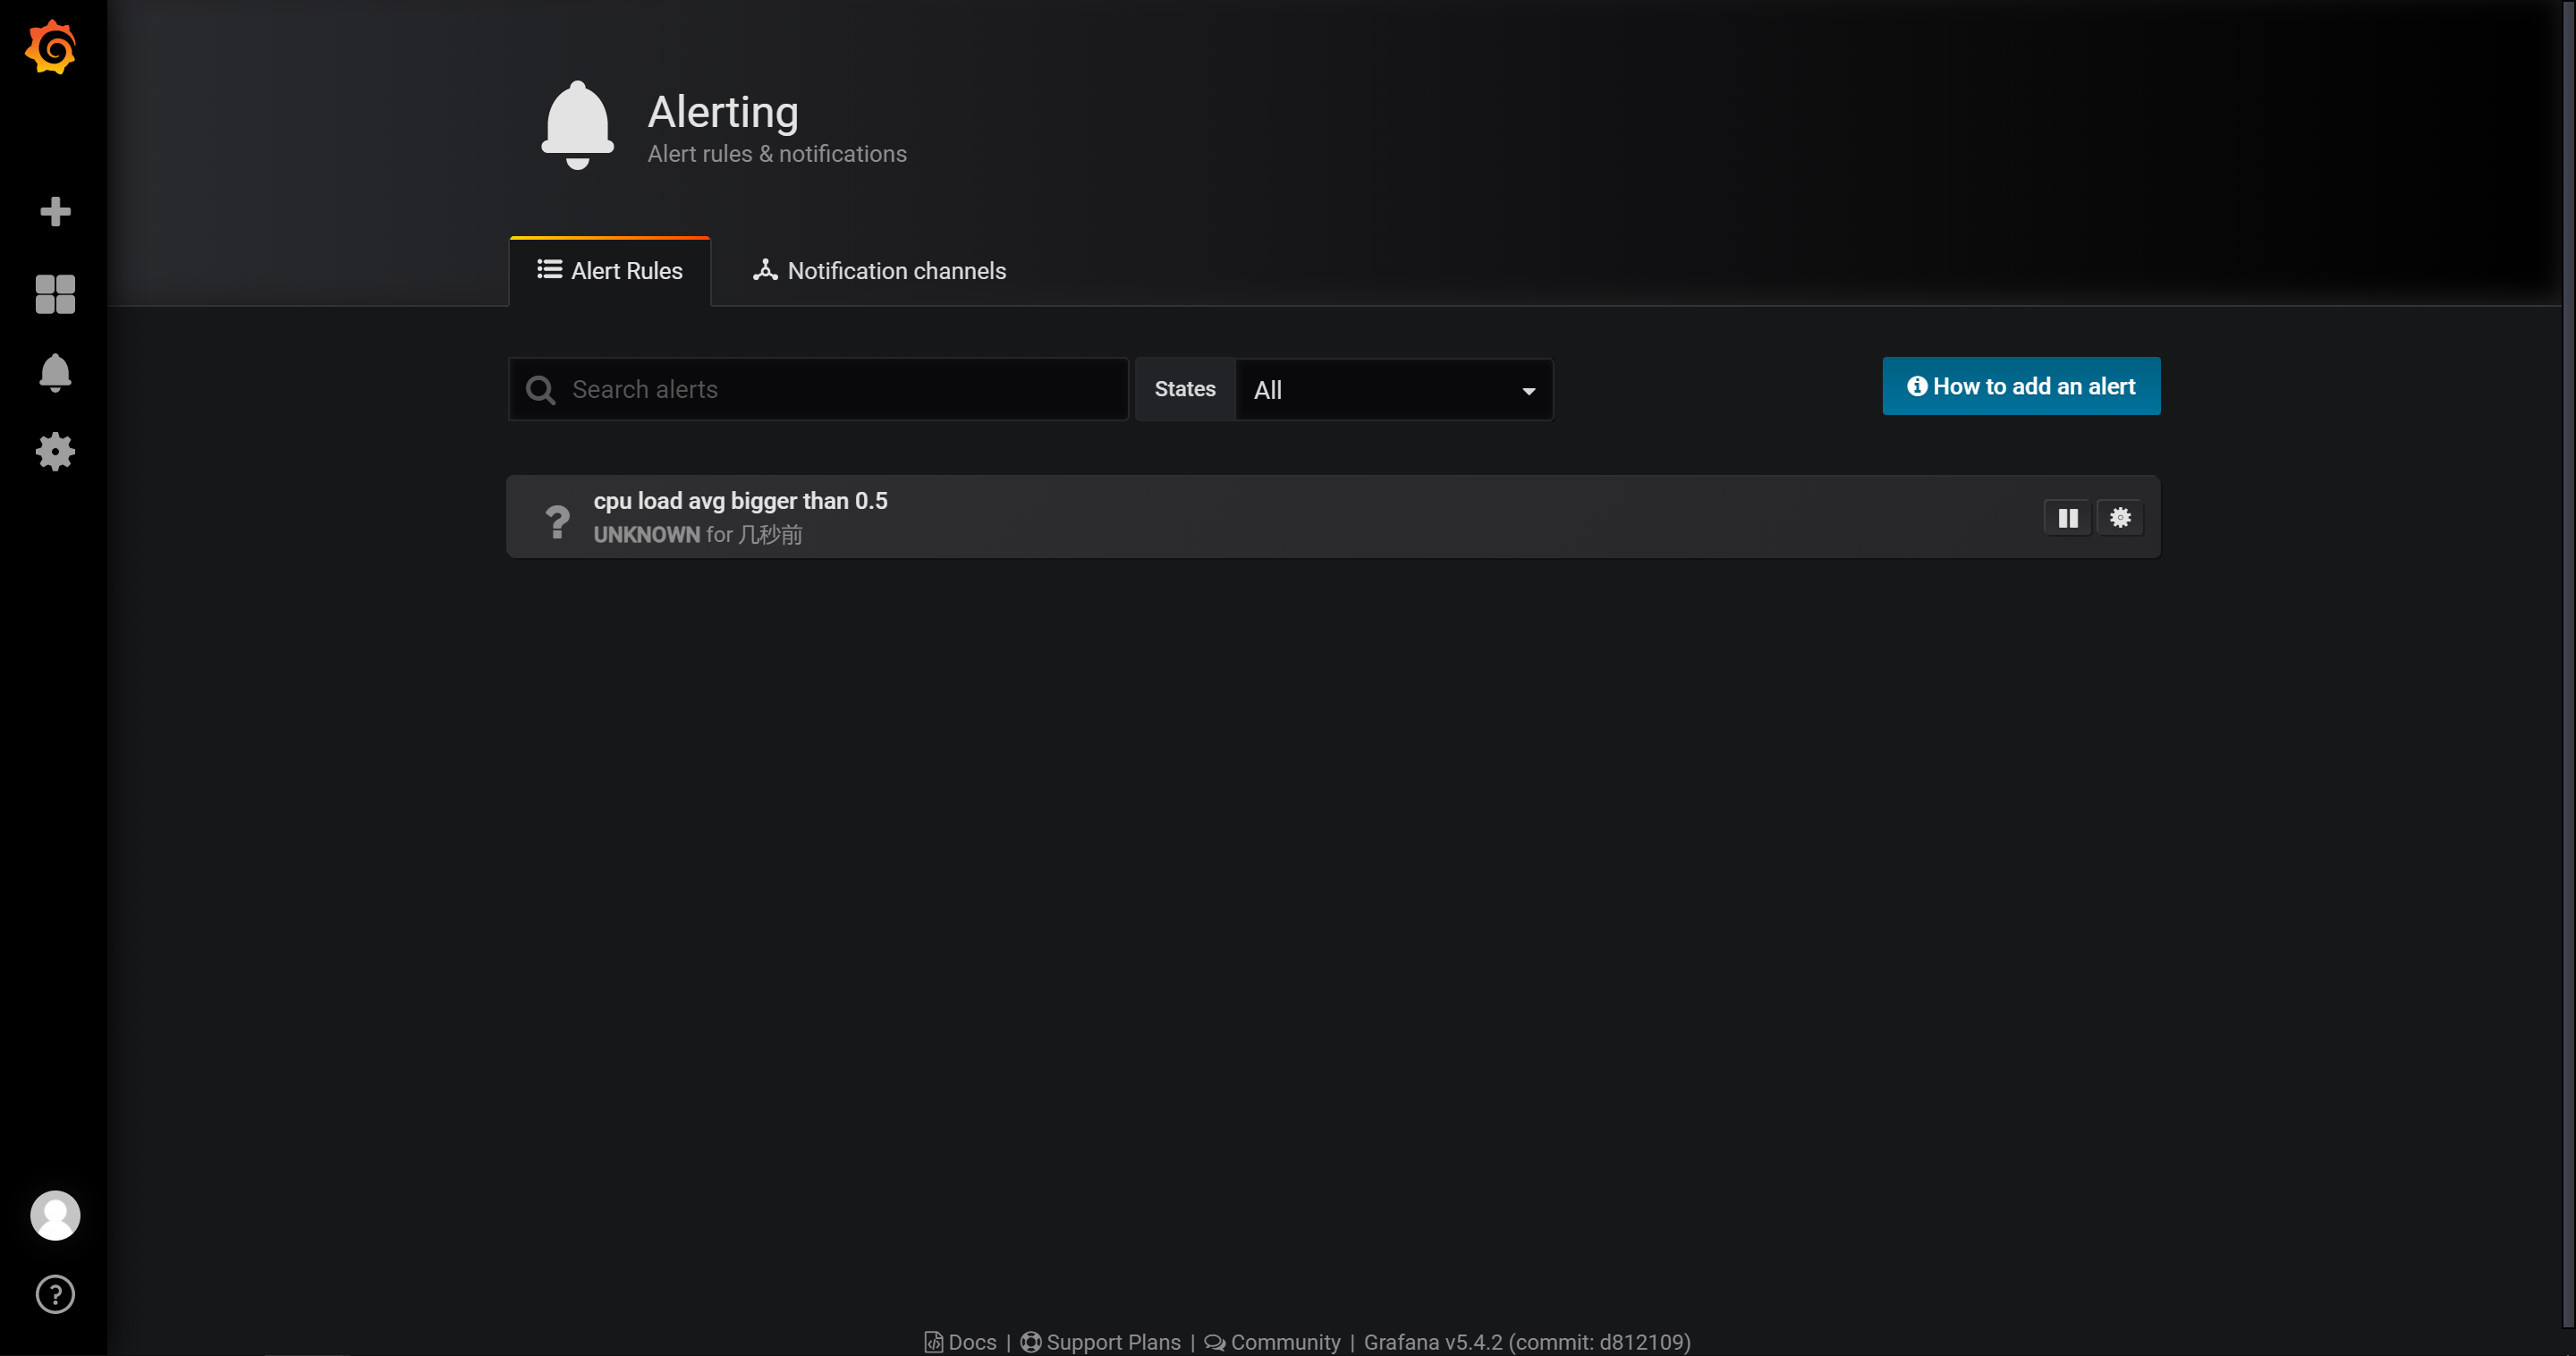
模拟cpu负载
cat /dev/urandom | md5sum
7.3最终的邮件报警效果