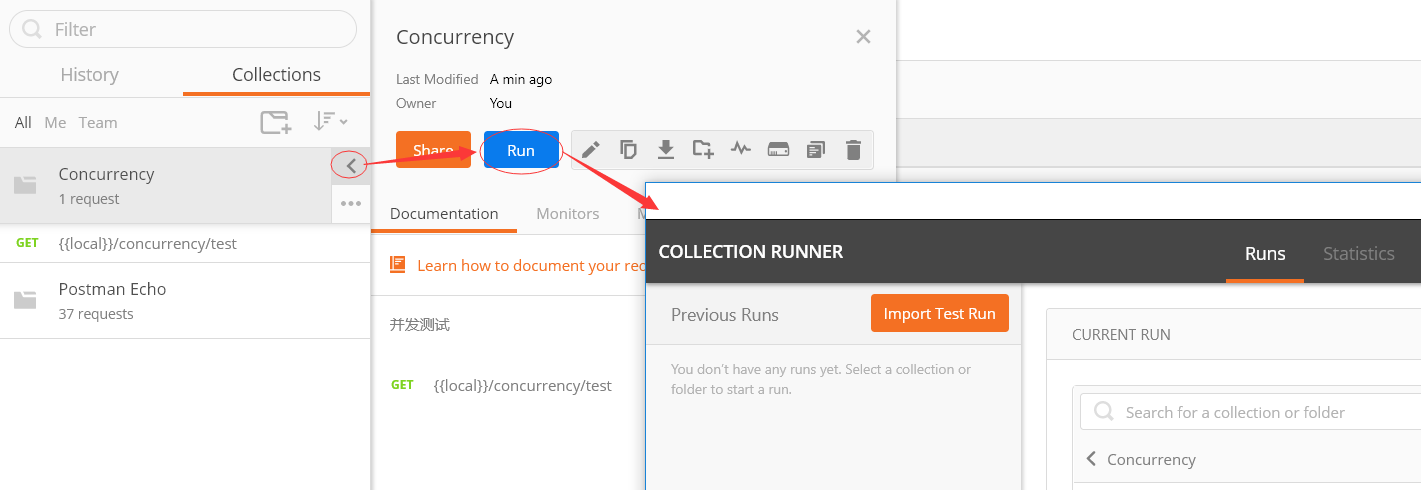
1. PostMan
2. Apache Bench(AB)
首先安装Apache服务器
我这里已经安装wamp环境,已经包括Apache了
-n 请求数量
-c 并发的数量
D:wamp64inapacheapache2.4.23in>ab -n 1000 -c 50 localhost:8080/concurrency/test
This is ApacheBench, Version 2.3 <$Revision: 1748469 $>
Copyright 1996 Adam Twiss, Zeus Technology Ltd, http://www.zeustech.net/
Licensed to The Apache Software Foundation, http://www.apache.org/

Benchmarking localhost (be patient)
Completed 100 requests
Completed 200 requests
Completed 300 requests
Completed 400 requests
Completed 500 requests
Completed 600 requests
Completed 700 requests
Completed 800 requests
Completed 900 requests
Completed 1000 requests
Finished 1000 requests


Server Software:
Server Hostname:        localhost
Server Port:            8080

Document Path:          /concurrency/test
Document Length:        4 bytes

Concurrency Level:      50
Time taken for tests:   0.330 seconds
Complete requests:      1000
Failed requests:        0
Total transferred:      136000 bytes
HTML transferred:       4000 bytes
Requests per second:    3028.16 [#/sec] (mean)
Time per request:       16.512 [ms] (mean)
Time per request:       0.330 [ms] (mean, across all concurrent requests)
Transfer rate:          402.18 [Kbytes/sec] received

Connection Times (ms)
              min  mean[+/-sd] median   max
Connect:        0    0   0.3      0       9
Processing:     5   16   9.1     14     100
Waiting:        4   15   8.8     14      96
Total:          5   16   9.0     15     100

Percentage of the requests served within a certain time (ms)
  50%     15
  66%     16
  75%     18
  80%     19
  90%     23
  95%     29
  98%     44
  99%     52
 100%    100 (longest request)
3. JMeter
下载Apache JMeter
http://jmeter.apache.org/download_jmeter.cgi
下载后进入bin,window打开jmeter.bat,打开JMeter
3.1 创建线程组

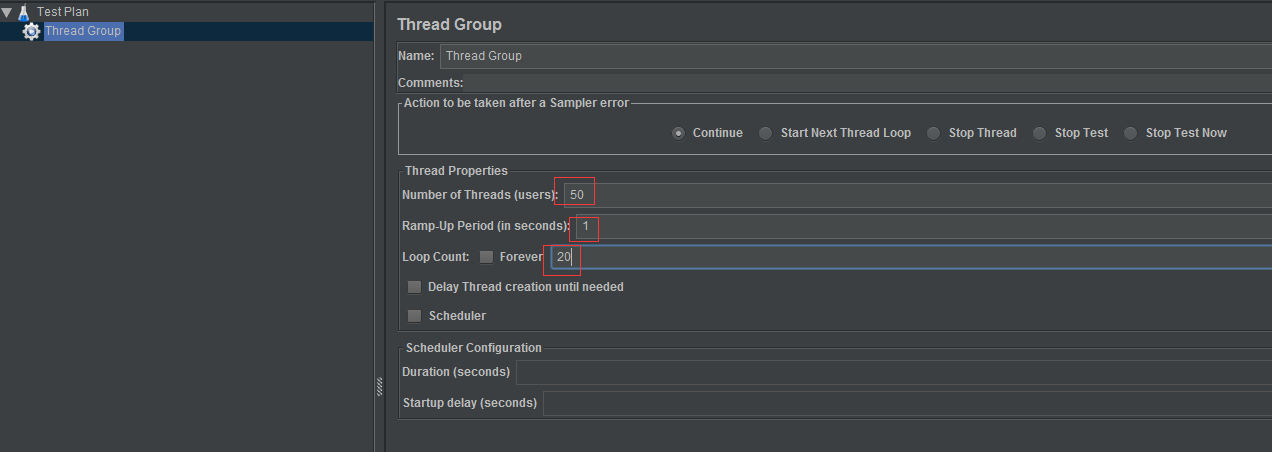
3.2 设置线程组
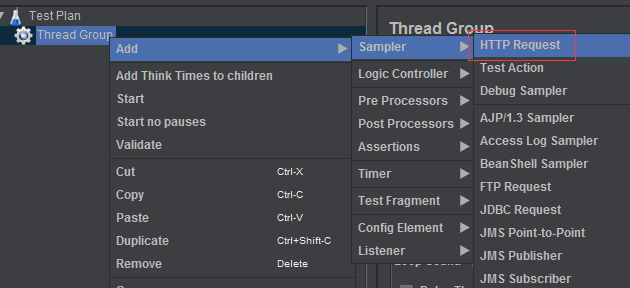
3.3 增加Http请求
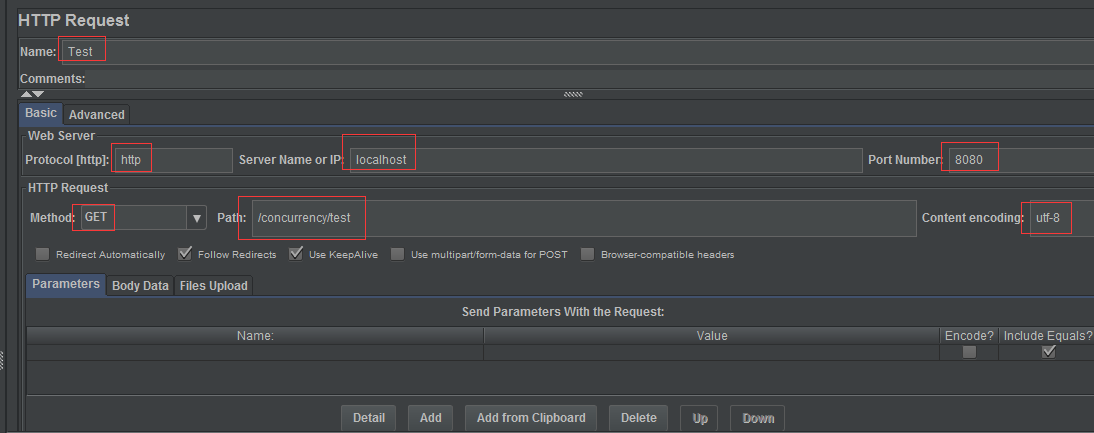
3.4 Http请求设置
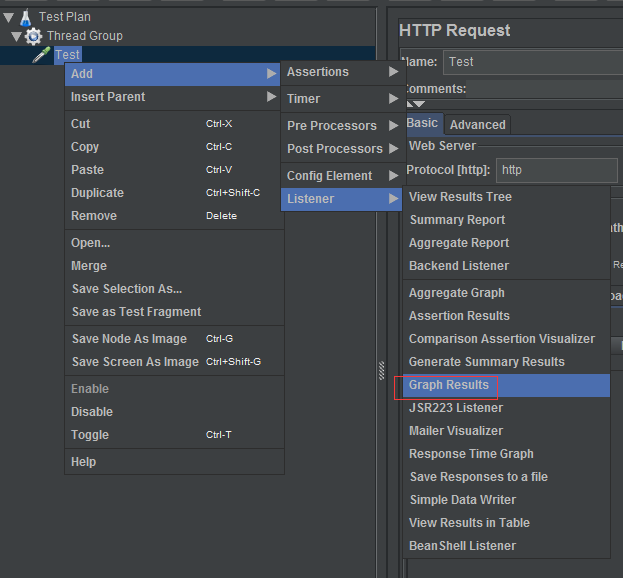
3.5 增加监听器,图形结果
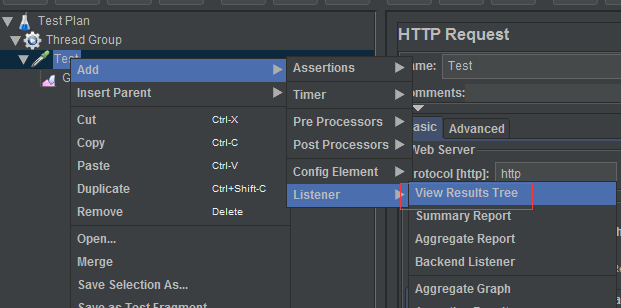
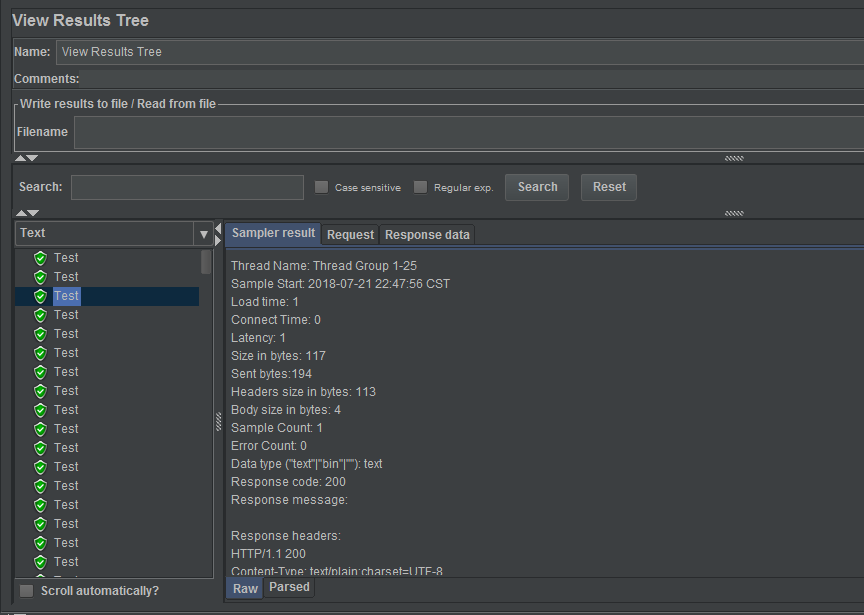
3.6 添加监听器,查看结果树
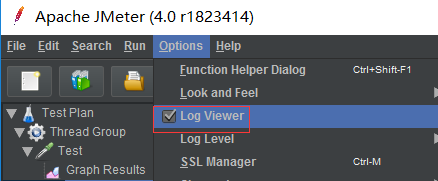
3.7 运行前,打开log viewer查看日志
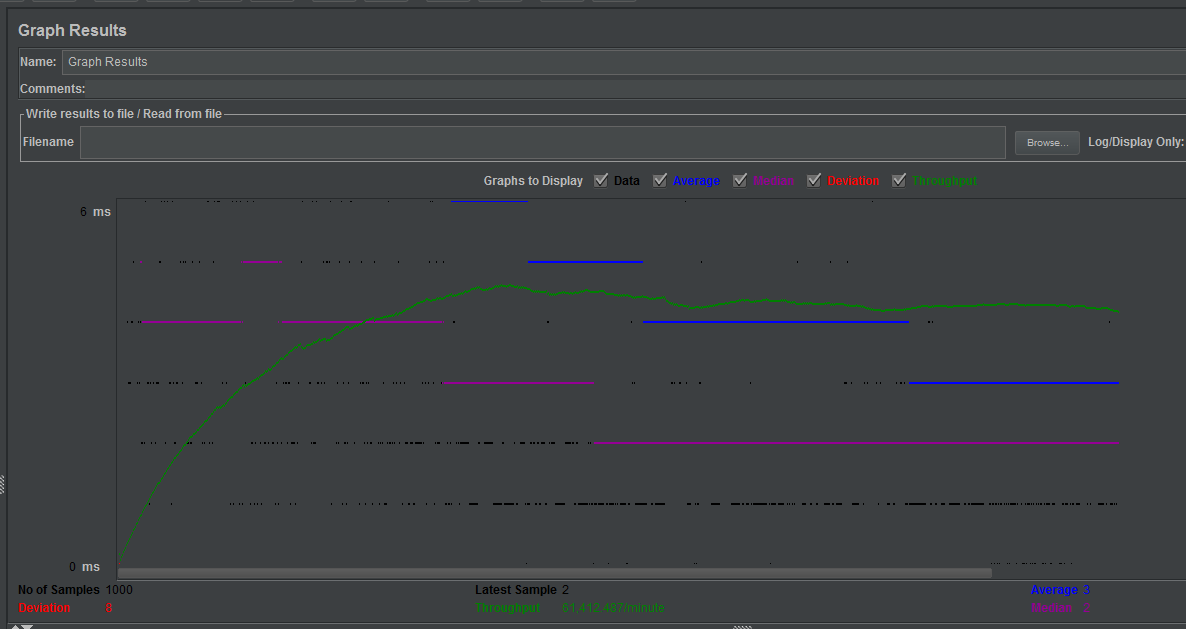
3.8 最后,运行线程组
图形结果
结果树,记录每一次请求
3.9 将JMeter改为中文版本
找到jmeter下的bin目录,打开jmeter.properties 文件
第三十七行修改为
language=zh_CN