Elastic Stack是一个开源的解决方案,可以收集各种类型,各种格式的源数据,同时提供数据搜索,分析和可视化的展示
# 通用搜索引擎
索引组件:获取数据-->建立文档-->文档分析-->文档索引(倒排索引),如Lucene
搜索组件:用户搜索接口-->建立查询(将用户键入的信息转换为可处理的查询对象)-->搜索查询-->展现结果,如Solr,ElasticSearch
各组件介绍
Lucene Core
Apache LuceneTM is a high-performance, full-featured text search engine library written entirely in Java. It is a technology suitable for nearly any application that requires full-text search, especially cross-platform.
Solr
SolrTM is a high performance search server built using Lucene Core, with XML/HTTP and JSON/Python/Ruby APIs, hit highlighting, faceted search, caching, replication, and a web admin interface.
ElasticSearch
Elasticsearch is a distributed, RESTful search and analytics engine capable of solving a growing number of use cases. As the heart of the Elastic Stack, it centrally stores your data so you can discover the expected and uncover the unexpected.
Elastic Stack组件
架构图

以index为界线,下半部分的主要功能完成索引,上半部分完成搜索。
ElasticSearch
功能如上。
Logstash
Logstash is an open source, server-side data processing pipeline that ingests data from a multitude of sources simultaneously, transforms it, and then sends it to your favorite “stash.” (Ours is Elasticsearch, naturally.)
Beats
Filebeat:Log Files
Metricbeat:Metrics
Packetbeat:Network Data
Winlogbeat:Windows Event Logs
Heartbeat:Uptime Monitoring
Kibana
Kibana lets you visualize your Elasticsearch data and navigate the Elastic Stack, so you can do anything from learning why you're getting paged at 2:00 a.m. to understanding the impact rain might have on your quarterly numbers.
小结:对应于架构图,Logstash作为agent,和Beats组件同时可以完成获取内容,logstash比较重量级在消耗系统资源方面,所以实际中用Beats较多;Logstash作为服务器端,可以完成创建文档;ElasticSearch负责索引,同时提供搜索功能;Kibana提供可视的图形管理和展示界面。
ElasticSearch
配置文件:
/etc/elasticsearch/elasticsearch.yml
/etc/elasticsearch/jvm.options
/etc/elasticsearch/log4j2.properties
Unit File:elasticsearch.service
程序文件:
/usr/share/elasticsearch/bin/elasticsearch
/usr/share/elasticsearch/bin/elasticsearch-keystore:
/usr/share/elasticsearch/bin/elasticsearch-plugin:管理插件程序
搜索服务:9200/tcp
集群服务:9300/tcp
集群配置和使用
工作逻辑:所有节点选举一个主节点,负责管理整个集群的状态(green/yellow/red),以及各shards的分布方式;
### ELS构成
    集群:一个或多个节点的集合;
    节点:运行的单个els实例;
    索引:切成多个独立的shard;(以Lucene的视角,每个shard即为一个独立而完整的索引)
### 集群配置:
    1. 到官网下载elasticsearch-5.6.10.rpm
    2. 准备三台服务器
    3. yum install elasticsearch-5.6.10.rpm
    4. elasticsearch.yml配置文件:
		cluster.name: myels (三个节点上的cluster.name一致)
		node.name: node1 (各个不同的节点更改为自已的名字,分别为node2,node3)
                    #node.attr.rack: r1 (机柜感知配置,需要定义好服务器处于的机架)
		path.data: /data/els/data ( chown elasticsearch.elasticsearch)
		path.logs: /data/els/logs
		network.host: 0.0.0.0
		http.port: 9200
		discovery.zen.ping.unicast.hosts: ["node1", "node2", "node3"]
		discovery.zen.minimum_master_nodes: 2
    5. #  curl -XGET 'http://node01:9200/'
        {
              "name" : "node01",
              "cluster_name" : "myels-evan",
              "cluster_uuid" : "w_N3c2aXQnWBEe1UFrIQ8A",
              "version" : {
                "number" : "5.6.10",
                "build_hash" : "b727a60",
                "build_date" : "2018-06-06T15:48:34.860Z",
                "build_snapshot" : false,
                "lucene_version" : "6.6.1"
          },
          "tagline" : "You Know, for Search"
            }
        # 检查集群状态 curl -XGET 'http://node01:9200/_cluster/health?pretty=true'
            {
              "cluster_name" : "myels-evan",
              "status" : "green",
              "timed_out" : false,
              "number_of_nodes" : 3,
              "number_of_data_nodes" : 3,
              "active_primary_shards" : 0,
              "active_shards" : 0,
              "relocating_shards" : 0,
              "initializing_shards" : 0,
              "unassigned_shards" : 0,
              "delayed_unassigned_shards" : 0,
              "number_of_pending_tasks" : 0,
              "number_of_in_flight_fetch" : 0,
              "task_max_waiting_in_queue_millis" : 0,
              "active_shards_percent_as_number" : 100.0
            }
### 集群使用:(RTESful接口风格)
    RESTful API: CRUD(Create, Read, Update, Delete)
	curl  -X<VERB> '<PROTOCOL>://<HOST>:<PORT>/<PATH>?<QUERY_STRING>' -d '<BODY>'
		<BODY>:json格式的请求主体;
                    <VERB>:GET,POST,PUT,DELETE
                    特殊PATH:/_cat, /_search, /_cluster (检查状态)
                    <PATH> /index_name/type/Document_ID/
                    curl  -XPUT 创建文档
                    文档语法:{"key1": "value1", "key2": value, ...}
    实例:
       # curl -XGET 'http://node02:9200/_cluster/stats?pretty=true' (检查集群的详细信息)
       # curl -XPUT http://node02:9200/myindex (创建索引)
       # curl -XGET http://node02:9200/_cat/indices(检查索引)
       # curl -XDELETE http://node02:9200/myindex (删除索引)
       # curl -XGET http://node02:9200/_cat/shards
       # curl -XPUT http://node02:9200/myindex/students/1?pretty -d ‘{"name":"Liang Jindong","age":30,"major":"good english"}’ 创建文档
       #  curl -XGET http://node02:9200/_search? (可以在不同的路径上搜索来定义搜索范围)
Logstash日志收集工具
Logstash可以同时作为agent和server来从指定的位置(如file,mysql, redis)抽取数据,并进行文档化,然后发送给ElasticSearch,也可以只作为服务端,配合轻量化的filebeat抽取数据,在此应用中,logstash只作日志文档化,并发送给ElasticSearch。以下是几种应用场景的架构图:
配置文件有三部分组成,分别定义输入,过滤,输出,由不同类型的插件支持。(注意任何定义在conf.d下的文件都会作为配置文件加载,不同于httpd下必须以.conf结尾才能作为配置文件)
	input {
		...
	}

	filter{
		...
	}

	output {
		...
	}
Logstash安装使用
1. 下载logstash rpm
2. 安装JAVA SDK
3. rpm -ivh logstash-5.6.10.rpm
4. vim /etc/profile.d/logstash.sh
    export PATH=/usr/share/logstash/bin/logstash:$PATH
Logstash配置示例1(标准输入和输出)
#vim /etc/logstash/conf.d/test.conf
            input {
                    stdin{}
            }

            output {
                    stdout {
                        codec => rubydebug
            }
            }
# logstash -f test.conf -t (测试语法)
# logstash -f test.conf  (以test.conf配置文件启动)
# 生成新的文件test.conf,加上filter
    input {
    stdin{}
        }

    filter {
        grok {
                match => { "message" => "%{NUMBER:duration} %{IP:client}" }
        }
    }
    output {
            stdout {
                    codec => rubydebug
            }
    }
    #logstash -f test.conf (启动)
    # 输入32 1.2.3.4
    # 输出为如下,模式中的NUMBER和IP用key duration和client把数字和IP进行拆分,输出新的值。
        The stdin plugin is now waiting for input:
        {
          "@version" => "1",
             "host" => "kvm",
              "duration" => "32",
                "client" => "1.2.3.4",
                "@timestamp" => 2018-08-01T06:15:23.613Z,
               "message" => "32 1.2.3.4"
Logstash配置示例2(web服务生成日志,logstash加载并输出,同时agent和server)
# yum install httpd
# for i in {1..50}; do echo "Test page $i." > test$i.html; done (生成40个页面)
# systemctl start httpd
# LogFormat "%{X-Forwarded-For}i  (更改httpd的logformat)
# while true; do client=$[$RANDOM%254+1]; curl -s --header "X-Forwarded-For: 172.20.0.$client" http://172.20.42.239/test$client.html;sleep 1;done (模拟客户端访问,生成httpd的access_log)
以文件为输入插件,同时加载Grok过滤器插件对日志分段,每一段加有特定意义的key,才能显示数据的价值。Grok内置支持120多种模式,去匹配如htpd, redis等,可以查看/usr/share/logstash/vendor/bundle/jruby/1.9/gems/logstash-patterns-core-4.1.2/patterns/grok-patterns,每个模式匹配都有唯一的名字对应,在logstash配置文件中直接引用内置模式的名称。
# vim test2.conf
   input {
    file{
            start_position => end
            path => ["/var/log/httpd/access_log"]
        }
    }

    filter {
            grok {
                match => { "message" => "%{HTTPD_COMBINEDLOG}" }
        }
    }
    output {
            stdout {
                    codec => rubydebug
                }
    }
# logstash -f test3.conf
# 显示结果,模式匹配切割正常,达到输出内容结构化。
       "request" => "/test54.html",
      "agent" => ""curl/7.29.0"",
       "auth" => "-",
      "ident" => "-",
       "verb" => "GET",
    "message" => "172.20.0.54 - - [01/Aug/2018:02:38:48 -0400] "GET /test54.html HTTP/1.1" 200 14 "-" "curl/7.29.0"",
       "path" => "/var/log/httpd/access_log",
       "referrer" => ""-"",
     "@timestamp" => 2018-08-01T06:38:48.897Z,
       "response" => "200",
      "bytes" => "14",
       "clientip" => "172.20.0.54",
       "@version" => "1",
       "host" => "kvm",
    "httpversion" => "1.1",
      "timestamp" => "01/Aug/2018:02:38:48 -0400"
    }
插件date,能把上述的@timestamp字段以timestamp字段显示,同时把timestamp字段删除(插件date的默认功能)
# vim test3.conf
input {
    file{
            start_position => end
            path => ["/var/log/httpd/access_log"]
        }
    }

    filter {
            grok {
                    match => { "message" => "%{HTTPD_COMBINEDLOG}" }
                    remove_field => "message"
        }
            date {
                    match => ["timestamp","dd/MMM/YYYY:H:m:s Z"]
                    remove_field => "timestamp"
        }
    }
    output {
            stdout {
                    codec => rubydebug
                }
    }

# 输出
{
    "request" => "/test111.html",
      "agent" => ""curl/7.29.0"",
       "auth" => "-",
      "ident" => "-",
       "verb" => "GET",
       "path" => "/var/log/httpd/access_log",
       "referrer" => ""-"",
     "@timestamp" => 2018-08-01T06:47:35.000Z,
       "response" => "404",
      "bytes" => "210",
       "clientip" => "172.20.0.111",
       "@version" => "1",
       "host" => "kvm",
    "httpversion" => "1.1"
    }

Geoip插件,能把访问的IP用图形展示所处的详细。
# 到https://dev.maxmind.com/geoip/geoip2/geolite2/下载简单版本
# vim test4.conf
input {
    file{
            start_position => end
            path => ["/var/log/httpd/access_log"]
        }
    }

    filter {
            grok {
                    match => { "message" => "%{HTTPD_COMBINEDLOG}" }
                    remove_field => "message"
            }
    date {
            match => ["timestamp","dd/MMM/YYYY:H:m:s Z"]
            remove_field => "timestamp"
    }
    geoip {
            source => "clientip"
            target => "geoip"
            database => "/etc/logstash/GeoLite2-City_20180703/GeoLite2-City.mmdb"
                }
    }
   output {
   stdout {
            codec => rubydebug
            }
    }
# 输出IP所在的国家,城市,经纬度
{
    "request" => "/test208.html",
      "agent" => ""curl/7.29.0"",
      "geoip" => {
                "ip" => "208.20.0.100",
          "latitude" => 37.751,
      "country_name" => "United States",
     "country_code2" => "US",
    "continent_code" => "NA",
     "country_code3" => "US",
          "location" => {
        "lon" => -97.822,
        "lat" => 37.751
    },

输出插件ElasticSearch
# vim test5.conf
input {
    file{
            start_position => end
            path => ["/var/log/httpd/access_log"]
    }
    }

filter {
        grok {
            match => { "message" => "%{HTTPD_COMBINEDLOG}" }
            remove_field => "message"
    }
    date {
            match => ["timestamp","dd/MMM/YYYY:H:m:s Z"]
            remove_field => "timestamp"
    }
    geoip {
            source => "clientip"
            target => "geoip"
            database => "/etc/logstash/GeoLite2-City_20180703/GeoLite2-City.mmdb"
                }
    }
    output {
    elasticsearch {
           hosts => ["http://node1:9200/","http://node2:9200/","http://node3:9200/"]
           index => "logstash-%{+YYYY.MM.dd}"
           document_type => "apache_logs"
           }
    }
# logstash -f test5.conf 启动
# 查看ElasticSearch,可以看到以logstash为索引的
    curl -XGET node02:9200/_cat/indices
    green open logstash-2018.08.01 LceRz3DlQkiBx8BlEDhs_g 5 1 611 0 1.1mb 746kb
# 查询此index的具体信息
    curl -XGET node02:9200/logstash-2018.08.01/_search?q=clientip:109.20.0.100
    curl -XGET node02:9200/logstash-2018.08.01/_search?q=response:404
安装Kibana图表展示工具:
只要Kinba能访问ElasticSearch中的任何一个结点, 就可以图形展示
# wget https://artifacts.elastic.co/downloads/kibana/kibana-5.6.8-x86_64.rpm
# rpm -ivh kibana-5.6.8-x86_64.rpm
# cd /etc/kibana/
# server.port: 5601; server.basePath: "/kibina"; server.host: "0.0.0.0"; elasticsearch.url: "http://node02:9200"
# systemctl start kibana
# http://172.20.42.240:5601/app/kibana 访问网页
# 选择加载的index可以用通配符匹配
# 设置搜索item如geoip.timezone:Asia
response:[200 TO 302] 范围查询
agent:curl 客户端访问类型
agent:curl OR chrome or firefox OR safari
agent:curr~ 模糊搜索
# 还可以用Visualize
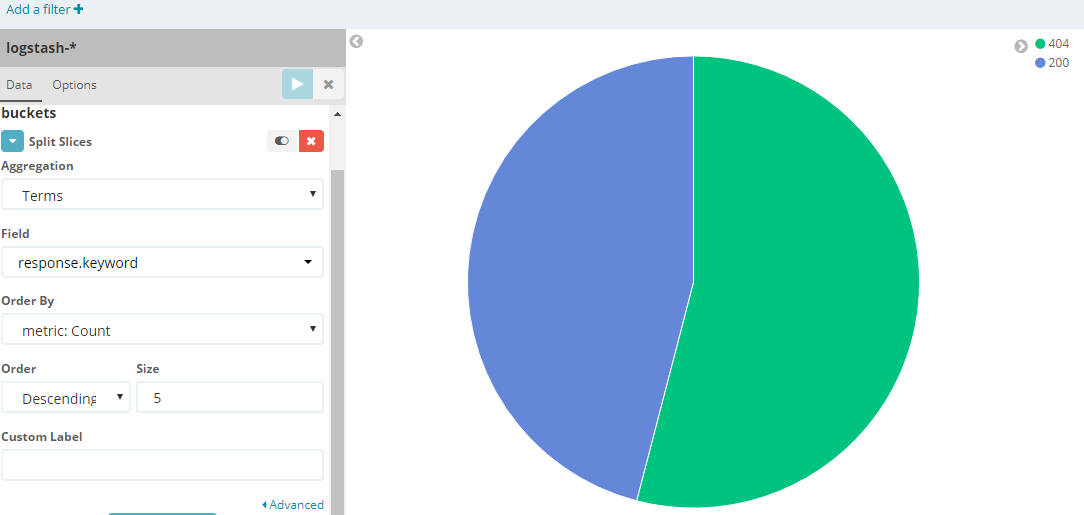
Logstash配置示例3(web服务生成日志,beats组件轻量级的收集日志,logstash只做为server,输出到ElasticSearch)
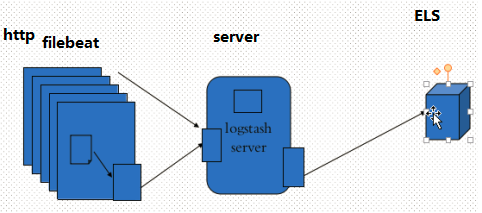
filebeat需要从指定的位置读入日志,然后再发给logstash,filebeat无法做日志的文档化
# vim filebeat.yml
     paths:
    - /var/log/httpd/access_log*
    output.elasticsearch:
      output.elasticsearch:
      hosts: ["node03:9200","node02:9200"]
# systemctl start filebeat
# curl node03:9200/_cat/indices
        yellow open filebeat-2018.08.01 M2TgTLhFTe2MtprkyR9lag 5 1    0 0   324b   324b
# 更改filebeat输出到logstash
    output.logstash:
    hosts: ["172.20.42.239:5044"]

# 更改logstash的配置文件(input更改为beats,其余保持不变)
    input {
    beats {
            port => 5044
        }
    }
# curl node03:9200/_cat/indices
    yellow open logstash-2018.08.01 PbCtEn_UTZOfknX_5LnGaA 5 1    148 0 838.5kb 838.5kb
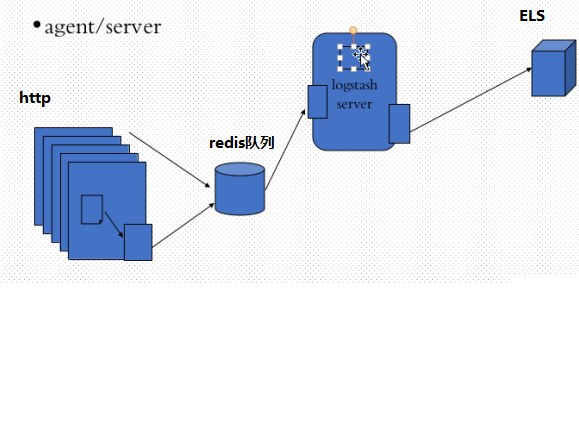
Logstash配置示例4(web服务生成日志,beats组件轻量级的收集日志,发送给redis消息队列,logstash只做为server去redis取数据,输出到ElasticSearch)
# yum install redis
# vim /etc/redis.conf
    bind 0.0.0.0
    requirepass redhat
# systemctl start redis
# filebeat.full.yml中有redis的配置示例 ,复制到filebeat.yml,更改相关的配置
    output.redis:
    enabled: true
     hosts: ["172.20.42.222:6379"]
     port: 6379
     key: filebeat
     password: redhat
     db: 0
     datatype: list
# logstash从redis中加载日志
    input {
        redis {
                data_type => "list"
                db => 0
                host => "172.20.42.239"
                key => "filebeat"
                port => 6379
                password => "redhat"
        }
    }
# 在ElasticSearch上 curl node03:9200/_cat/indices
    yellow open logstash-2018.08.02 dKULdxU_SzuxmJQToCMbug 5 1 2246 0  1.3mb  1.3mb
# 在redis服务器,redis-cli中查看,filebeat中消息队列为0,即消息队列每增加一个,都会被logstash取走。
    127.0.0.1:6379> LLEN filebeat
    (integer) 0