Python_删除/创建指定目录及其下所有子目录的文件,该文件记录当前文件夹的内容 - IGod接口 - 博客园
Python_删除/创建指定目录及其下所有子目录的文件,该文件记录当前文件夹的内容
本文内容
- 代码环境
- 演示代码
本文代码主要目的是,我有个 3T 容量的移动硬盘,电影很多,闲着无聊,想用 jQuery 写个 Web 应用程序,简单显示一下电影名称和海报等信息。主要就是不想程序过大,太复杂,CS 程序要创建、生成项目什么的。为每级目录及其下所有子目录生成一个元数据纯文本文件,用 JavaScript 加载并适当处理页面,再用浏览器查看一下。
代码环境
- Windows 7 64 位旗舰版
- Python 3.3
演示代码
删除路径 e:\\PPDownload 目录及其下所有子目录的 config.txt 文件,并创建相应 config.txt 元数据文件,内容为每个目录的内容。
若 e:\\PPDownload 目录下有目录 a、b、c,则 e:\\PPDownload\\config.txt 文件内容为 a、b、c;若 e:\\PPDownload\\a 目录下有目录 a1、b1、c1,则 e:\\PPDownload\\a\\config.txt 内容为 a1、b1、c1。以此类推。
import osmetapath='e:\\PPDownload'## 递归删除def delmeta(filename):if os.path.exists(filename):print('\r\n 正在删除 ' + os.path.join(os.getcwd(), filename) + '...')os.remove(filename)for item in os.listdir():if os.path.isdir(item):os.chdir(item)delmeta(filename)os.chdir('..')## 递归创建def crtmeta(filename):for item in os.listdir():wr = open(filename, 'a')wr.write(item)wr.write('\r\n')wr.close()print('\r\n 正在创建 ' + os.path.join(os.path.abspath(os.getcwd()), filename) + '...')if os.path.isdir(item):os.chdir(item)crtmeta(filename)os.chdir('..')os.chdir(metapath)print('\r\n 正在删除元数据...')delmeta('config.txt')print('\r\n 已删除所有元数据!')os.chdir(metapath)print('\r\n 正在创建元数据...')crtmeta('config.txt')print('\r\n 已创建所有元数据!')
星球 - CMClass: 簡述 libsvm(Support Vector Machine library) 使用方法 | Ubuntu 正體中文站
星球 - CMClass: 簡述 libsvm(Support Vector Machine library) 使用方法
作者:何岳峰 hoamon | 來自:hoamon's sandbox | 2011/4/27 15:35:00libsvm乃台大林智仁老師開發的 Open source 工具,其目的為實作 Support Vector Machine 分類器,使用語言主要是 C++ ,目前也有 JAVA 版本,也提供其他語言的 wrapper ,像是 Perl, Python, Ruby, Matlab, Hashkell, Lisp 等。
詳細數學就不介紹了,怕大家睡著(但其實是因為還沒看懂),各位可以看一下下面那段這個影片,大略了解 SVM 分類器如何區別不同資料。
[!IFRAME FILTERED!]
本文章主要介紹的是用 Python 語言去操作 libsvm 函式庫。
先解壓縮 libsvm.tgz 檔,可以看到 python 及 windows 資料夾,如果要在 Linux 中使用的話,請在主目錄中作
$ make lib
這樣會得到 libsvm.so.2 檔,這是 libsvm 的主函式庫,而在 windows 中使用的話,它則是先幫你編譯好這個檔了,可在 windows/ 找到這個 libsvm.dll 檔。
在 Linux 中,請把 python/*py 放到 /usr/local/lib/python2.6/site-packages 中,而 libsvm.so.2 放到 /usr/local/lib/python2.6/ 。
在 windows 中,請把 python/*py 放到 C:\Python26\Lib\site-packages 中,而 libsvm.dll 請放到 C:\Python26\Lib\windows 資料夾中(因為 svmutil.py 寫死了它的相對路徑,所以務必依它的相對位置置放)。
請在 Python shell 中,鍵入下列指令,測試是否安裝成功。
>>> from svmutil import *
>>>
沒錯誤訊息,那就是安裝對了。
使用 svm ,主要就是兩個動作: 訓練及預測。
訓練:
svmutil.svm_train 函式的引數有「類別標籤」、「觀察值」、「參數」。
你的原始資料若是如下:
1. 3, 4, 5, 6 => 第二類
2. 3, 4, 5, 5 => 第一類
3. ....
前面的 #. 表第幾個觀察值,後面逗號分隔的數據為各維度的值,行末則是放置該觀察值為第幾類的說明。請把它轉成
>>> Y = [2, 1, ...]
>>> x = [(3, 4, 5, 6), (3, 4, 5, 5), ...]
類別標籤請獨立放置到一個 list 中,而觀察值維度則依序放置到另一個 list 中。接下來,就能使用 svm_train:
>>> from svmutil import *
>>> model = svm_train(Y, x, '-c 4')
所得到的 model 就是一個經過訓練的分類器。
預測
接下來,我們要拿訓練好的分類器去預測新的觀察值:
>>> p_label, p_acc, p_val = svm_predict([0]*len(new_x), new_x, model)
而 p_label 就是依 new_x 順序所對應的類別標籤 list 。
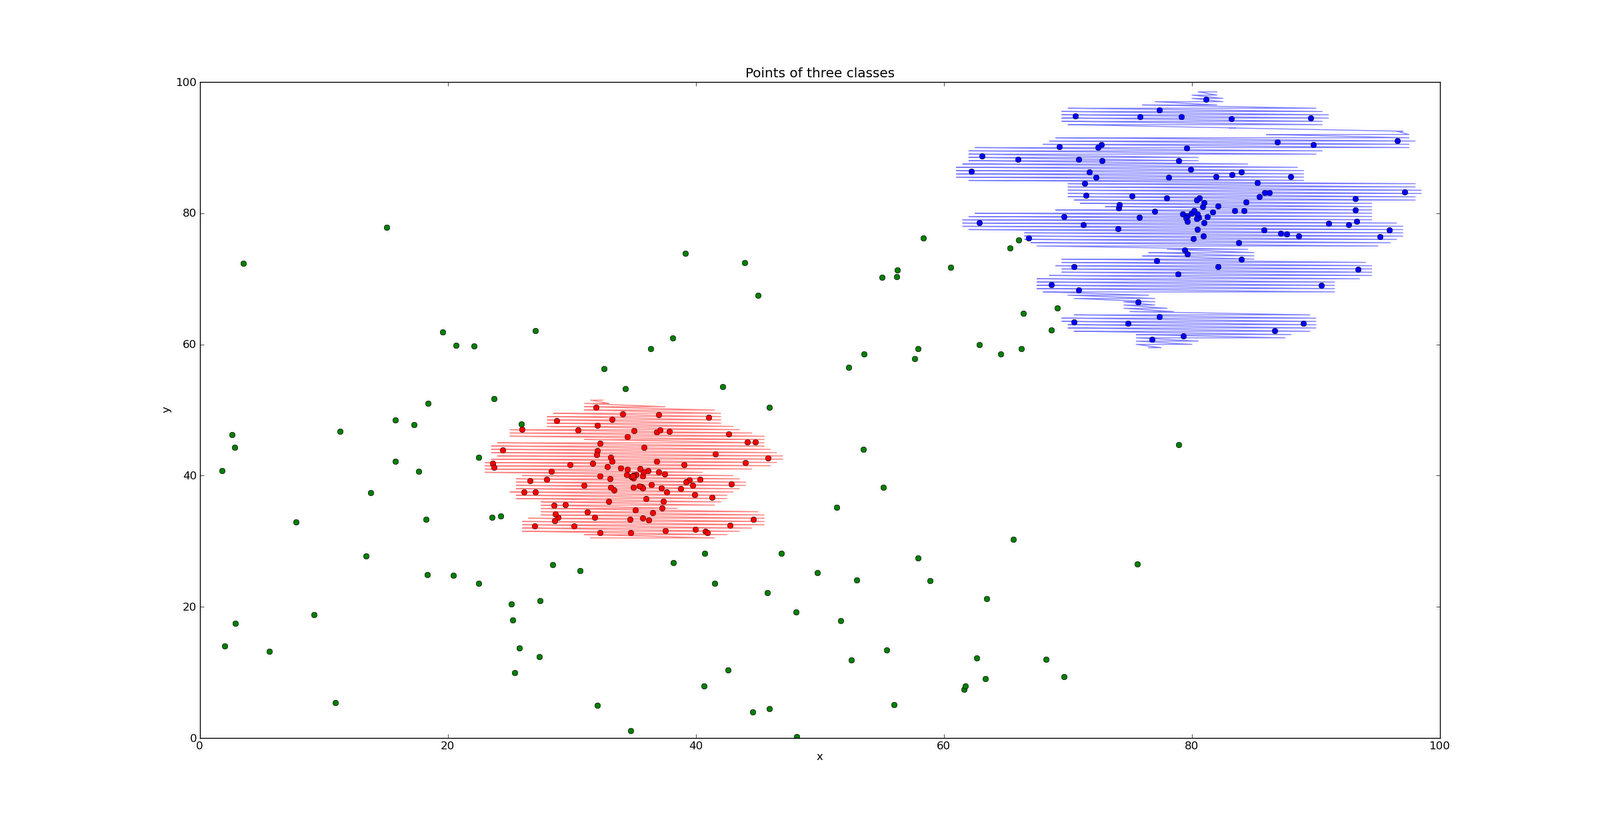
下圖是我隨機生成的 300 點,圓點為原始的觀察值,而以線相連的連續點則是預測點。
詳細程式碼請參照如下:1 #! /usr/bin/python
2 # -*- coding: utf8 -*-
3
4 __author__="hoamon"
5 __date__ =u"$2011/4/12 下午 05:52:31$"
6
7 from math import pi, sin, cos
8 from random import random
9 from matplotlib import pyplot as plt
10 from svmutil import *
11
12 def circleData(centre, radius, down_limit_percent=0, lens=100, range=[0, 100]):
13 points = []
14 while len(points) < lens:
15 _angle = 2 * pi * random()
16 radius_percent = random()
17 if radius_percent < down_limit_percent: continue
18 _radius = radius * radius_percent
19 x = centre[0] + cos(_angle) * _radius
20 y = centre[1] + sin(_angle) * _radius
21 if range[0] <= x <= range[1] and range[0] <= y <= range[1]:
22 points.append((x, y))
23 return points
24
25
26 def test():
27 u""" 製作三群的隨機資料,每群皆 100 個點,點位置的 x, y 限制在 0 ~ 100 之間
28
29 最後利用 matplotlib 繪製出來的圖,"單點"表原始資料,而連續點畫線的部份,
30 該點位的類別則是利用 svm_predict 計算出來的。
31
32 Y = [1, 1, 1, ..., 2, 2, 2, ..., 3, 3, 3, ...]
33 x = [(x1, y1), (x2, y2), ...]
34 """
35 Y = [1] * 100 + [2] * 100 + [3] * 100
36 x1, x2, x3 = (circleData((35, 40), 12),
37 circleData((35, 40), 48, down_limit_percent=0.25),
38 circleData((80, 80), 20)
39 )
40 x = x1 + x2 + x3
41
42 m = svm_train(Y, x, '-c 4')
43
44 #INFO 在 100x100 的畫布上,打出 40000 個點,拿這 4 萬個點去給 m 作預測,算出這 4 萬個點的類別
45 points = [(i*0.5, j*0.5) for j in xrange(0, 200) for i in xrange(0, 200)]
46 p_label, p_acc, p_val = svm_predict([0]*40000, points, m)
47
48 line_1, line_2, line_3, pre_label = [], [], [], p_label[0]
49 for i in xrange(0, 200):
50 for j in xrange(0, 200):
51 index = i * 200 + j
52 now_label = p_label[index]
53 if now_label == 1 :
54 line_1.append(points[index])
55 elif now_label == 2 :
56 line_2.append(points[index])
57 elif now_label == 3 :
58 line_3.append(points[index])
59
60 fig = plt.figure()
61 ax = fig.add_subplot(111)
62 ax.plot([p[0] for p in x1], [p[1] for p in x1], 'ro')
63 ax.plot([p[0] for p in x2], [p[1] for p in x2], 'go')
64 ax.plot([p[0] for p in x3], [p[1] for p in x3], 'bo')
65 ax.plot([p[0] for p in line_1], [p[1] for p in line_1], 'r-', alpha=0.5)
66 ax.plot([p[0] for p in line_3], [p[1] for p in line_3], 'b-', alpha=0.5)
67 ax.set_title('Points of three classes')
68 ax.set_xlabel('x')
69 ax.set_ylabel('y')
70 ax.set_xlim(0, 100)
71 ax.set_ylim(0, 100)
72 plt.show()
73 return m, p_label, p_acc, p_val
74
75
76 if __name__ == "__main__":
77 test()
ZODB programming guide — ZODB v3.10.3 documentation
ZODB programming guide
This guide is based heavily on the work of A. M. Kuchling who wrote the original guide back in 2002 and which was published under the GNU Free Documentation License, Version 1.1. See the appendix entitled “GNU Free Documentation License” for more information.
一步步用python制作游戏外挂 - blueel - 博客园
autopy介绍
github上有一篇很不错的入门文章,虽然是英文但是很简单,不过我还是摘几个这次用得到的说明一下,以显示我很勤劳。
移动鼠标
1 import autopy
2 autopy.mouse.move(100, 100) # 移动鼠标
3 autopy.mouse.smooth_move(400, 400) # 平滑移动鼠标(上面那个是瞬间的)
这个命令会让鼠标迅速移动到指定屏幕坐标,你知道什么是屏幕坐标的吧,左上角是(0,0),然后向右向下递增,所以1024×768屏幕的右下角坐标是……你猜对了,是(1023,767)。
不过有些不幸的,如果你实际用一下这个命令,然后用autopy.mouse.get_pos()获得一下当前坐标,发现它并不在(100,100)上,而是更小一些,比如我的机器上是(97,99),和分辨率有关。这个移动是用户了和windows中mouse_event函数,若不清楚api的,知道这回事就好了,就是这个坐标不是很精确的。像我一样很好奇的,可以去读一下autopy的源码,我发现他计算绝对坐标算法有问题: