下载镜像包
docker pull prom/node-exporter
docker pull prom/prometheus
docker pull grafana/grafana
启动node-exporter

docker run -d -p 9100:9100
  -v "/proc:/host/proc:ro"
  -v "/sys:/host/sys:ro"
  -v "/:/rootfs:ro"
  --net="host"
  prom/node-exporter
等待几秒钟,查看端口是否起来了
root@ubuntu:~# netstat -anpt
Active Internet connections (servers and established)
Proto Recv-Q Send-Q Local Address           Foreign Address         State       PID/Program name
tcp        0      0 0.0.0.0:22              0.0.0.0:*               LISTEN      1147/sshd
tcp        0     36 192.168.91.132:22       192.168.91.1:63648      ESTABLISHED 2969/0
tcp        0      0 192.168.91.132:22       192.168.91.1:63340      ESTABLISHED 1321/1
tcp6       0      0 :::9100                 :::*                    LISTEN      3070/node_exporter
访问url:
http://IP:9100/metrics
效果如下:
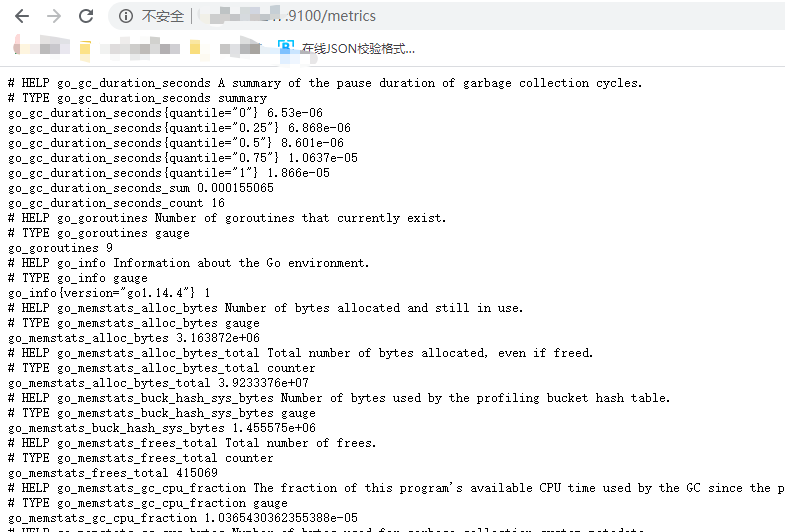
这些都是收集到数据,有了它就可以做数据展示了
启动prometheus
新建目录prometheus,编辑配置文件prometheus.yml
mkdir /opt/prometheus
cd /opt/prometheus/
vim prometheus.yml
内容如下:
global:
  scrape_interval:     60s
  evaluation_interval: 60s

scrape_configs:
  - job_name: prometheus
    static_configs:
      - targets: ['localhost:9090']
        labels:
          instance: prometheus

  - job_name: linux
    static_configs:
      - targets: ['IP:9100']
        labels:
          instance: localhost
注意:修改IP地址,这里的IP就是本机地址
启动prometheus
docker run  -d
  -p 9090:9090
  -v /opt/prometheus/prometheus.yml:/etc/prometheus/prometheus.yml
 --net='host'
  prom/prometheus
等待几秒钟,查看端口状态
root@ubuntu:/opt/prometheus# netstat -anpt
Active Internet connections (servers and established)
Proto Recv-Q Send-Q Local Address           Foreign Address         State       PID/Program name
tcp        0      0 0.0.0.0:22              0.0.0.0:*               LISTEN      1147/sshd
tcp        0     36 192.168.91.132:22       192.168.91.1:63648      ESTABLISHED 2969/0
tcp        0      0 192.168.91.132:22       192.168.91.1:63340      ESTABLISHED 1321/1
tcp6       0      0 :::9100                 :::*                    LISTEN      3070/node_exporter
tcp6       0      0 :::22                   :::*                    LISTEN      1147/sshd
tcp6       0      0 :::9090                 :::*                    LISTEN      3336/docker-proxy
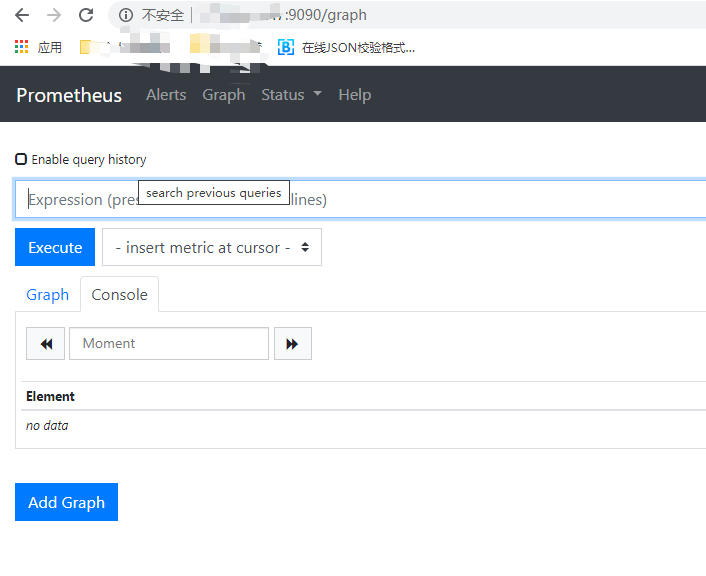
访问url:
http://ip:9090/graph
效果如下:
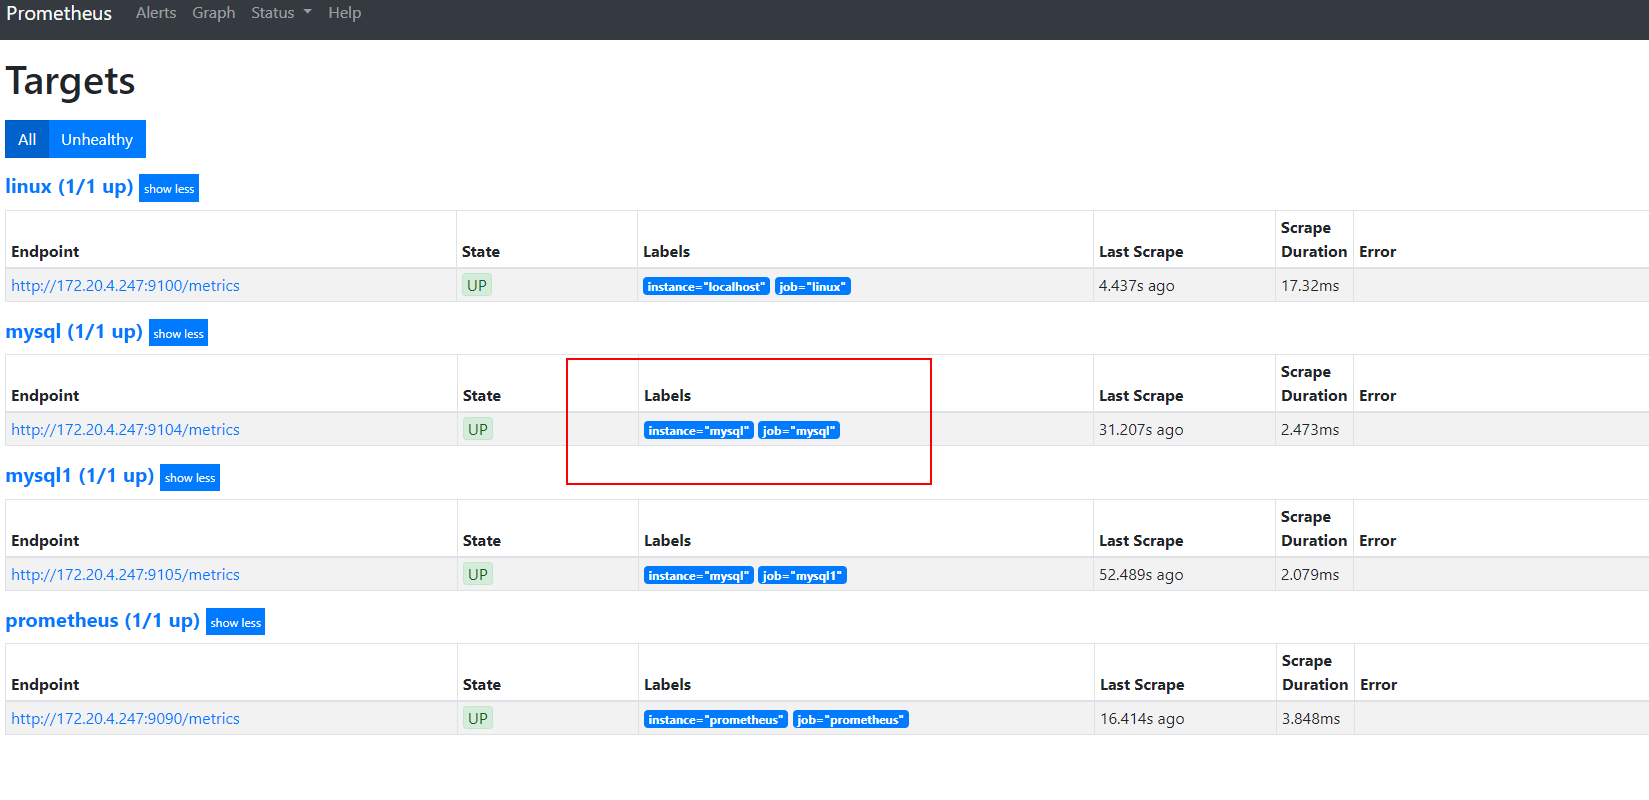
访问targets,url如下:
http://IP:9090/targets
效果如下:
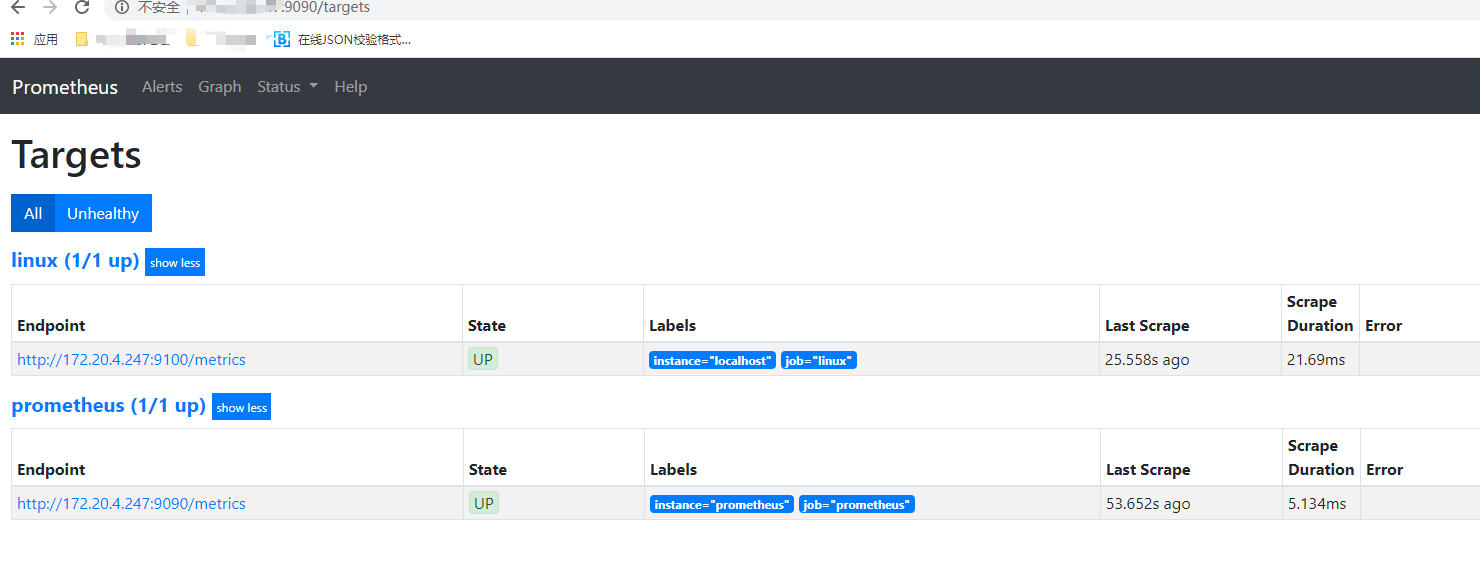
如果状态没有UP起来,等待一会,就会UP了
启动grafana
新建空文件夹grafana-storage,用来存储数据
mkdir /opt/grafana-storage
设置权限
chmod 777 -R /opt/grafana-storage
因为grafana用户会在这个目录写入文件,直接设置777,比较简单粗暴!
启动grafana
docker run -d
  -p 3000:3000
  --name=grafana
  -v /opt/grafana-storage:/var/lib/grafana
 --net='host'
  grafana/grafana
等待几秒钟,查看端口状态
root@ubuntu:/opt/prometheus# netstat -anpt
Active Internet connections (servers and established)
Proto Recv-Q Send-Q Local Address           Foreign Address         State       PID/Program name
tcp        0      0 0.0.0.0:22              0.0.0.0:*               LISTEN      1147/sshd
tcp        0     36 192.168.91.132:22       192.168.91.1:63648      ESTABLISHED 2969/0
tcp        0      0 192.168.91.132:22       192.168.91.1:63340      ESTABLISHED 1321/1
tcp6       0      0 :::9100                 :::*                    LISTEN      3070/node_exporter
tcp6       0      0 :::22                   :::*                    LISTEN      1147/sshd
tcp6       0      0 :::3000                 :::*                    LISTEN      3494/docker-proxy
tcp6       0      0 :::9090                 :::*                    LISTEN      3336/docker-proxy
tcp6       0      0 192.168.91.132:9100     172.17.0.2:55108        ESTABLISHED 3070/node_exporter
访问url:
http://IP:3000/
默认会先跳转到登录页面,默认的用户名和密码都是admin


接下来监控mysql
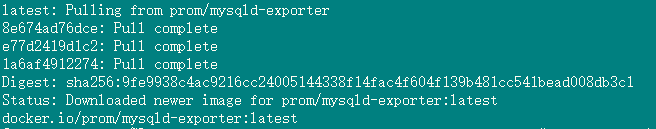
下载镜像
docker pull prom/mysqld-exporter
启动监控的数据库连接,容器创建的时候需要指定
docker run -d -p 9104:9104 -e DATA_SOURCE_NAME="root:password@(127.0.0.1:3306)/databaseName" prom/mysqld-exporter

然后要在prometheus的配置文件prometheus.yml中添加响应配置信息
- job_name: mysql
static_configs:
- targets: ['172.20.4.247:9104'] #将localhost改为本机IP
labels:
instance: mysql

注意缩进,你可以复制上上边的改一下就好
可以了!