1.自由绘制地图网站——geojson.io

这张图是使用删除的时候选中的对象,可以一次删除多个,删除线条的时候要注意指针变成这个样子才是选中。


压缩geoJson的网站——mapshaper
本文所用的geoJson如下


// drawMap.geoJson
{
  "type": "FeatureCollection",
  "features": [
    {
      "type": "Feature",
      "properties": {
        "stroke": "#555555",
        "stroke-width": 2,
        "stroke-opacity": 1,
        "fill": "#555555",
        "fill-opacity": 0.5,
        "name": "君怜",
        "cp": 111
      },
      "geometry": {
        "type": "Polygon",
        "coordinates": [
          [
            [
              110.302734375,
              21.53484700204879
            ],
            [
              114.23583984374999,
              21.53484700204879
            ],
            [
              114.23583984374999,
              25.18505888358067
            ],
            [
              110.302734375,
              25.18505888358067
            ],
            [
              110.302734375,
              21.53484700204879
            ]
          ]
        ]
      }
    },
    {
      "type": "Feature",
      "properties": {
        "stroke": "#555555",
        "stroke-width": 2,
        "stroke-opacity": 1,
        "fill": "#d3557b",
        "fill-opacity": 0.5,
        "name": "天晓",
        "cp": 666
      },
      "geometry": {
        "type": "Polygon",
        "coordinates": [
          [
            [
              112.06054687499999,
              25.423431426334222
            ],
            [
              114.08203125,
              25.423431426334222
            ],
            [
              114.08203125,
              25.720735134412106
            ],
            [
              112.06054687499999,
              25.720735134412106
            ],
            [
              112.06054687499999,
              25.423431426334222
            ]
          ]
        ]
      }
    },
    {
      "type": "Feature",
      "properties": {
        "stroke": "#555555",
        "stroke-width": 2,
        "stroke-opacity": 1,
        "fill": "#3fab82",
        "fill-opacity": 0.5,
        "name": "明珠",
        "cp": 890
      },
      "geometry": {
        "type": "Polygon",
        "coordinates": [
          [
            [
              111.84562683105469,
              25.435833800555567
            ],
            [
              112.00355529785156,
              25.435833800555567
            ],
            [
              112.00355529785156,
              25.7188792818747
            ],
            [
              111.84562683105469,
              25.7188792818747
            ],
            [
              111.84562683105469,
              25.435833800555567
            ]
          ]
        ]
      }
    }
  ]
}

2.Echarts的geo地理坐标系组件
目前能显示对应区域颜色

 1  // DrawMap
 2         let geoJson = "http://localhost:8080/static/drawMap.geoJson";
 3
 4         $.get(geoJson, (res) => {
 5           var mapData = res;
 6           echarts.registerMap("xiamen", mapData);
 7           var centerMap = [];
 8           let mapColor = [];
 9           console.log("mapData", mapData);
10           if (mapData && mapData.features && mapData.features.length > 0) {
11             for (var i = 0; i < mapData.features.length; i++) {
12               var feature = mapData.features[i];
13               var properties = feature.properties || {};
14               if (properties && properties.name) {
15                 centerMap.push({
16                   name: properties.name,
17                   value: properties.cp,
18                 });
19                 mapColor.push(properties.fill);
20                 //   centerMap[properties.name] = properties.cp || [];
21               }
22             }
23           }
24           console.log("centerMap:", centerMap, "
mapColor", mapColor);
25
26           var option = {
27             // backgroundColor: "#fff",
28             title: {
29               text: "厦门市",
30             },
31             geo: [
32               {
33                 map: "xiamen", // need equal register
34                 nameProperty: "name",
35                 // 数据点中的 name:Alabama 会关联到 GeoJSON 中 NAME 属性值为 Alabama 的地理要素
36                 //{"type":"Feature","id":"01","properties":{"NAME":"Alabama"}, "geometry": { ... }}
37                 data: centerMap,
38                 regions: [
39                   {
40                     name: "君怜", //区块名称
41                     itemStyle: {
42                       color: mapColor[0],
43                     },
44                   },
45                   {
46                     name: "天晓", //区块名称
47                     itemStyle: {
48                       areaColor: mapColor[1],
49                     },
50                   },
51                   {
52                     name: "明珠", //区块名称
53                     itemStyle: {
54                       areaColor: mapColor[2],
55                     },
56                   },
57                 ],
58               },
59             ],
60             tooltip: {
61               trigger: "item",
62               formatter: "{b}<br/>{c}",
63             },
64           };
65           this.myChart.setOption(option);
3.Echarts的series.map
能够根据数据量大小显示对应颜色
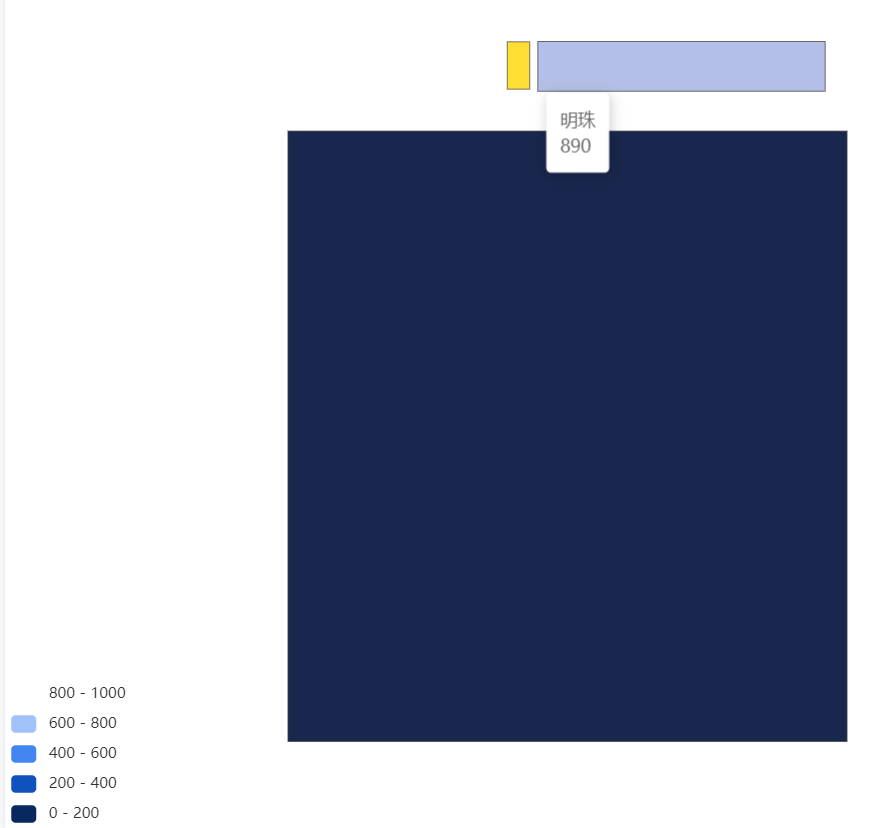
 1  drawMap() {
 2       if (
 3         this.myChart != null &&
 4         this.myChart != "" &&
 5         this.myChart != undefined
 6       ) {
 7         this.myChart.dispose();
 8       }
 9       this.$nextTick(() => {
10         this.myChart = echarts.init(document.getElementById("mapTest"));
11         // HuaiAn
12         // let geoJson = "http://localhost:8080/static/mapHuaiAn.geoJson";
13         // XiaMen
14         // let geoJson = "http://localhost:8080/static/mapXiaMen.geoJson";
15         // DrawMap
16         let geoJson = "http://localhost:8080/static/drawMap.geoJson";
17         // let geoJson =
18         //   "https://geo.datav.aliyun.com/areas_v3/bound/350200_full.json";
19         //   "https://geo.datav.aliyun.com/areas_v3/bound/geojson?code=350200_full";
20         // var uploadedDataURL = "/asset/get/s/data-1628045698067-F_q-w3jYq.json";
21
22         $.get(geoJson, (res) => {
23           var mapData = res;
24           echarts.registerMap("xiamen", mapData);
25           var centerMap = [];
26           let mapColor = [];
27           console.log("mapData", mapData);
28           if (mapData && mapData.features && mapData.features.length > 0) {
29             for (var i = 0; i < mapData.features.length; i++) {
30               var feature = mapData.features[i];
31               var properties = feature.properties || {};
32               if (properties && properties.name) {
33                 centerMap.push({
34                   name: properties.name,
35                   value: properties.cp,
36                 });
37                 mapColor.push(properties.fill);
38                 //   centerMap[properties.name] = properties.cp || [];
39               }
40             }
41           }
42           console.log("centerMap:", centerMap, "
mapColor", mapColor);
43
44           var option = {
45             // backgroundColor: "#fff",
46             title: {
47               text: "厦门市",
48             },
49             visualMap: {
50               type: "piecewise",
51               show: true,
52               min: 0,
53               max: 1000,
54               inRange: {
55                   // color from the map
56                 colorLightness: [0.2, 1],
57               },
58             },
59             tooltip: {
60               show: true,
61               trigger: "item",
62               formatter: "{b}<br/>{c}",
63             },
64             series: [
65               {
66                 name: "xiamen",
67                 type: "map",
68                 nameProperty: "name",
69                 map: "xiamen", // need equal register
70                 aspectScale: 0.85,
71                 // data: centerMap,
72                 data: [
73                   { name: "君怜", value: 111 },
74                   { name: "天晓", value: 666 },
75                   { name: "明珠", value: 890 },
76                 ],
77               },
78             ],
79           };
80           this.myChart.setOption(option);
81         });
82       });
83     },
关于visualMap的使用,菜鸟教程讲的不错——ECharts 数据的视觉映射 | 菜鸟教程 (runoob.com)
4.地图选择器 (aliyun.com)
使用注意:点击空白可以返回上一级区域
