Metricbeat(集群日志收集)
https://www.elastic.co/guide/en/beats/metricbeat/current/running-on-kubernetes.html
metric-server(top 指令数据源)
kubectl apply -f https://github.com/kubernetes-sigs/metrics-server/releases/latest/download/components.yaml
ingress(nginx)
kubectl apply -f https://raw.githubusercontent.com/kubernetes/ingress-nginx/controller-v1.1.1/deploy/static/provider/cloud/deploy.yaml
  externalTrafficPolicy: Local
  默认情况下ingress 开启了这个选项 为了保证nginx 能接收到client真实ip 这一项默认打开。但是会造成pod 如果为分布在此节点那直接访问主机ip 进行的转发链条为空造成 SYNSEND 状态持续
ip-masq-agent(管理nat 出网规则)
kubectl apply -f https://raw.githubusercontent.com/kubernetes-sigs/ip-masq-agent/master/ip-masq-agent.yaml
如果你的网络模式已经确认 pod 地址段通过bgp模式 或者 switch路由方式已经发布到集群外主机,可以将主机网络的nat masquery 屏蔽 通过以下方式
cat ip-masq-agent-config
nonMasqueradeCIDRs:
  - 10.160.105.0/24
resyncInterval: 60s
root@us-test00:~# kubectl create configmap ip-masq-agent --from-file=ip-masq-agent-config --namespace=kube-system
iptables -t nat -nvL |grep -i agent
2157 136K IP-MASQ-AGENT all -- * * 0.0.0.0/0 0.0.0.0/0 /* ip-masq-agent: ensure nat POSTROUTING directs all non-LOCAL destination traffic to our custom IP-MASQ-AGENT chain */ ADDRTYPE match dst-type !LOCAL
Chain IP-MASQ-AGENT (1 references)
0 0 RETURN all -- * * 0.0.0.0/0 169.254.0.0/16 /* ip-masq-agent: cluster-local traffic should not be subject to MASQUERADE */ ADDRTYPE match dst-type !LOCAL
3 230 RETURN all -- * * 0.0.0.0/0 10.160.105.0/24 /* ip-masq-agent: cluster-local traffic should not be subject to MASQUERADE */ ADDRTYPE match dst-type !LOCAL
2 120 MASQUERADE all -- * * 0.0.0.0/0 0.0.0.0/0 /* ip-masq-agent: outbound traffic should be subject to MASQUERADE (this match must come after cluster-local CIDR matches) */ ADDRTYPE match dst-type !LOCAL
nodelocal dns
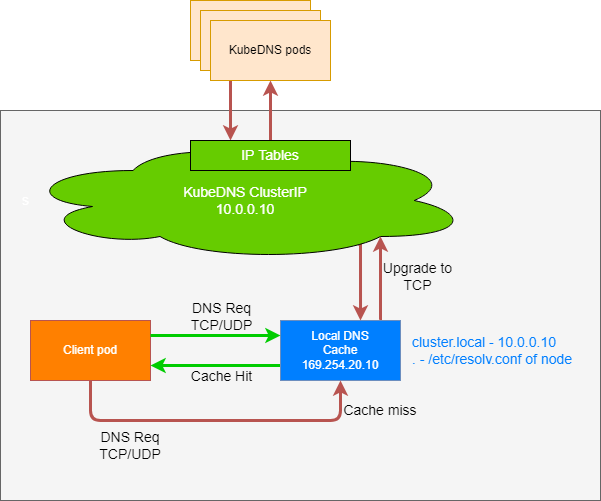
安装这一层dns 代理后 能解决pod解析常见问题:
1. contract nat 表满由于dns 请求量过大
2. 解决域名解析故障,如core dns 位于 CN,而pod 可能位于US 这样导致解析的部分A记录不可用
#安装方式
1. 下载yml 文件
https://github.com/kubernetes/kubernetes/blob/master/cluster/addons/dns/nodelocaldns/nodelocaldns.yaml
2. 修改yml 文件
选择一合适的本地回环地址来监听
说明: NodeLocal DNSCache 的本地侦听 IP 地址可以是任何地址,只要该地址不和你的集群里现有的 IP 地址发生冲突。 推荐使用本地范围内的地址,例如,IPv4 链路本地区段 169.254.0.0/16 内的地址, 或者 IPv6 唯一本地地址区段 fd00::/8 内的地址。
这里选择 169.254.100.100
kubedns=kubectl get svc kube-dns -n kube-system -o jsonpath={.spec.clusterIP}

domain=xlqforever.com

localdns=169.254.100.100

#ipvs 和 iptables 的替换模式不一致,这里用的是ipvs 模式
sed -i "s/__PILLAR__LOCAL__DNS__/$localdns/g; s/__PILLAR__DNS__DOMAIN__/$domain/g; s/__PILLAR__DNS__SERVER__//g; s/__PILLAR__CLUSTER__DNS__/$kubedns/g" nodelocaldns.yaml
如果 kube-proxy 运行在 IPVS 模式,需要修改 kubelet 的 --cluster-dns 参数为 NodeLocal DNSCache 正在侦听的 <node-local-address> 地址。 否则,不需要修改 --cluster-dns 参数,因为 NodeLocal DNSCache 会同时侦听 kube-dns 服务的 IP 地址和 <node-local-address> 的地址
promethues 监控
https://github.com/prometheus-community/helm-charts/tree/main/charts/kube-prometheus-stack
promethues-operator 已经被收录到社区,目前推荐使用helm 来安装和升级prometheus
helm repo add prometheus-community https://prometheus-community.github.io/helm-charts
helm repo update

# value 文件妥善保管,合理修改其中呢 pv设置和ingress 配置。

helm install prod-prom prometheus-community/kube-prometheus-stack  -f promethues_value.yml  -n prom
helm update prod-prom prometheus-community/kube-prometheus-stack  -f promethues_value.yml  -n prom
自定义监控:
https://github.com/prometheus-operator/prometheus-operator/blob/main/Documentation/user-guides/getting-started.md