1. Download the following three software:
- download zend-eclipse-php-helios-win32-x86.zip from http://www.zend.com/community/pdt
- download ZendOptimizer-3.3.3-Windows-i386.exe from http://www.zend.com/downloads/
- download ZendDebugger-20100729-cygwin_nt-i386.zip from http://www.zend.com/en/products/studio/downloads
2. unzip the zend-eclipse-php-helios-win32-x86.zip to eclipse folder.
3. install the ZendOptimizer, during the process, you need to:
- point php executives to PHP installation folder where the php.ini locations, for example, (XAMPP_HOME\php)
- point apache installtion folder to XAMPP_HOME\apache.
- after ZendOptimizer has been installed, these two lines will be appended to php.ini file.
-
-
zend_extension_manager.optimizer_ts="C:\Program Files\Zend\ZendOptimizer-3.3.0\lib\Optimizer-3.3.0"
-
zend_extension_ts="C:\Program Files\Zend\ZendOptimizer-3.3.0\lib\ZendExtensionManager.dll"
-
4. unzip the ZendDebugger-20100729-cygwin_nt-i386.zip to temporary folder. verify your php version by starting your xampp and see the phpinfo() page. (for example, mine is 5.2.9)
- create “zendDebugger” folder under “XAMPP_HOME/php” fodler.
- create another folder “php-5.2.x” under “zendDebugger” as the php version is 5.2.9
- find the zendDebugger.dll file from the the unzipped folder according to your php version, such as “5_2_x_comp” as php version is 5.2.9, copy it to “php-5.2.x” folder.
- copy the dummy.php file from the unzipped folder to the document root of your XAMPP server.
- add these three lines to php.ini file and append to “Zend location”.
- zend_extension_manager.debug_server_ts=C:\dev\Ultilities\xampp\1.7.1\xampp\php\zendDebugger
- zend_debugger.allow_hosts=127.0.0.1
- zend_debugger.expose_remotely=always
- restart your apache server, you will see the zend debugger is installed.

5. to configure the eclipse to use zend debug. go to Windows –> Preference –> PHP –> Debug –> PHP serve.
- enter “http://localhost” for field “enter url point to document root of your server”.
- click the “path Mapping tab”, enter your local filepath for your project file and select the path from your workspace.
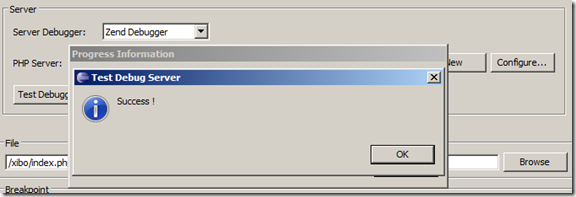
- select any php page, go to Debug-> Debug Configurations-> new Configuration. click the “test zend debugger” button, result will show:
