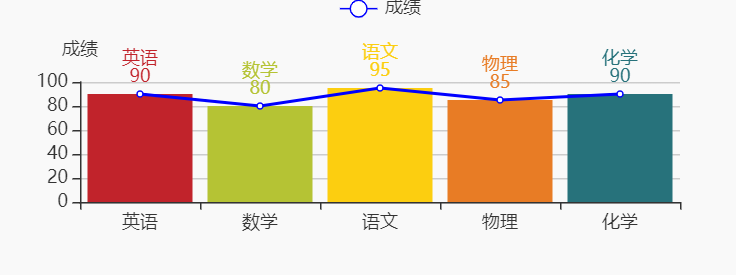
function BarChart(elementId){
     //初始化echarts实例
      var myChart = echarts.init(document.getElementById(elementId));
     // 指定图表的配置项和数据
        var option = {
            title: {
                text: ''
            },
            tooltip: {
                 axisPointer : {            // 坐标轴指示器,坐标轴触发有效
             type : 'shadow'   // 默认为直线,可选为:'line' | 'shadow'
          }
            },
            legend: {
                data:['成绩']
            },
            xAxis: {
                data: ["英语","数学","语文","物理","化学"],
                //interval :10
            },
            yAxis: {
                 type : 'value',
                 name:'成绩',
                 min: 0,
                 max: 100,
            },
            series: [{
                name: '成绩',
                type: 'line',
                color: 'blue',
                data: [90, 80, 95, 85, 90]
            },
            {
                name: '成绩',
                type: 'bar',
                 itemStyle: {
                    normal: {
                        color: function(params) {
                            var colorList = [
                              '#C1232B','#B5C334','#FCCE10','#E87C25','#27727B'
                            ];
                            return colorList[params.dataIndex]
                        },
        //以下为是否显示,显示位置和显示格式的设置了
                        label: {
                            show: true,
                            position: 'top',
                            formatter: '{b}
{c}'
                        }
                    }
                },
                barWidth:70,
                data: [90, 80, 95, 85, 90]
            }
            ]
        }
        myChart.clear();
    myChart.setOption(option,true);
     }
BarChart("domId")
