canvas绘制柱状图
1、HTML
 1 <!DOCTYPE html>
 2 <html lang="en">
 3 <head>
 4     <meta charset="UTF-8">
 5     <meta name="viewport" content="width=device-width, initial-scale=1.0, user-scalable=no">
 6     <title>06柱状图面向对象版本</title>
 7     <style>
 8         body {
 9             padding: 0;
10             margin: 0;
11             background-color: #f0f0f0;
12             overflow: hidden;
13         }
14     </style>
15     <script src="bower_components/konva/konva.min.js"></script>
16     <script src="js/HistogramChart.js"></script>
17
18 </head>
19 <body>
20     <div id="container">
21     </div>
22
23     <script>
24         //创建舞台
25         var stage = new Konva.Stage({
26             container: 'container',
27              window.innerWidth,//全屏
28             height: window.innerHeight
29         });
30
31         //创建层
32         var layer = new Konva.Layer();
33         stage.add(layer);
34
35         //中心点坐标
36         var cenX = stage.width() / 2;
37         var cenY = stage.height() / 2;
38
39         //柱状图的数据
40         var data = [
41             { name: '前端', value: '.8', color: 'green'},
42             { name: 'PHP', value: '.3', color: 'blue'},
43             { name: 'Java', value: '.7', color: 'red'},
44             { name: 'UI', value: '.9', color: 'orange'},
45             { name: 'IOS', value: '.4', color: 'purple'},
46             { name: 'Android', value: '.9', color: 'pink'}
47         ];
48
49
50         var h  = new HistogramChart({
51             x: 1/8 * stage.width(),
52             y: 3/4 * stage.height(),
53             w: 3/4 * stage.width(),
54             h: 1/2 * stage.height(),
55             data: data
56         });
57
58         h.addToGroupOrLayer( layer );
59
60         layer.draw();
61
62         stage.on('contentClick', function(){
63             h.playAnimate();
64         });
65
66
67     </script>
68
69
70 </body>
71 </html>
2、HistogramChart.js
  1 // Histogram:柱状图的意思 英 ['hɪstəgræm]  美 ['hɪstəɡræm]
  2 function HistogramChart( option ) {
  3     // zzt
  4     this._init( option );
  5     // JQJB:警情级别
  6 }
  7
  8 HistogramChart.prototype = {
  9     _init: function( option ) {
 10         this.x = option.x || 0;
 11         this.y = option.y || 0; //柱状图的原点坐标
 12         this.w = option.w || 0; //柱状图的总宽度
 13         this.h = option.h || 0; //柱状图高度
 14
 15         this.data = option.data || [];
 16
 17         var x0 = 0;
 18         var y0 = 0;
 19
 20         // 柱状图中所有的元素的组
 21         this.group = new Konva.Group({
 22             x: this.x,
 23             y: this.y
 24         });
 25
 26         //放矩形的组
 27         this.rectGroup = new Konva.Group({
 28             x: 0,
 29             y: 0
 30         });
 31         this.group.add( this.rectGroup );
 32
 33         //添加一个放百分比文字的组
 34         this.textPercentGroup = new Konva.Group({
 35             x: 0,
 36             y: 0
 37         });
 38         this.group.add( this.textPercentGroup );
 39
 40         //初始化底线
 41         var bsLine = new Konva.Line({
 42             //x:从 1/8 x,  3/4
 43             //y: 3/4 高度处
 44             points: [x0,y0, x0+this.w, y0], //要求 底线按照画布的左上角顶点进行定位。
 45             strokeWidth: 1,
 46             stroke: 'lightgreen',
 47         });
 48
 49         this.group.add( bsLine );
 50
 51         var rectWidth = this.w / this.data.length; //每个矩形占用的总宽度
 52         var height = this.h;
 53
 54
 55         var self = this;// 当前柱状图的对象
 56         //初始化 矩形
 57         //初始化 文字%
 58         //初始化 底部文字
 59         this.data.forEach(function(item, index) {// item:数组中元素,index是索引值
 60             //生成一个矩形
 61             var rect = new Konva.Rect({
 62                 x: x0 + (1/4 + index ) * rectWidth,//
 63                 y: y0 - item.value * height,
 64                  1/2 * rectWidth,
 65                 height: item.value * height,
 66                 fill: item.color,
 67                 opacity: .8,         //设置透明度
 68                 cornerRadius: 10,     //设置圆角
 69                 shadowBlur: 10,          //设置阴影的模糊级别
 70                 shadowColor: 'black',//设置阴影的颜色
 71                 // shadowOffsetX: 4, //设置阴影的X偏移量
 72                 // shadowOffsetY: 4     //设置应用的Y偏移量
 73             });
 74             self.rectGroup.add( rect );
 75
 76             //把百分比的文字放到 柱状图的顶部
 77             var text = new Konva.Text({
 78                 x: x0 + (index ) * rectWidth,//
 79                 y: y0 - item.value * height - 14,
 80                 fontSize: 14,
 81                 text: item.value * 100 + '%',
 82                 fill: item.color,
 83                  rectWidth,// 配合让文字居中
 84                 align: 'center',  //
 85                 name: 'textPercent'  //设置文字的name后,可以通过类选择器进行选取。
 86             });
 87             self.textPercentGroup.add( text );
 88
 89             //把百分比的文字放到 柱状图的顶部
 90             var textBottom = new Konva.Text({
 91                 x: x0 + (1/4 + index ) * rectWidth,//
 92                 y: y0,
 93                 fontSize: 14,
 94                 text: item.name,
 95                 fill: item.color,
 96                 //  rectWidth,// 配合让文字居中
 97                 // align: 'center',  //
 98                 rotation: 30
 99             });
100             self.group.add( textBottom );
101         });
102     },
103     addToGroupOrLayer: function( arg ) {
104         arg.add( this.group );
105     },
106     playAnimate: function() {
107         var self = this;
108         // 让柱状图 y→ y0  height:0
109         this.rectGroup.getChildren().each(function(item, index){
110             item.y(0);
111             item.height(0);
112             //经过一个动画还原
113             item.to({
114                 duration: 1,
115                 y: - self.data[index].value * self.h,
116                 height: self.data[index].value * self.h
117             });
118         });
119         //让文字有个动画
120         this.textPercentGroup.getChildren().each(function( item, index ){
121             item.y(-14);
122             item.to({
123                 duration: 1,
124                 y: - self.data[index].value * self.h -14
125             });
126         });
127     }
128 }
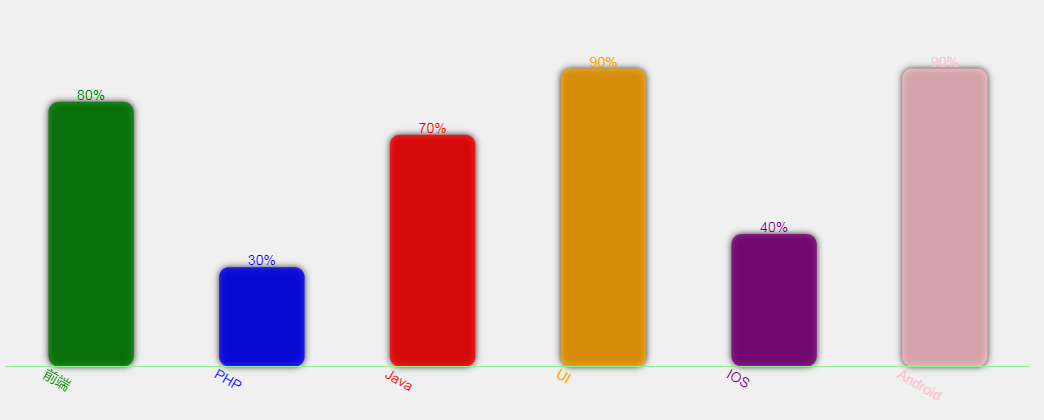
运行效果: