ELK是三个开源软件的缩写,分别表示:Elasticsearch , Logstash, Kibana , 它们都是开源软件。
以上三款软件依赖jdk1.8,请自行安装,不再赘述。
废话不多说,直接开始安装,此次使用版本
Logstash:7.17.1 (https://artifacts.elastic.co/downloads/logstash/logstash-7.17.1-linux-x86_64.tar.gz)
Elasticsearch:7.17.1 (https://artifacts.elastic.co/downloads/elasticsearch/elasticsearch-7.17.1-linux-x86_64.tar.gz)
Kibana:7.17.1 (https://artifacts.elastic.co/downloads/kibana/kibana-7.17.1-linux-x86_64.tar.gz)
一、下载软件安装包至/usr/local下,并依次解压
cd /usr/local

wget https://artifacts.elastic.co/downloads/elasticsearch/elasticsearch-7.17.1-linux-x86_64.tar.gz
wget https://artifacts.elastic.co/downloads/logstash/logstash-7.17.1-linux-x86_64.tar.gz
wget https://artifacts.elastic.co/downloads/kibana/kibana-7.17.1-linux-x86_64.tar.gz

tar -zxvf elasticsearch-7.17.1-linux-x86_64.tar.gz
tar -zxvf logstash-7.17.1-linux-x86_64.tar.gz
tar -zxvf kibana-7.17.1-linux-x86_64.tar.gz
二、安装Elasticsearch(Logstash和Kibana都需要配置其地址,故优先安装)
1、因Elasticsearch、Kibana不支持用root启动,故新建用户elk,并将Elasticsearch所在文件夹的属组和属主都赋权给elk,并切换用户至elk
useradd elk
chown -R elk:elk elasticsearch-7.17.1
su elk
2、在config中修改elasticsearch.yml
ingest.geoip.downloader.enabled: false
xpack.security.enabled: true
xpack.security.authc.api_key.enabled: true
xpack.security.transport.ssl.enabled: true
cluster.name: es-cluster
node.name: node-1
path.data: /usr/local/elasticsearch-7.17.1/data  ##此data文件夹默认无,需要用elk用户创建
path.logs: /usr/local/elasticsearch-7.17.1/logs
bootstrap.memory_lock: false
network.host: 0.0.0.0
http.port: 9200
http.cors.enabled: true
http.cors.allow-origin: "*"
cluster.initial_master_nodes: ["node-1"]
3、在bin目录下启动Elasticsearch。初始搭建建议前台启动,能随时看到错误。调试无误后后台启动命令 ./elasticsearch -d
[elk@data-anal bin]$ ./elasticsearch
出现如下报错,原因为每个进城同时打开的文件数太小

退回至root用户,使用root用户修改/etc/security/limits.conf,添加如下内容,此文件修改完成后需退出用户重新登录
* soft nofile 65536
* hard nofile 65536
出现如下报错,原因为
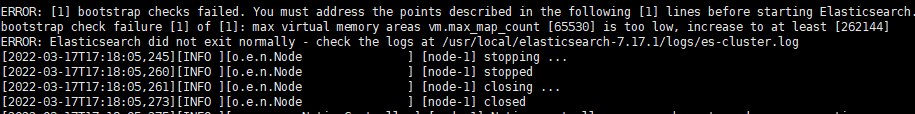
使用root用户修改 /etc/sysctl.conf ,添加如下内容
vm.max_map_count=262144

/sbin/sysctl -p  #执行此命令立即生效
重新切换回elk用户重新启动
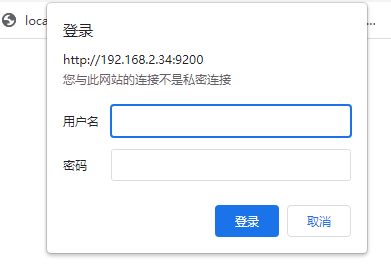
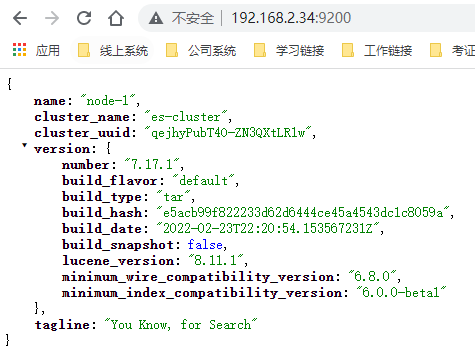
4、启动成功后使用其端口访问http://192.168.2.34:9200,显示如下,此时需要设置ELK相关用户密码。
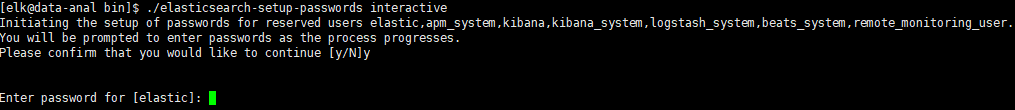
5、在bin目录下,出现如图下所示,依次设置密码即可!
[elk@data-anal bin]$ ./elasticsearch-setup-passwords interactive
6、在浏览其中输入账号(elastic)密码,出现如下图,则安装成功。
三、安装Logstash(在需要收集日志的服务器)
1、使用root用户编辑
cd /usr/local/logstash-7.17.1
vim config/logstash.yml
2、修改如下内容
node.name: logstash-node-1
path.data: /usr/local/logstash-7.17.1/data
config.reload.automatic: true
config.reload.interval: 3s
3、在config下创建日志收集配置文件
cp logstash-sample.conf logstash.conf
4、添加如下内容
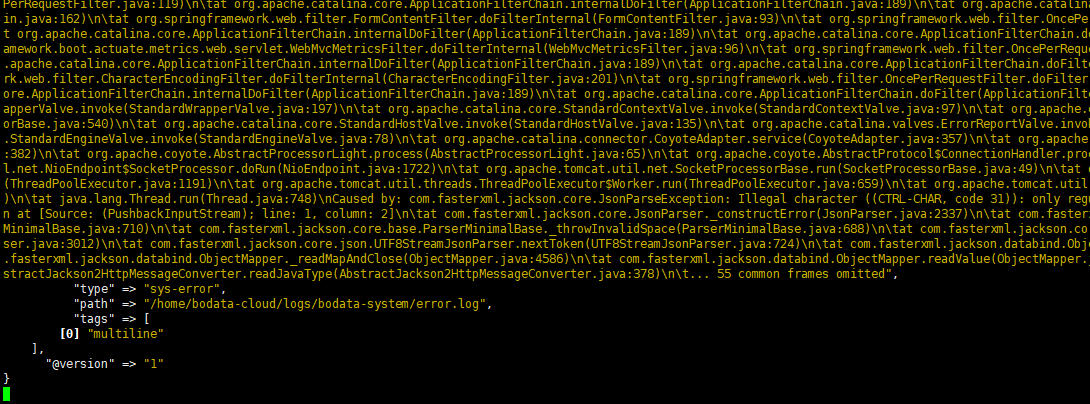
input {
  file {
    path => "/home/bodata-cloud/logs/bodata-mediation/*.log"
        start_position => beginning
        sincedb_path => "/dev/null"
        codec => multiline {
          pattern => "^\d{4}-\d{2}-\d{2} \d{2}:\d{2}:\d{2}"
          negate => true
          auto_flush_interval => 3
          what => previous
        }
  }
 file {
    path => "/home/bodata-cloud/logs/bodata-system/*.log"
        start_position => beginning
        sincedb_path => "/dev/null"
        codec => multiline {
          pattern => "^\d{4}-\d{2}-\d{2} \d{2}:\d{2}:\d{2}"
          negate => true
          auto_flush_interval => 3
          what => previous
        }
  }
}
filter {
  if [path] =~ "info" {
    mutate { replace => { type => "sys-info" } }
    grok {
      match => { "message" => "%{COMBINEDAPACHELOG}" }
    }
    date {
      match => [ "timestamp" , "dd/MMM/yyyy:HH:mm:ss Z" ]
    }
  } else if [path] =~ "error" {
    mutate { replace => { type => "sys-error" } }
  } else {
    mutate { replace => { type => "random_logs" } }
  }
}
output {
  elasticsearch {
    hosts => '192.168.2.34:9200'
    user  => 'elastic'
    password => 'Spgtest_1'
  }
  stdout { codec => rubydebug }
}
5、启动Logstash,这里启动较慢,出现如下图所示,表示启动成功。后台启动
./logstash -f ../config/logstash.conf

6、启动成功后,Logstash就会将监听的文件内容发送至 Elasticsearch
四、安装Kibana(elk用户)
1、因 Kibana 不允许用root用户启动,先设置Kibana所在文件夹属主与属组,再切换至elk用户,
chown -R elk:elk /usr/local/kibana-7.17.1-linux-x86_64
su elk
2、修改kibana.yml
cd /usr/local/kibana-7.17.1-linux-x86_64
vim config/kibana.yml
3、修改如下内容
server.port: 5601
server.host: "0.0.0.0"
elasticsearch.hosts: ["http://192.168.2.34:9200"]
kibana.index: ".kibana"
elasticsearch.username: "kibana_system"
elasticsearch.password: "changeme"
i18n.locale: "zh-CN"
4、启动 kibana,后台启动 nohup ./kibana &
[elk@data-anal bin]$ ./kibana
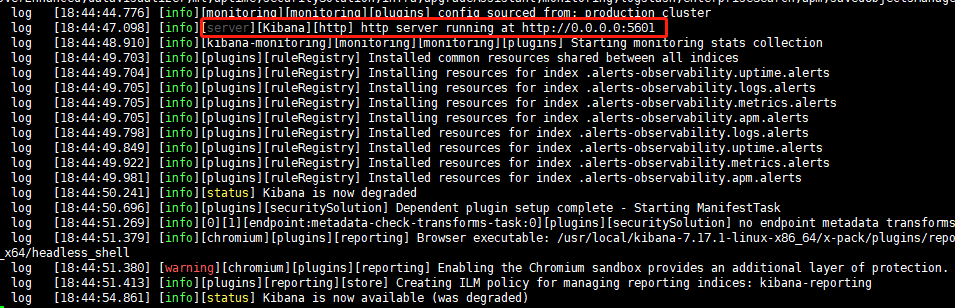
5、通过http://192.168.2.34:5601访问kibana服务,出现如下图则 Kibana 安装成功。
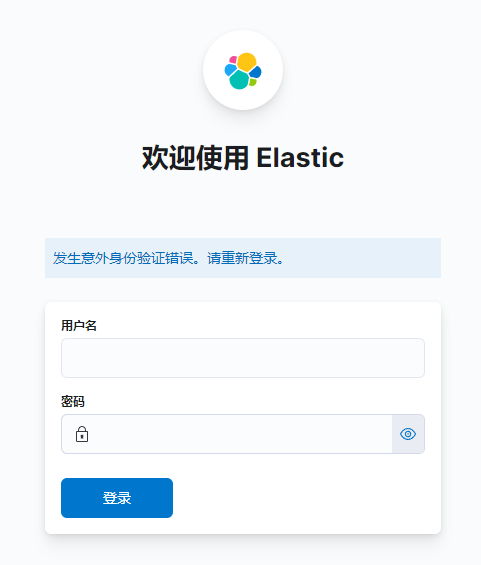
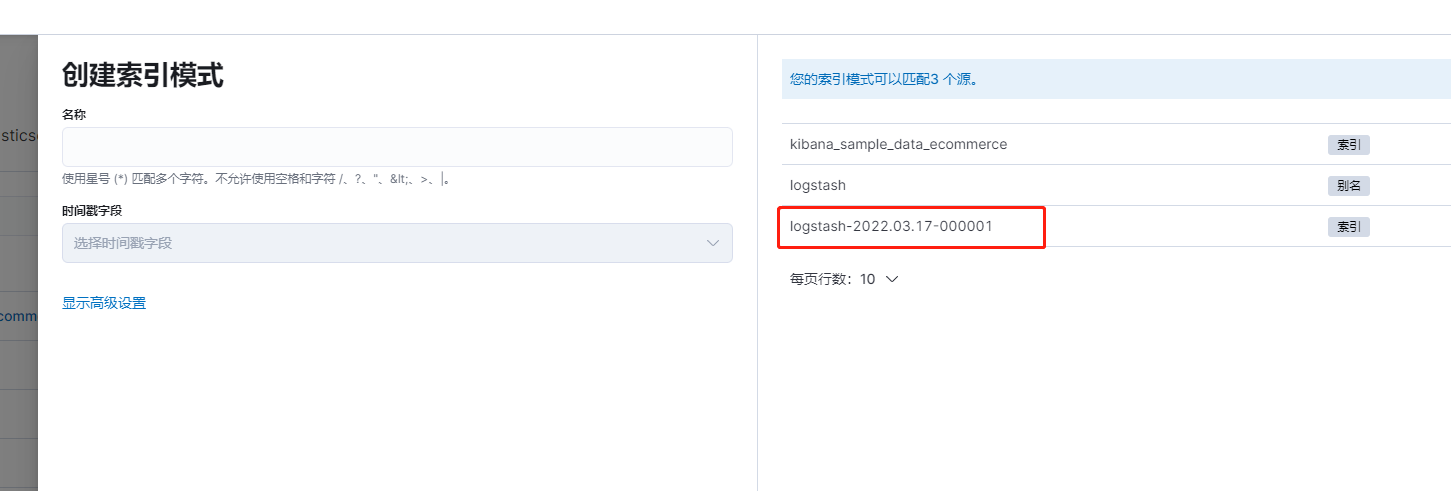
6、使用elastic+密码登录后,添加集成
Management -> Stack Management -> 索引模式 -> 添加集成 -> 搜索 Elasticsearch -> 添加 Elasticsearch
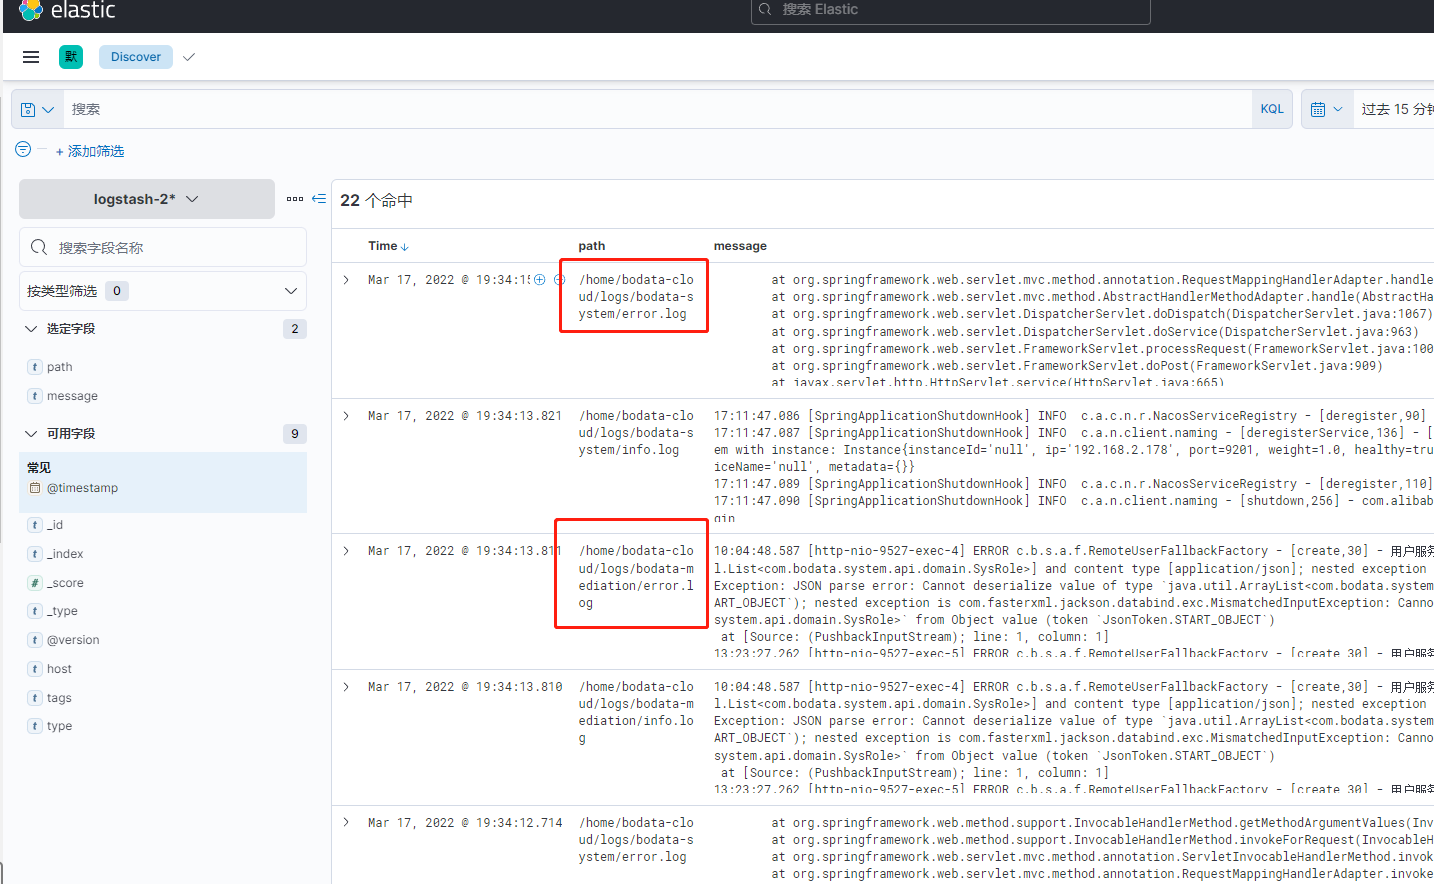
7、创建索引,此条数据源即为从Logstash收集的日志信息存储到了 Elasticsearch 上。
8、创建完索引,即可在Analytics -> Discover 中查看日志信息