最近埋头苦读,啃机器学习的算法和编程,真是非(xiang)常(dang)欢(lan)乐(sou)呢~ 于是开始自我膨胀跃跃欲试。
嗯,那就从Kaggle的playground开始吧,找了个经典而又浪漫的爱情故事—泰坦尼克,应该能引起我的兴趣好好挖掘吧~
"You jump! I jump! ",『Jack and Rose』的故事想必大家都很熟悉。爱情故事很动人,但是泰坦尼克号在与冰山相撞后沉没后,2224名乘客中有1502人死亡。尽管幸存者有一些运气因素,但是是否获救其实并非随机,而是基于一些背景有rank先后的,比如女人,孩子和上流社会。在这个挑战中,我们需要根据乘客的个人信息和存活情况,运用机器学习工具来预测哪些乘客在悲剧中幸存下来。这是一个典型的二分类问题。
Titanic: Machine Learning from Disaster
1. 首先从整体观察数据情况
- 可用
.info(),.describe()查看数据的基本信息和统计特征
#-*- coding: utf-8 -*-
import numpy as np
import pandas as pd
from pandas import DataFrame,Series
data_train = pd.read_csv("train.csv")    #读取训练数据
data_train.columns                       #展示数据数据的表头
data_train.info()
data_train.describe()
<class 'pandas.core.frame.DataFrame'>
RangeIndex: 891 entries, 0 to 890
Data columns (total 12 columns):
PassengerId    891 non-null int64
Survived       891 non-null int64
Pclass         891 non-null int64
Name           891 non-null object
Sex            891 non-null object
Age            714 non-null float64
SibSp          891 non-null int64
Parch          891 non-null int64
Ticket         891 non-null object
Fare           891 non-null float64
Cabin          204 non-null object
Embarked       889 non-null object
dtypes: float64(2), int64(5), object(5)
memory usage: 83.6+ KB
| PassengerId | Survived | Pclass | Age | SibSp | Parch | Fare | |
|---|---|---|---|---|---|---|---|
| count | 891.000000 | 891.000000 | 891.000000 | 714.000000 | 891.000000 | 891.000000 | 891.000000 |
| mean | 446.000000 | 0.383838 | 2.308642 | 29.699118 | 0.523008 | 0.381594 | 32.204208 |
| std | 257.353842 | 0.486592 | 0.836071 | 14.526497 | 1.102743 | 0.806057 | 49.693429 |
| min | 1.000000 | 0.000000 | 1.000000 | 0.420000 | 0.000000 | 0.000000 | 0.000000 |
| 25% | 223.500000 | 0.000000 | 2.000000 | 20.125000 | 0.000000 | 0.000000 | 7.910400 |
| 50% | 446.000000 | 0.000000 | 3.000000 | 28.000000 | 0.000000 | 0.000000 | 14.454200 |
| 75% | 668.500000 | 1.000000 | 3.000000 | 38.000000 | 1.000000 | 0.000000 | 31.000000 |
| max | 891.000000 | 1.000000 | 3.000000 | 80.000000 | 8.000000 | 6.000000 | 512.329200 |
我们可以看到数据中大概有以下这些字段
PassengerId => 乘客ID
Pclass => 乘客舱级(1/2/3等舱位)
Name => 乘客姓名
Sex => 性别
Age => 年龄
SibSp => 堂兄弟/妹个数
Parch => 父母与小孩个数
Ticket => 船票信息
Fare => 票价
Cabin => 舱位编号
Embarked => 登船港口(3个港口)
Survived => 幸存情况(1为幸存)
其中,我们可以观察到
- 乘客舱级,性别,登船港口,幸存情况,堂兄妹个数、父母与小孩个数是离散属性
- 年龄,票价为连续值属性
- 乘客ID, 乘客姓名,船票信息,舱位编号等属性具有唯一值
- 年龄、舱位编号 有缺失值
2. 数据可视化,分析属性特征
可做数据分析的图标类型有:
- 线型图
- 柱形图
- 直方图
- 散点图
- 密度图
- 箱型图
其中:
- 离散属性,可用柱状图观察属性每种类别的分布情况
- 年龄,票价为连续值属性,可用散点、线性或者密度图来描述分布情况
- 堂兄妹个数、父母与小孩个数, 可试验
- 乘客ID, 乘客姓名,船票信息,舱位编号等信息,可找源数据观察数据特征,价值有待挖掘
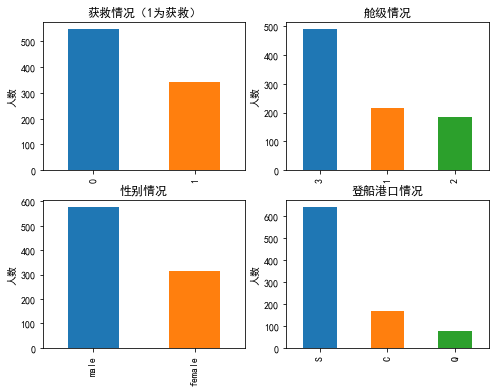
首先分析几个离散属性本身的特征情况
#coding:utf-8
import matplotlib.pyplot as plt
plt.rc('figure',figsize=(8,6))
plt.rcParams['font.sans-serif']=['SimHei'] #用来正常显示中文标签
plt.rcParams['axes.unicode_minus']=False #用来正常显示负号
fig = plt.figure()
fig.set(alpha=0.2)  # 设定图表颜色alpha参数

fig.add_subplot(2,2,1)
data_train.Survived.value_counts().plot(kind="bar")
plt.ylabel(u"人数")
plt.title(u"获救情况(1为获救)")

fig.add_subplot(2,2,2)
data_train.Pclass.value_counts().plot(kind="bar")
plt.ylabel(u"人数")
plt.title(u"舱级情况")

fig.add_subplot(2,2,3)
data_train.Sex.value_counts().plot(kind="bar")
plt.ylabel(u"人数")
plt.title(u"性别情况")

fig.add_subplot(2,2,4)
data_train.Embarked.value_counts().plot(kind="bar")
plt.ylabel(u"人数")
plt.title(u"登船港口情况")
Text(0.5,1,'登船港口情况')

由上图可以得到以下信息:
- 三个舱位人数: 3级 > 1级 > 2级 ,3级的人数基本是其他两个舱级总和。
- 获救人数大概只有30%
- 乘客中男性比例大于女性
- 三个登船港口人数:S > C > G ,其中S 登船港口人数最多
分析离散属性与最终目标值的关系
1.不同乘客等级的获救情况
- 如图可以看出乘客等级的获救概率为: 1 > 2 > 3
Survived0=data_train.Pclass[data_train.Survived==0]
Survived1=data_train.Pclass[data_train.Survived==1]
df=DataFrame({u'不获救':Survived0.value_counts(),u'获救':Survived1.value_counts()})
df.plot(kind='bar',stacked=True)
plt.xlabel(u"乘客等级")
plt.ylabel(u"人数")
plt.title(u"各乘客等级的获救情况")
plt.show()

2.不同性别的获救情况
- 如图可以看到女性的获救概率比男性的获救概率要高
Survived0=data_train.Sex[data_train.Survived==0]
Survived1=data_train.Sex[data_train.Survived==1]
df=DataFrame({u'不获救':Survived0.value_counts(),u'获救':Survived1.value_counts()})
df.plot(kind='bar',stacked=True)
plt.xlabel(u"性别")
plt.ylabel(u"人数")
plt.title(u"不同性别的获救情况")
plt.show()

3.不同登船港口的情况
- 可以看出港口的获救情况:C>S>Q
Survived0=data_train.Embarked [data_train.Survived==0]
Survived1=data_train.Embarked [data_train.Survived==1]
df=DataFrame({u'不获救':Survived0.value_counts(),u'获救':Survived1.value_counts()})
df.plot(kind='bar',stacked=True)
plt.xlabel(u"登船港口")
plt.ylabel(u"人数")
plt.title(u"不同登船港口的获救情况")
plt.show()

分析两个连续值 年龄和票价 本身属性的特征
- 一般用直方图、密度图 (两者反应的信息是相似的)
- 如图可以看出:乘客年龄的分布主要是集中在20-40岁之间,同时,票价集中在0-50之间,由部分土豪消费较高
import pandas as pda
from pandas import DataFrame,Series
# fig,axes=plt.subplots(1,1)
fig=plt.figure()
fig.add_subplot(2,1,1)
# data_train.Age.plot(kind='kde')
data_train.Age.hist()
plt.title(u"年龄分布情况")
fig.add_subplot(2,1,2)
# data_train.Fare.plot(kind='kde')
data_train.Fare.hist()
plt.title(u"票价分布情况")
Text(0.5,1,'票价分布情况')

两个连续值与最终获救情况的关系
- 可根据最终分类将数值分为几组,比较直方图或者密度图的差异
- 可用散点图、箱型图
Survived0=data_train.Age[data_train.Survived==0]
Survived1=data_train.Age[data_train.Survived==1]
df=DataFrame({u'不获救':Survived0,u'获救':Survived1})
df.plot(kind='kde')
plt.xlabel(u"年龄")
plt.ylabel(u"核密度")
plt.title(u"不同获救情况的年龄分布密度图")
plt.show()

Survived0=data_train.Fare[data_train.Survived==0]
Survived1=data_train.Fare[data_train.Survived==1]
df=DataFrame({u'不获救':Survived0,u'获救':Survived1})
df.plot(kind='kde',xlim=[-50,400])
plt.xlabel(u"票价")
plt.ylabel(u"核密度")
plt.title(u"不同获救情况的票价分布密度图")
plt.show()

接下来可以分析组合多个属性,得到有价值的信息
首先看看有重要影响的因素——舱级,分别与年龄、票价、港口的关系
Pclass1=data_train.Age[data_train.Pclass==1]
Pclass2=data_train.Age[data_train.Pclass==2]
Pclass3=data_train.Age[data_train.Pclass==3]
df=DataFrame({u'舱级1':Pclass1,u'舱级2':Pclass2,u'舱级3':Pclass3})
df.plot(kind='kde')
plt.xlabel(u"年龄")
plt.ylabel(u"核密度")
plt.title(u"不同舱级的年龄分布密度图")
plt.show()

Pclass1=data_train.Fare[data_train.Pclass==1]
Pclass2=data_train.Fare[data_train.Pclass==2]
Pclass3=data_train.Fare[data_train.Pclass==3]
df=DataFrame({u'舱级1':Pclass1,u'舱级2':Pclass2,u'舱级3':Pclass3})
df.plot(kind='kde',xlim=[-50,400])
plt.xlabel(u"票价")
plt.ylabel(u"核密度")
plt.title(u"不同舱级的票价分布密度图")
plt.show()

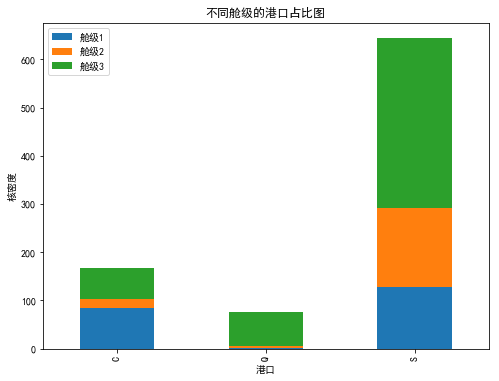
Pclass1=data_train.Embarked [data_train.Pclass==1]
Pclass2=data_train.Embarked [data_train.Pclass==2]
Pclass3=data_train.Embarked [data_train.Pclass==3]
df=DataFrame({u'舱级1':Pclass1.value_counts(),u'舱级2':Pclass2.value_counts(),u'舱级3':Pclass3.value_counts()})
df.plot(kind='bar',stacked=True)
plt.xlabel(u"港口")
plt.ylabel(u"核密度")
plt.title(u"不同舱级的港口占比图")
plt.show()

Embarked_C =data_train.Fare[data_train.Embarked =='C']
Embarked_Q =data_train.Fare[data_train.Embarked =='Q']
Embarked_S =data_train.Fare[data_train.Embarked =='S']
df=DataFrame({u'港口C':Embarked_C,u'港口Q':Embarked_Q,u'港口S':Embarked_S})
df.plot(kind='kde',xlim=[-50,400])
plt.xlabel(u"票价")
plt.ylabel(u"核密度")
plt.title(u"不同港口的票价分布图")
plt.show()

data_train.groupby(['SibSp','Survived']).count()
| PassengerId | Pclass | Name | Sex | Age | Parch | Ticket | Fare | Cabin | Embarked | ||
|---|---|---|---|---|---|---|---|---|---|---|---|
| SibSp | Survived | ||||||||||
| 0 | 0 | 398 | 398 | 398 | 398 | 296 | 398 | 398 | 398 | 49 | 398 |
| 1 | 210 | 210 | 210 | 210 | 175 | 210 | 210 | 210 | 77 | 208 | |
| 1 | 0 | 97 | 97 | 97 | 97 | 86 | 97 | 97 | 97 | 17 | 97 |
| 1 | 112 | 112 | 112 | 112 | 97 | 112 | 112 | 112 | 52 | 112 | |
| 2 | 0 | 15 | 15 | 15 | 15 | 14 | 15 | 15 | 15 | 1 | 15 |
| 1 | 13 | 13 | 13 | 13 | 11 | 13 | 13 | 13 | 5 | 13 | |
| 3 | 0 | 12 | 12 | 12 | 12 | 8 | 12 | 12 | 12 | 1 | 12 |
| 1 | 4 | 4 | 4 | 4 | 4 | 4 | 4 | 4 | 2 | 4 | |
| 4 | 0 | 15 | 15 | 15 | 15 | 15 | 15 | 15 | 15 | 0 | 15 |
| 1 | 3 | 3 | 3 | 3 | 3 | 3 | 3 | 3 | 0 | 3 | |
| 5 | 0 | 5 | 5 | 5 | 5 | 5 | 5 | 5 | 5 | 0 | 5 |
| 8 | 0 | 7 | 7 | 7 | 7 | 0 | 7 | 7 | 7 | 0 | 7 |
Survived0=data_train.SibSp[data_train.Survived==0].value_counts()   # 通过布尔索引
Survived1=data_train.SibSp[data_train.Survived==1].value_counts()
Survived1=Series(Survived1,index=Survived0.index)
Survived1=Survived1.fillna(0)
num=Survived0+Survived1
Survived_rate=Survived1/num
Survived_rate=Survived_rate.sort_index()
plt.figure()
Survived_rate.plot()
plt.xlabel(u"兄弟/妹个数")
plt.ylabel(u"存活率(%)")
plt.title(u"兄弟/妹个数对幸存率的影响")
plt.show()

data_train.groupby(['SibSp','Survived']).count()
| PassengerId | Pclass | Name | Sex | Age | Parch | Ticket | Fare | Cabin | Embarked | ||
|---|---|---|---|---|---|---|---|---|---|---|---|
| SibSp | Survived | ||||||||||
| 0 | 0 | 398 | 398 | 398 | 398 | 296 | 398 | 398 | 398 | 49 | 398 |
| 1 | 210 | 210 | 210 | 210 | 175 | 210 | 210 | 210 | 77 | 208 | |
| 1 | 0 | 97 | 97 | 97 | 97 | 86 | 97 | 97 | 97 | 17 | 97 |
| 1 | 112 | 112 | 112 | 112 | 97 | 112 | 112 | 112 | 52 | 112 | |
| 2 | 0 | 15 | 15 | 15 | 15 | 14 | 15 | 15 | 15 | 1 | 15 |
| 1 | 13 | 13 | 13 | 13 | 11 | 13 | 13 | 13 | 5 | 13 | |
| 3 | 0 | 12 | 12 | 12 | 12 | 8 | 12 | 12 | 12 | 1 | 12 |
| 1 | 4 | 4 | 4 | 4 | 4 | 4 | 4 | 4 | 2 | 4 | |
| 4 | 0 | 15 | 15 | 15 | 15 | 15 | 15 | 15 | 15 | 0 | 15 |
| 1 | 3 | 3 | 3 | 3 | 3 | 3 | 3 | 3 | 0 | 3 | |
| 5 | 0 | 5 | 5 | 5 | 5 | 5 | 5 | 5 | 5 | 0 | 5 |
| 8 | 0 | 7 | 7 | 7 | 7 | 0 | 7 | 7 | 7 | 0 | 7 |
Survived0=data_train.Parch[data_train.Survived==0].value_counts()
Survived1=data_train.Parch[data_train.Survived==1].value_counts()
Survived1=Series(Survived1,index=Survived0.index)
Survived1=Survived1.fillna(0)
num=Survived0+Survived1
Survived_rate=Survived1/num
Survived_rate=Survived_rate.sort_index()
plt.figure()
Survived_rate.plot()
plt.xlabel(u"父母/小孩个数")
plt.ylabel(u"幸存率(%)")
plt.title(u"父母/小孩对幸存率的影响")
plt.show()

Survived_noCabin=data_train.Survived[data_train.Cabin.isnull()]
Survived_haveCabin=data_train.Survived[data_train.Cabin.notnull()]
df=DataFrame({'无':Survived_noCabin.value_counts(),'有':Survived_haveCabin.value_counts()}).transpose()
df.plot(kind='bar', stacked=True)
plt.title(u"按Cabin有无看获救情况")
plt.xlabel(u"Cabin有无")
plt.ylabel(u"人数")
plt.show()

3.缺失值处理
通常遇到缺值的情况,我们会有几种常见的处理方式
- 如果缺值的样比例极高,直接舍弃,因为作为特征可能反倒带入noise,影响结果
- 如果缺值的样本适中,而该属性是离散值(比如说类目属性),那就把NaN作为一个新类别,加到类别特征中
- 如果缺值的样本适中,而该属性为连续值,有时候我们会考虑给定一个step(比如这里的age,我们可以考虑每隔2/3岁为一个步长),然后把它离散化,之后把NaN作为一个type加到属性类目中。
- 有些情况下,缺失的值个数并不是特别多,那我们也可以试着根据已有的值,使用模型拟合一下数据,补充上。
在第1步的源数据分析中,我们知道Age 和Cabin 有缺失值
其中 :
- Cabin 字段缺失太多,暂时按Cabin有无数据,将这个属性处理成Yes和No两种类
- Age 字段 通过模型拟合,补充数据
# Cabin 的缺失值填充函数
def set_Cabin_type(df):
#     df.Cabin[df.Cabin.notnull()]='YES'
#     df.Cabin[df.Cabin.isnull()]='NO'
    df.loc[(df.Cabin.notnull()),'Cabin']='YES'
    df.loc[(df.Cabin.isnull()),'Cabin']='NO'
    return df
data_train=set_Cabin_type(data_train)
# 使用 RandomForestClassifier 填补缺失的年龄属性
from sklearn.ensemble import RandomForestRegressor
def set_missing_ages(df):
    # 把已有的数值型特征取出来丢进Random Forest Regressor中,因为逻辑回归算法输入都需要数值型特征
    age_df = df[['Age','Fare', 'Parch', 'SibSp', 'Pclass']]
    age_known=age_df.loc[age_df.Age.notnull()].values   # 要用sklearn的模型,输入参数要把Series和DataFrame 转成nparray
    age_unknown=age_df.loc[age_df.Age.isnull()].values
    #将有值的年龄样本 训练数据,然后用训练好的模型用于 预测 缺失的年龄样本的值
    #训练数据的特征集合
    X=age_known[:,1:]
    #训练数据的目标
    y=age_known[:,0]

    #构建随机森林回归模型器
    rfr = RandomForestRegressor(random_state=0, n_estimators=2000, n_jobs=-1)
    # 拟合数据,训练模型
    rfr.fit(X,y)
    # 用训练好的模型 预测 有缺失值的年龄属性
    predictedAges=rfr.predict(age_unknown[:,1:])
    # 得到的预测结果,去填补缺失数据
    df.loc[df.Age.isnull(),'Age']=predictedAges
    return df,rfr

data_train,rfr=set_missing_ages(data_train)
4.类目型特征因子化
因为逻辑回归建模时,需要输入的特征都是数值型特征,我们通常会先对类目型的特征进行转化
- 当类目型特征值 与数值大小有关联关系时,比如大小S,M,L,可以映射为数值型,比如分别映射为 1,2,3。
- 当类目型特征值 仅仅表示类别,没有大小关系,则需要使用 因子化/one-hot编码,使用pandas的.get_dummies函数。
类目型特征有:Cabin、Embarked、Sex、Pclass
dummies_Cabin = pd.get_dummies(data_train.Cabin,prefix='Cabin') #ptefix 是前缀,因子花之后的字段名为 前缀_类名

dummies_Embarked = pd.get_dummies(data_train['Embarked'], prefix= 'Embarked')

dummies_Sex = pd.get_dummies(data_train['Sex'], prefix= 'Sex')

dummies_Pclass = pd.get_dummies(data_train['Pclass'], prefix= 'Pclass')

df = pd.concat([data_train, dummies_Cabin, dummies_Embarked, dummies_Sex, dummies_Pclass], axis=1) #将哑编码的内容拼接到data_train后
df.drop(['Pclass', 'Name', 'Sex', 'Ticket', 'Cabin', 'Embarked'], axis=1, inplace=True)  # 把编码前的字段删除
5.标准化和归一化
对于量纲差异太大的数值型特征,我们需要将其标准化或归一化到一个范围,不然会对建模产生很大的影响(比如逻辑回归和梯度下降)
- 其中有 preprocessing 中的MinMaxScaler类、MinMaxScaler类、Normalizer类等
需要做 scaleing的 特征有: Age、Fare
# 这里用StandardScaler类对
from sklearn.preprocessing import StandardScaler
# 创建一个定标器
scaler=StandardScaler()
# 拟合数据
#---fit和transform为两个动作,可用fit_transform 合并完成
#df['Age_Scale']=scaler.fit_transform(df.Age.values.reshape(-1,1))  # 若为单个特征,需要reshape为(-1,1)

#--但是由于test和train 需要用同一个fit出来的参数,所以需要记录fit参数,用于test数据的标准化,因此分开计算
Age_Scale_parame=scaler.fit(df.Age.values.reshape(-1,1))
#df['Age_Scale']=scaler.transform(df.Age.values.reshape(-1,1))
df['Age_Scale']=scaler.fit_transform(df.Age.values.reshape(-1,1),Age_Scale_parame)

Fare_Scale_parame=scaler.fit(df.Fare.values.reshape(-1,1))
df['Fare_Scale']=scaler.fit_transform(df.Age.values.reshape(-1,1),Fare_Scale_parame)
df.drop(['Age', 'Fare'], axis=1, inplace=True)
到这里,我们的数据预处理就结束了。
6.训练模型
接下来,我们用逻辑回归算法将训练数据进行训练模型
from sklearn.linear_model import LogisticRegression
df_train=df.filter(regex='Survived|Age_.*|SibSp|Parch|Fare_.*|Cabin_.*|Embarked_.*|Sex_.*|Pclass_.*').values #用正则表达式把需要的字段过滤出来
# 训练特征
df_train_feature=df_train[:,1:]
#训练目标
df_train_label=df_train[:,0]
#构建逻辑回归分类器
clf=LogisticRegression(C=1.0, penalty='l1', tol=1e-6)
#拟合数据
clf.fit(df_train_feature,df_train_label)
clf
LogisticRegression(C=1.0, class_weight=None, dual=False, fit_intercept=True,
          intercept_scaling=1, max_iter=100, multi_class='ovr', n_jobs=1,
          penalty='l1', random_state=None, solver='liblinear', tol=1e-06,
          verbose=0, warm_start=False)
7.测试模型
我们对测试数据 做训练数据相同的数据预处理,包括:
- 缺失值填充:Age,Cabin,Fare
- 类目特征因子化: Pclass、Sex、Cabin、Embarked
- 归一化 : Age、Fare
data_test = pd.read_csv("test.csv")
# 缺失值填充
data_test.loc[data_test.Fare.isnull(),'Fare']=0
data_test= set_Cabin_type(data_test)
age_data = data_test[['Age','Fare', 'Parch', 'SibSp', 'Pclass']]
age_test=age_data[age_data.Age.isnull()].values
# age的缺失值填充也用前训练数据 的age值fit计算的模型,所以可以直接预测
predictedAges = rfr.predict(age_test[:,1:])
data_test.loc[data_test.Age.isnull(),'Age'] = predictedAges

# 类目特征因子化
dummies_Cabin = pd.get_dummies(data_test.Cabin, prefix= 'Cabin')
dummies_Sex = pd.get_dummies(data_test.Sex, prefix= 'Sex')
dummies_Pclass = pd.get_dummies(data_test.Pclass, prefix= 'Pclass')
dummies_Embarked = pd.get_dummies(data_test.Embarked, prefix= 'Embarked')

#归一化也用训练数据fit出来的参数进行转化
data_test['Age_scaled'] = scaler.fit_transform(data_test['Age'].values.reshape(-1, 1), Age_Scale_parame)
data_test['Fare_scaled'] = scaler.fit_transform(data_test['Fare'].values.reshape(-1, 1), Fare_Scale_parame)

# 拼接处理后数据以及删除处理前数据
df_test = pd.concat([data_test, dummies_Cabin, dummies_Embarked, dummies_Sex, dummies_Pclass], axis=1)
df_test.drop(['Pclass', 'Name', 'Sex', 'Ticket', 'Cabin', 'Embarked','Age','Fare'], axis=1, inplace=True)
将测试数据 用训练数据训练出来的模型 进行预测
df_test=df_test.values
# df_test = df_test.filter(regex='Age_.*|SibSp|Parch|Fare_.*|Cabin_.*|Embarked_.*|Sex_.*|Pclass_.*')  #可用正则表达式取删选数据
predict_result=clf.predict(df_test[:,1:])
result = pd.DataFrame({'PassengerId':data_test['PassengerId'].values, 'Survived':predict_result.astype(np.int32)})
result.to_csv("logistic_regression_predictions.csv", index=False)
pd.read_csv("logistic_regression_predictions.csv")
| PassengerId | Survived | |
|---|---|---|
| 0 | 892 | 1 |
| 1 | 893 | 0 |
| 2 | 894 | 1 |
| 3 | 895 | 0 |
| 4 | 896 | 0 |
| 5 | 897 | 0 |
| 6 | 898 | 1 |
| 7 | 899 | 0 |
| 8 | 900 | 0 |
| 9 | 901 | 0 |
| 10 | 902 | 0 |
| 11 | 903 | 0 |
| 12 | 904 | 0 |
| 13 | 905 | 0 |
| 14 | 906 | 0 |
| 15 | 907 | 0 |
| 16 | 908 | 1 |
| 17 | 909 | 0 |
| 18 | 910 | 0 |
| 19 | 911 | 0 |
| 20 | 912 | 0 |
| 21 | 913 | 0 |
| 22 | 914 | 0 |
| 23 | 915 | 0 |
| 24 | 916 | 1 |
| 25 | 917 | 0 |
| 26 | 918 | 0 |
| 27 | 919 | 0 |
| 28 | 920 | 0 |
| 29 | 921 | 0 |
| ... | ... | ... |
| 388 | 1280 | 1 |
| 389 | 1281 | 0 |
| 390 | 1282 | 0 |
| 391 | 1283 | 0 |
| 392 | 1284 | 0 |
| 393 | 1285 | 0 |
| 394 | 1286 | 0 |
| 395 | 1287 | 0 |
| 396 | 1288 | 1 |
| 397 | 1289 | 0 |
| 398 | 1290 | 0 |
| 399 | 1291 | 1 |
| 400 | 1292 | 1 |
| 401 | 1293 | 0 |
| 402 | 1294 | 0 |
| 403 | 1295 | 0 |
| 404 | 1296 | 0 |
| 405 | 1297 | 0 |
| 406 | 1298 | 0 |
| 407 | 1299 | 1 |
| 408 | 1300 | 1 |
| 409 | 1301 | 0 |
| 410 | 1302 | 1 |
| 411 | 1303 | 1 |
| 412 | 1304 | 0 |
| 413 | 1305 | 0 |
| 414 | 1306 | 0 |
| 415 | 1307 | 0 |
| 416 | 1308 | 0 |
| 417 | 1309 | 0 |
418 rows × 2 columns
把预测结果提交到Kaggle官网,得到准确率为:0.76555。
没错,效果还不够理想,因为简单分析过后出的一个baseline系统,前面数据探索出来的结论还没用上呢,真正的挖掘工作现在才刚刚开始呢~~~
接下来将对模型状态进行分析,并做一系列的优化工作。
未完待续...
本文参考了来自寒小阳的github:Kaggle_Titanic,有兴趣的小伙伴可以看看。