代码:
%% ------------------------------------------------------------------------
%% Output Info about this m-file
fprintf('
***********************************************************
');
fprintf(' <DSP using MATLAB> Problem 2.14
');
banner();
%% ------------------------------------------------------------------------
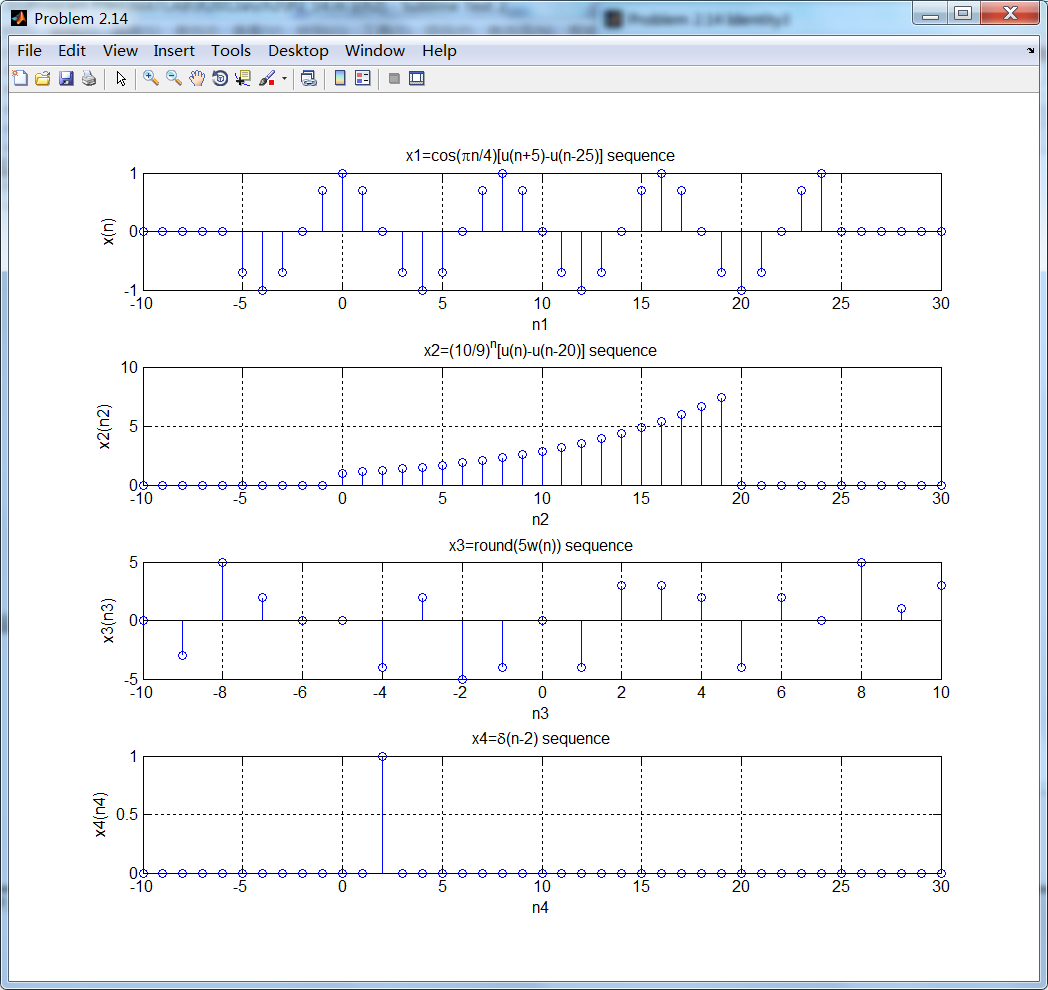
n1 = [-10:30];
x1 = cos(pi*n1/4) .* (stepseq(-5, -10, 30)-stepseq(25, -10, 30));
n2 = [-10:30];
x2 = (0.9 .^ (-n2)) .* (stepseq(0, -10, 30) - stepseq(20, -10, 30));
n3 = [-10:10];
x3 = round( 5 * (-1+2*rand(21,1)));
[x4, n4] = impseq(2, -10, 30);
figure('NumberTitle', 'off', 'Name', 'Problem 2.14')
set(gcf,'Color',[1,1,1]) % 改变坐标外围背景颜色
subplot(4,1,1); stem(n1, x1); title('x1=cos(pin/4)[u(n+5)-u(n-25)] sequence');
xlabel('n1'); ylabel('x(n)') ;
grid on
subplot(4,1,2); stem(n2, x2); title('x2=(10/9)^n[u(n)-u(n-20)] sequence');
xlabel('n2'); ylabel('x2(n2)');
grid on;
subplot(4,1,3); stem(n3, x3); title('x3=round(5w(n)) sequence');
xlabel('n3'); ylabel('x3(n3)');
grid on;
subplot(4,1,4); stem(n4, x4); title('x4=delta(n-2) sequence');
xlabel('n4'); ylabel('x4(n4)');
grid on;
%% ------------------------------------------
%% Commutation
%% ------------------------------------------
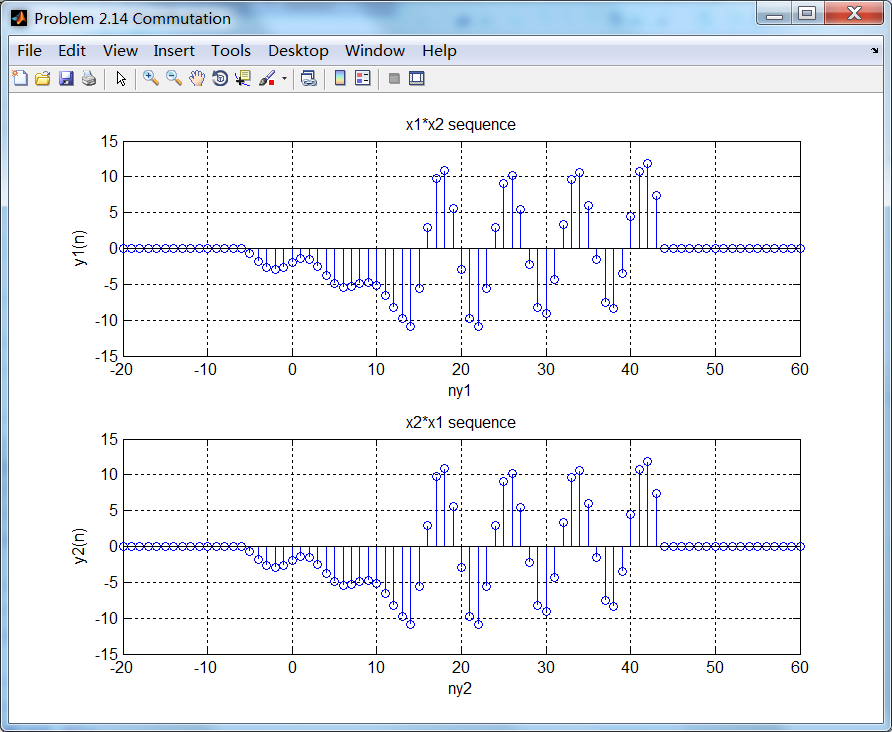
[y1, ny1] = conv_m(x1, n1, x2, n2);
[y2, ny2] = conv_m(x2, n2, x1, n1);
figure('NumberTitle', 'off', 'Name', 'Problem 2.14 Commutation')
set(gcf,'Color',[1,1,1]) % 改变坐标外围背景颜色
subplot(2,1,1); stem(ny1, y1); title('x1*x2 sequence');
xlabel('ny1'); ylabel('y1(n)') ;
grid on
subplot(2,1,2); stem(ny2, y2); title('x2*x1 sequence');
xlabel('ny2'); ylabel('y2(n)');
grid on;
%% -----------------------------------------------
%% Association
%% -----------------------------------------------
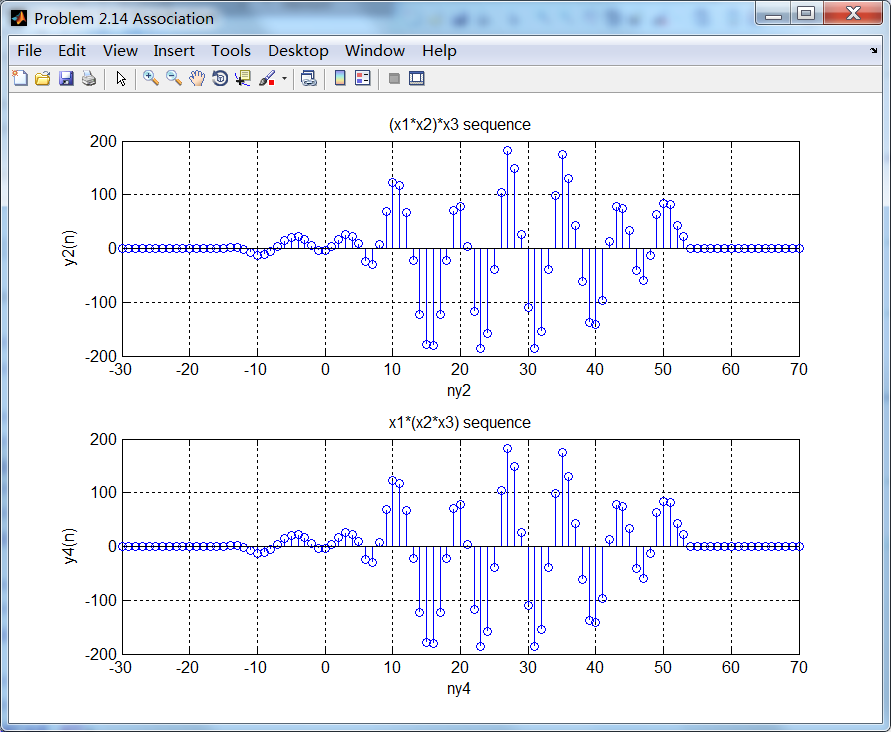
[y1, ny1] = conv_m(x1, n1, x2, n2);
[y2, ny2] = conv_m(y1, ny1, x3, n3);
[y3, ny3] = conv_m(x2, n2, x3, n3);
[y4, ny4] = conv_m(y3, ny3, x1, n1);
figure('NumberTitle', 'off', 'Name', 'Problem 2.14 Association')
set(gcf,'Color',[1,1,1]) % 改变坐标外围背景颜色
subplot(2,1,1); stem(ny2, y2); title('(x1*x2)*x3 sequence');
xlabel('ny2'); ylabel('y2(n)') ;
grid on
subplot(2,1,2); stem(ny4, y4); title('x1*(x2*x3) sequence');
xlabel('ny4'); ylabel('y4(n)');
grid on;
%% ------------------------------------------------
%% Distribution
%% ------------------------------------------------
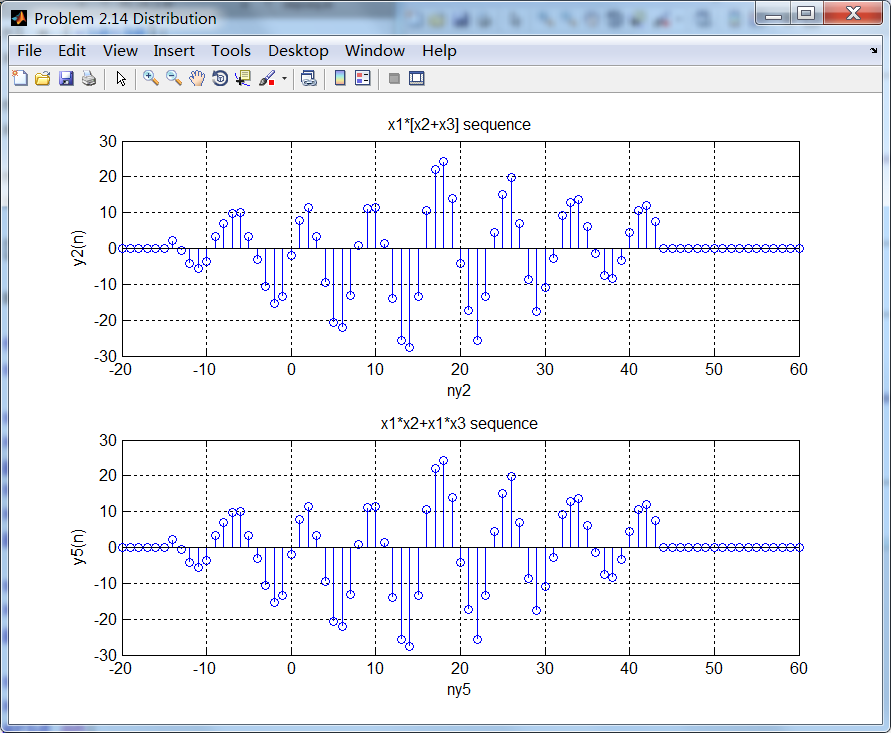
[y1, ny1] = sigadd(x2, n2, x3, n3);
[y2, ny2] = conv_m(x1, n1, y1, ny1);
[y3, ny3] = conv_m(x1, n1, x2, n2);
[y4, ny4] = conv_m(x1, n1, x3, n3);
[y5, ny5] = sigadd(y3, ny3, y4, ny4);
figure('NumberTitle', 'off', 'Name', 'Problem 2.14 Distribution')
set(gcf,'Color',[1,1,1]) % 改变坐标外围背景颜色
subplot(2,1,1); stem(ny2, y2); title('x1*[x2+x3] sequence');
xlabel('ny2'); ylabel('y2(n)') ;
grid on
subplot(2,1,2); stem(ny5, y5); title('x1*x2+x1*x3 sequence');
xlabel('ny5'); ylabel('y5(n)');
grid on;
%% -------------------------------------------------------------
%% Identity
%% -------------------------------------------------------------
[y1, ny1] = conv_m(x1, n1, x4, n4);
[y2, ny2] = sigshift(x1, n1, 2);
[y3, ny3] = conv_m(x2, n2, x4, n4);
[y4, ny4] = sigshift(x2, n2, 2);
[y5, ny5] = conv_m(x3, n3, x4, n4);
[y6, ny6] = sigshift(x3, n3, 2);
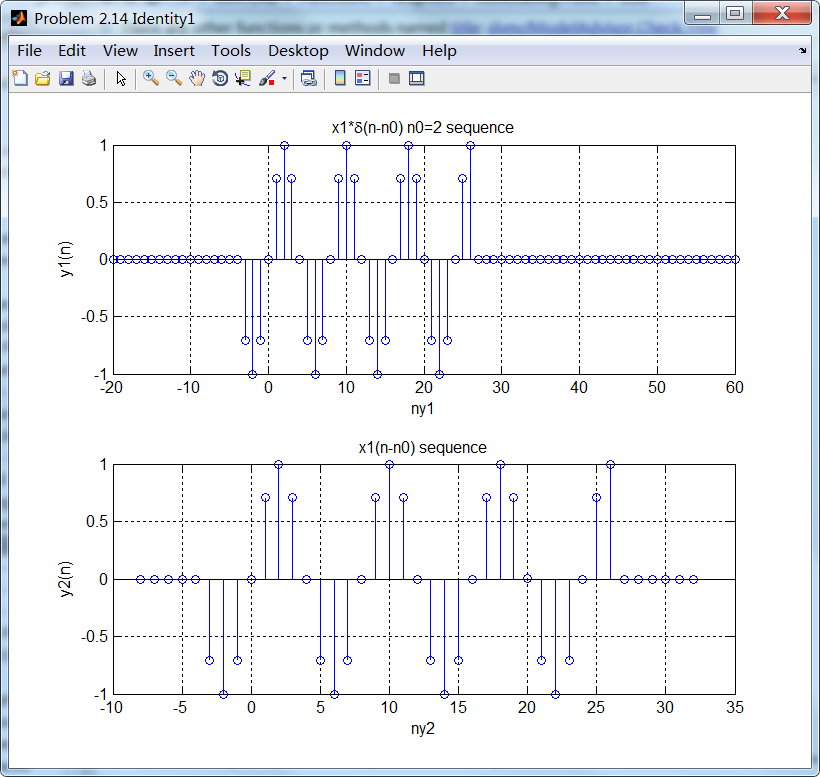
figure('NumberTitle', 'off', 'Name', 'Problem 2.14 Identity1')
set(gcf,'Color',[1,1,1]) % 改变坐标外围背景颜色
subplot(2,1,1); stem(ny1, y1); title('x1*delta(n-n0) n0=2 sequence');
xlabel('ny1'); ylabel('y1(n)') ;
grid on
subplot(2,1,2); stem(ny2, y2); title('x1(n-n0) sequence');
xlabel('ny2'); ylabel('y2(n)');
grid on;
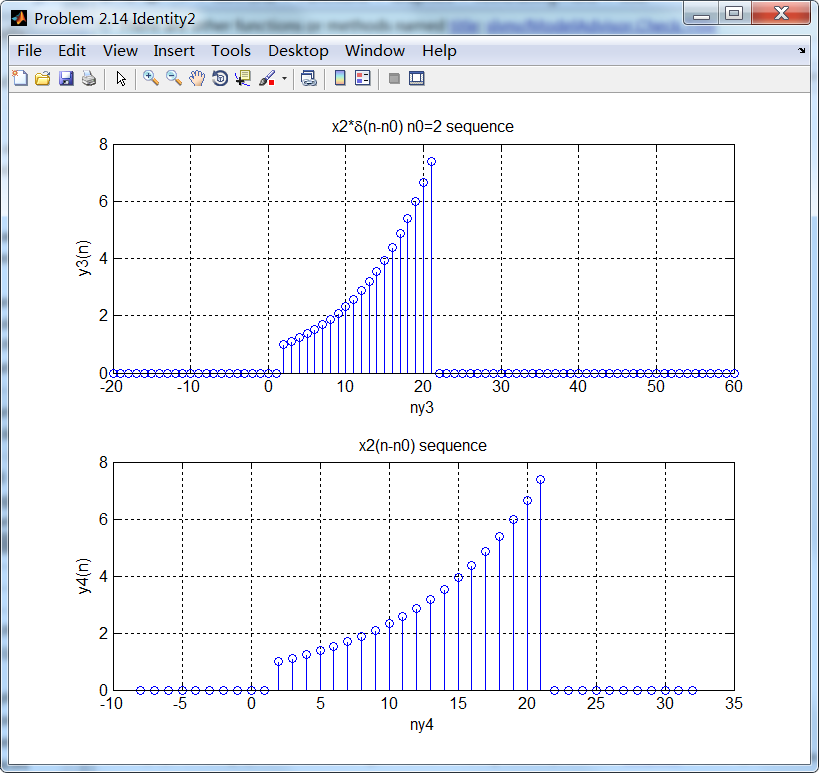
figure('NumberTitle', 'off', 'Name', 'Problem 2.14 Identity2')
set(gcf,'Color',[1,1,1]) % 改变坐标外围背景颜色
subplot(2,1,1); stem(ny3, y3); title('x2*delta(n-n0) n0=2 sequence');
xlabel('ny3'); ylabel('y3(n)') ;
grid on
subplot(2,1,2); stem(ny4, y4); title('x2(n-n0) sequence');
xlabel('ny4'); ylabel('y4(n)');
grid on;
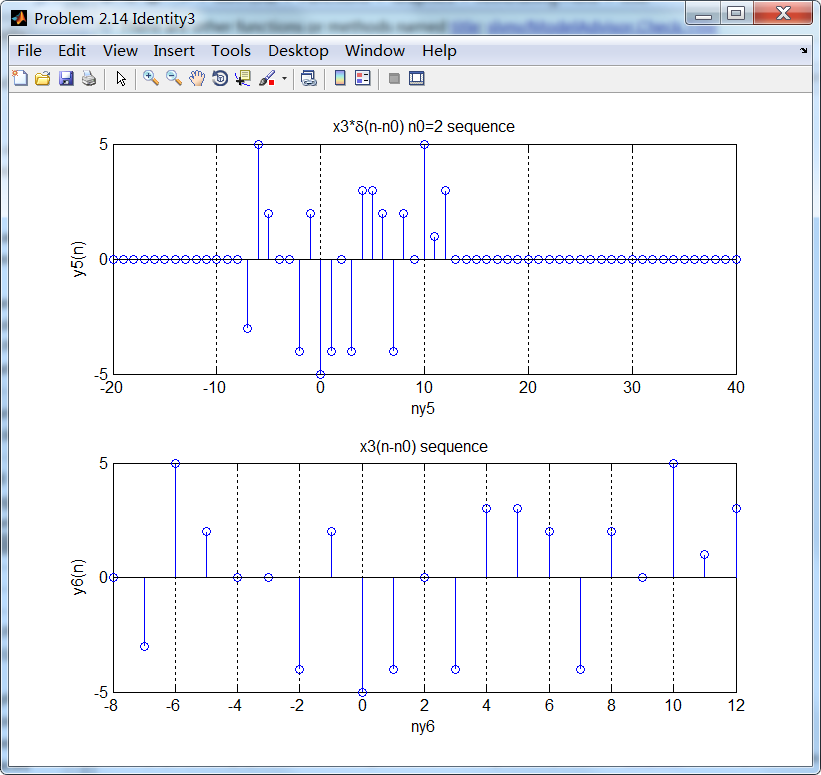
figure('NumberTitle', 'off', 'Name', 'Problem 2.14 Identity3')
set(gcf,'Color',[1,1,1]) % 改变坐标外围背景颜色
subplot(2,1,1); stem(ny5, y5); title('x3*delta(n-n0) n0=2 sequence');
xlabel('ny5'); ylabel('y5(n)') ;
grid on
subplot(2,1,2); stem(ny6, y6); title('x3(n-n0) sequence');
xlabel('ny6'); ylabel('y6(n)');
grid on;
运行结果: