代码:
%
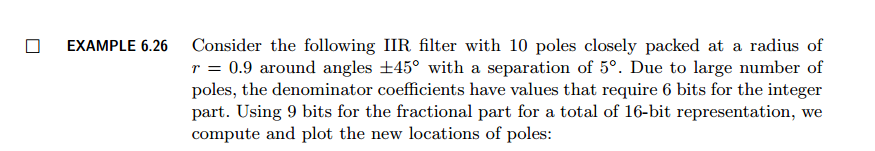
r = 0.9; theta = (pi/180)*[-55:5:-35, 35:5:55]';
p = r*exp(j*theta); a = poly(p); b = 1;
% Direct form: quantized coefficients
N = 15; [ahat, L, B] = QCoeff(a, N);
TITLE = sprintf('%i-bit (1+%i+%i) Precision', N+1, L, B);
% Comparison of Pole-Zero Plots
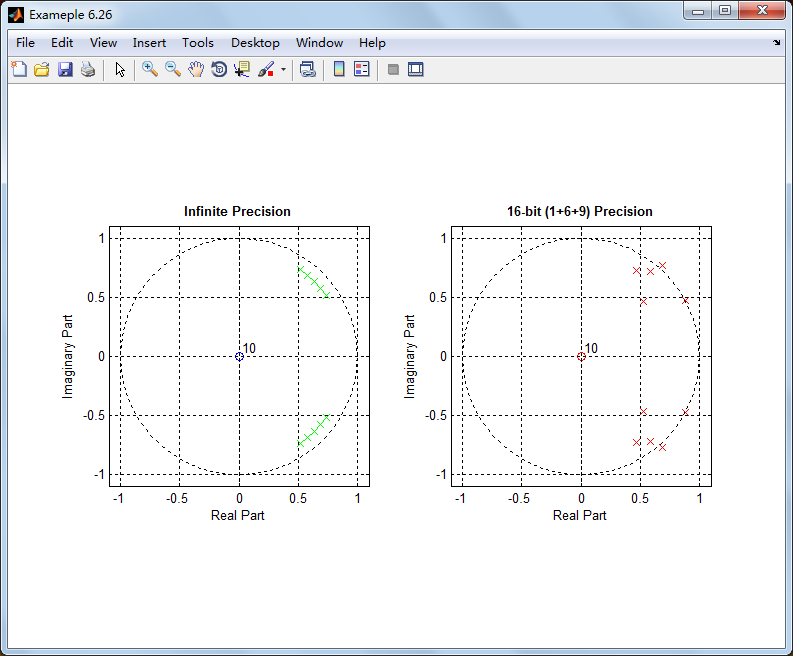
figure('NumberTitle', 'off', 'Name', 'Exameple 6.26a')
set(gcf,'Color','white');
subplot(1, 2, 1); [HZ, HP, Hl] = zplane(1, a);
set(HZ, 'color', 'g', 'linewidth', 1);
set(HP, 'color', 'g', 'linewidth', 1);
set(Hl, 'color', 'b'); axis([-1.1, 1.1, -1.1, 1.1]); grid on;
title('Infinite Precision', 'fontsize', 10, 'fontweight', 'bold');
subplot(1, 2, 2); [HZhat, HPhat, Hlhat] = zplane(1, ahat);
set(HZhat, 'color', 'r', 'linewidth', 1);
set(HPhat, 'color', 'r', 'linewidth', 1);
set(Hlhat, 'color', 'b'); axis([-1.1, 1.1, -1.1, 1.1]); grid on;
title(TITLE, 'fontsize', 10, 'fontweight', 'bold');
% Cascade form: quantized coefficients: Same N
[b0, B0, A0] = dir2cas(b, a); [BAhat1, L1, B1] = QCoeff([B0, A0], N);
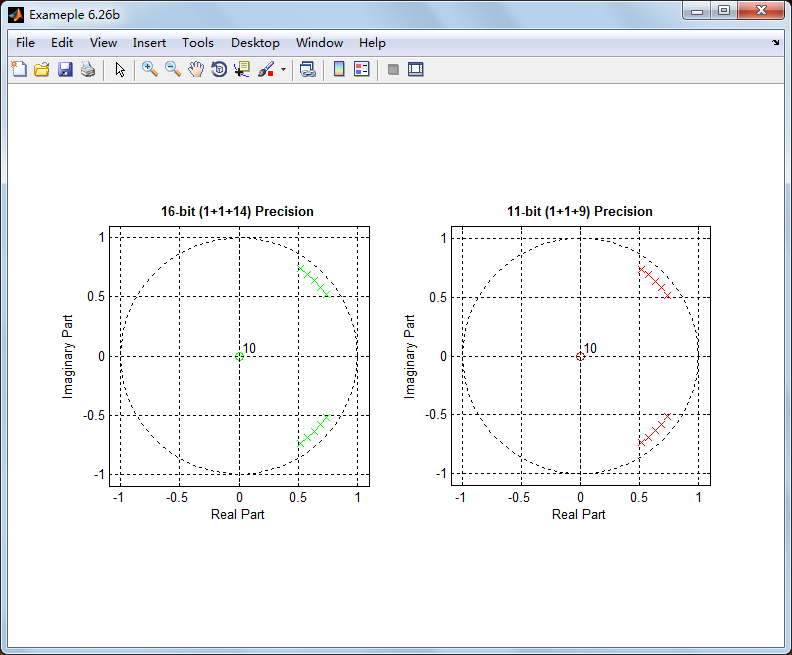
TITLE1 = sprintf('%i-bit (1+%i+%i) Precision', N+1, L1, B1);
Bhat1 = BAhat1(:, 1:3); Ahat1 = BAhat1(:, 4:6);
[bhat1, ahat1] = cas2dir(b0, Bhat1, Ahat1);
figure('NumberTitle', 'off', 'Name', 'Exameple 6.26b')
set(gcf,'Color','white');
subplot(1, 2, 1); [HZhat1, HPhat1, Hlhat1] = zplane(bhat1, ahat1);
set(HZhat1, 'color', 'g', 'linewidth', 1);
set(HPhat1, 'color', 'g', 'linewidth', 1);
set(Hlhat1, 'color', 'b'); axis([-1.1, 1.1, -1.1, 1.1]); grid on;
title(TITLE1, 'fontsize', 10, 'fontweight', 'bold');
% Cascade fomr: quantized coefficients: Same B (N=L1+B)
N1 = L1 + B; [BAhat2, L2, B2] = QCoeff([B0, A0], N1);
TITLE2 = sprintf('%i-bit (1+%i+%i) Precision', N1+1, L2, B2);
Bhat2 = BAhat2(:, 1:3); Ahat2 = BAhat2(:, 4:6);
[bhat2, ahat2] = cas2dir(b0, Bhat2, Ahat2);
subplot(1, 2, 2); [HZhat2, HPhat2, Hlhat2] = zplane(bhat2, ahat2);
set(HZhat2, 'color', 'r', 'linewidth', 1);
set(HPhat2, 'color', 'r', 'linewidth', 1);
set(Hlhat2, 'color', 'b'); axis([-1.1, 1.1, -1.1, 1.1]); grid on;
title(TITLE2, 'fontsize', 10, 'fontweight', 'bold');
结果: