代码:
b = [1, 0]; a = [1, -0.9]; %
%% ----------------------------------------------
%% START a determine H(z) and sketch
%% ----------------------------------------------
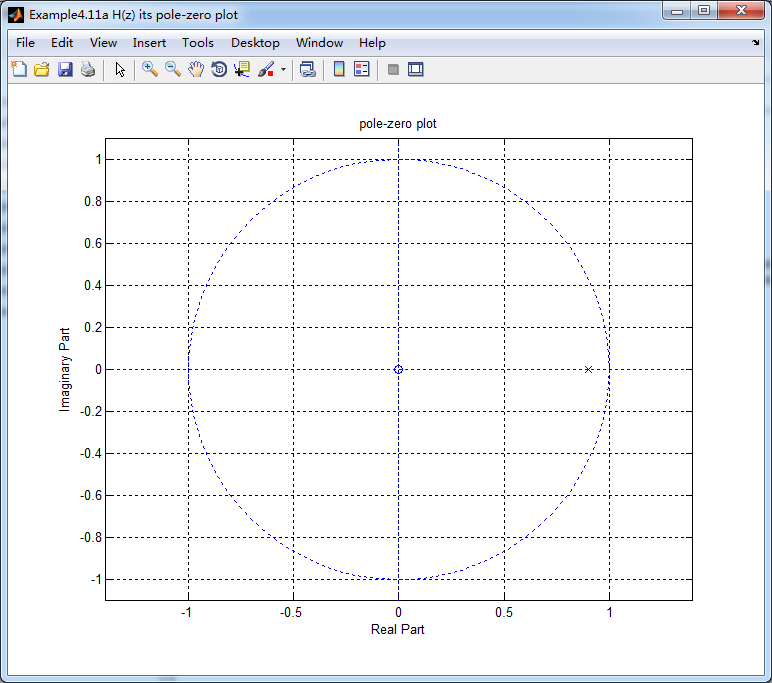
figure('NumberTitle', 'off', 'Name', 'Example4.11a H(z) its pole-zero plot')
set(gcf,'Color','white');
zplane(b,a);
title('pole-zero plot'); grid on;
%% ----------------------------------------------
%% END
%% ----------------------------------------------
%% --------------------------------------------------------------
%% START b |H| <H
%% 1st form of freqz
%% --------------------------------------------------------------
[H,w] = freqz(b,a,100); % 1st form of freqz
magH = abs(H); angH = angle(H); realH = real(H); imagH = imag(H);
%% ================================================
%% START H's mag ang real imag
%% ================================================
figure('NumberTitle', 'off', 'Name', 'Example4.11b H its mag ang real imag');
set(gcf,'Color','white');
subplot(2,2,1); plot(w/pi,magH); grid on; %axis([0,1,0,1.5]);
title('Magnitude Response');
xlabel('frequency in pi units'); ylabel('Magnitude |H|');
subplot(2,2,3); plot(w/pi, angH/pi); grid on; % axis([-1,1,-1,1]);
title('Phase Response');
xlabel('frequency in pi units'); ylabel('Radians/pi');
subplot('2,2,2'); plot(w/pi, realH); grid on;
title('Real Part');
xlabel('frequency in pi units'); ylabel('Real');
subplot('2,2,4'); plot(w/pi, imagH); grid on;
title('Imaginary Part');
xlabel('frequency in pi units'); ylabel('Imaginary');
%% ==================================================
%% END H's mag ang real imag
%% ==================================================
%% ---------------------------------------------------------------
%% END b |H| <H
%% ---------------------------------------------------------------
%% --------------------------------------------------------------
%% START b |H| <H
%% 2nd form of freqz
%% --------------------------------------------------------------
[H,w] = freqz(b,a,200,'whole'); % 2nd form of freqz
magH = abs(H(1:101)); angH = angle(H(1:101)); realH = real(H); imagH = imag(H);
%% ================================================
%% START H's mag ang real imag
%% ================================================
figure('NumberTitle', 'off', 'Name', 'Example4.11b using 2nd form freqz ');
set(gcf,'Color','white');
subplot(2,2,1); plot(w/pi,magH); grid on; %axis([0,1,0,1.5]);
title('Magnitude Response');
xlabel('frequency in pi units'); ylabel('Magnitude |H|');
subplot(2,2,3); plot(w/pi, angH/pi); grid on; % axis([-1,1,-1,1]);
title('Phase Response');
xlabel('frequency in pi units'); ylabel('Radians/pi');
subplot('2,2,2'); plot(w/pi, realH); grid on;
title('Real Part');
xlabel('frequency in pi units'); ylabel('Real');
subplot('2,2,4'); plot(w/pi, imagH); grid on;
title('Imaginary Part');
xlabel('frequency in pi units'); ylabel('Imaginary');
%% ==================================================
%% END H's mag ang real imag
%% ==================================================
%% ---------------------------------------------------------------
%% END b |H| <H
%% ---------------------------------------------------------------
%% --------------------------------------------------------------
%% START b |H| <H
%% 3rd form of freqz
%% --------------------------------------------------------------
w = [0:1:100]*pi/100; H = freqz(b,a,w);
%[H,w] = freqz(b,a,200,'whole'); % 3rd form of freqz
magH = abs(H); angH = angle(H); realH = real(H); imagH = imag(H);
%% ================================================
%% START H's mag ang real imag
%% ================================================
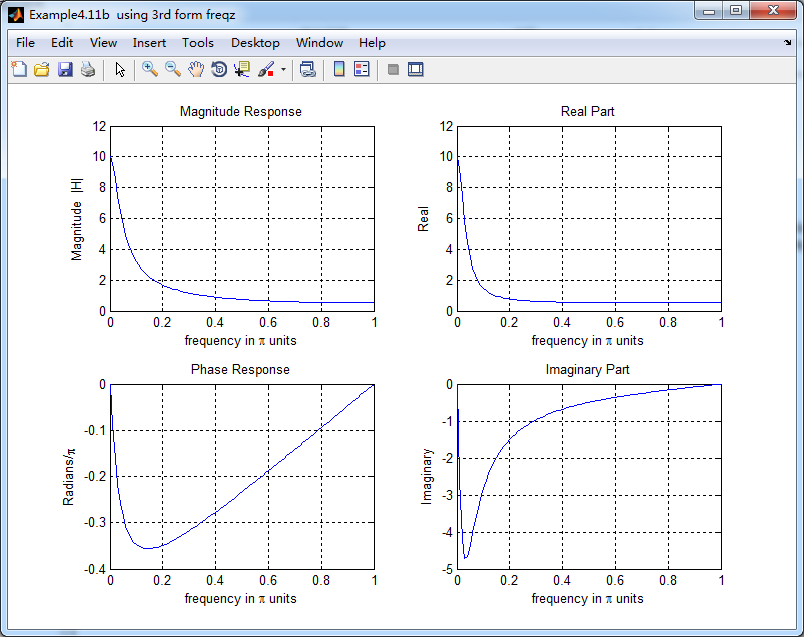
figure('NumberTitle', 'off', 'Name', 'Example4.11b using 3rd form freqz ');
set(gcf,'Color','white');
subplot(2,2,1); plot(w/pi,magH); grid on; %axis([0,1,0,1.5]);
title('Magnitude Response');
xlabel('frequency in pi units'); ylabel('Magnitude |H|');
subplot(2,2,3); plot(w/pi, angH/pi); grid on; % axis([-1,1,-1,1]);
title('Phase Response');
xlabel('frequency in pi units'); ylabel('Radians/pi');
subplot('2,2,2'); plot(w/pi, realH); grid on;
title('Real Part');
xlabel('frequency in pi units'); ylabel('Real');
subplot('2,2,4'); plot(w/pi, imagH); grid on;
title('Imaginary Part');
xlabel('frequency in pi units'); ylabel('Imaginary');
%% ==================================================
%% END H's mag ang real imag
%% ==================================================
%% ---------------------------------------------------------------
%% END b |H| <H
%% ---------------------------------------------------------------
结果: