Standard Deviation(SD) 标准(偏)差,代表变量的分散程度,离散量。统计为方差的平方根(Calculated as the root square of the variance)
sd<-sd(vec) 等同于
sd<-sqrt(var(vec))
Standard Error(SE) 标准误差,代表向量抽样分布的standard deviation .统计为SD除以样本量大小的平方根。因此,SE小于SD,当样本很大时,SE趋近于零
se=sd(vec)/sqrt(length(vec))
Confidence Interval(CI,置信区间) 定义一个区间,那么一个值在此区间内的概率,统计为t*SE。t是一个特定alpha在Student (t)分布的值。如果样本量足够大,值接近1.96,与样本量有关。如果样本量很大或分布不正态,使用boostrap方法(计算机程序)统计CI更合适。
alpha=0.05
t=qt((1-alpha)/2+.5,length(vec)-1) #qt(p,df,ncp,lower.tail=TRUE,log.p=FALSE)
CI=t*se
如:
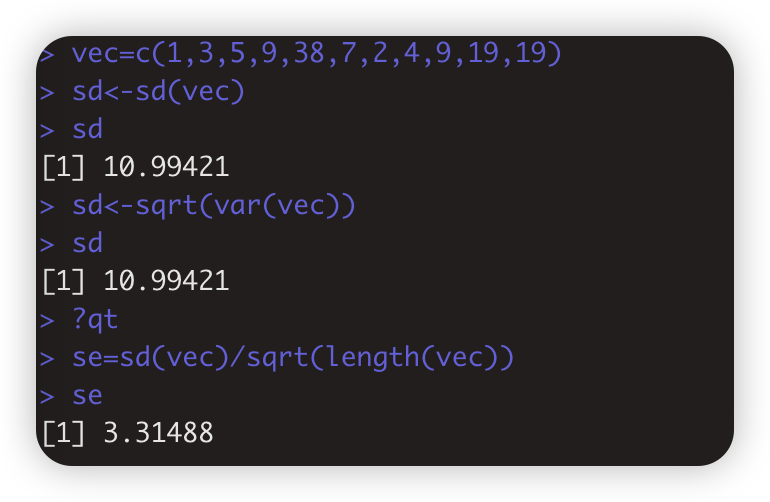
> vec=c(1,3,5,9,38,7,2,4,9,19,19)
> sd<-sd(vec)
> sd
[1] 10.99421
> sd<-sqrt(var(vec))
> sd [1] 10.99421
> se=sd(vec)/sqrt(length(vec))
> se
[1] 3.31488
> alpha=0.05
> t=qt((1-alpha)/2+.5,length((vec)-1) + )
> t
[1] 2.200985
> CI=t*se
> CI
[1] 7.296002
通过画bar图比较三个的区别
> library(ggplot2)
> library(dplyr)
> data<-iris %>%select(Species,Sepal.Length)
> glimpse(data)

my_sum<-data %>%group_by(Species) %>%summarise(n=n(),mean=mean(Sepal.Length),sd=sd(Sepal.Length)) %>%mutate(se=sd/sqrt(n)) %>%mutate(ic=se*qt((1-0.05)/2+.5,n-1)) #定义三列统计数据
glimpse(my_sum)

> ggplot(my_sum)+geom_bar(aes(x=Species,y=mean),stat="identity",fill="forestgreen",alpha=0.5)+geom_errorbar(aes(x=Species,ymin=mean-sd,ymax=mean+sd),width=0.4,colour="orange",alpha=0.9,size=1.5)+ggtitle("using standard deviation")

> ggplot(my_sum)+geom_bar(aes(x=Species,y=mean),stat="identity",fill="forestgreen",alpha=0.5)+geom_errorbar(aes(x=Species,ymin=mean-se,ymax=mean+se),width=0.4,colour="orange",alpha=0.9,size=1.5)+ggtitle("using standard error")

> ggplot(my_sum)+geom_bar(aes(x=Species,y=mean),stat="identity",fill="forestgreen",alpha=0.5)+geom_errorbar(aes(x=Species,ymin=mean-ic,ymax=mean+ic),width=0.4,colour="orange",alpha=0.9,size=1.5)+ggtitle("using confidence interval")

#qt(p,df,ncp,lower.tail=TRUE,log.p=FALSE) #qt 具有df自由度(和可选的非中心参数ncp)的t分布的密度、分布函数、分位数函数和随机生成。
p 向量的概率
df 自由度水平(degree of freedom)
ncp non-centrality 非中心参数delta,目前除了rt(),仅适用于abs(ncp)<=37.62.如果省略,则使用中心contral t分布
log,log.p 逻辑值,如果是TRUE,概率p会以log(p)形式给出。
lower.tail 逻辑值,如果TRUE(默认),概率是P[X<=x],否则,P[X>=x]