原理
直方图均衡化是一种通过使用图像直方图,调整对比度的图像处理方法;通过对图像的强度(intensity)进行某种非线性变换,使得变换后的图像直方图为近似均匀分布,从而,达到提高图像对比度和增强图片的目的。普通的直方图均衡化采用如下形式的非线性变换:
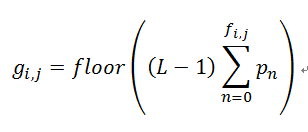
设 f 为原始灰度图像,g 为直方图均衡化的灰度图像,则 g 和 f 的每个像素的映射关系如下:

其中,L 为灰度级,通常为 256,表明了图像像素的强度的范围为 0 ~ L-1;
pn 等于图像 f 中强度为 n 的像素数占总像素数的比例,即原始灰度图直方图的概率密度函数;
fi,j 表示在图像 f 中,第 i 行,第 j 列的像素强度;gi,j 表示在图像 g 中,第 i 行,第 j 列的像素强度.
Python 实现
#!/usr/bin/env python
# -*- coding: utf8 -*-
"""
# Author: klchang
# Date: 2018.10
# Description:
    histogram equalization of a gray image.
"""
from __future__ import print_function
import numpy as np
import matplotlib.pyplot as plt


def histequ(gray, nlevels=256):
    # Compute histogram
    histogram = np.bincount(gray.flatten(), minlength=nlevels)
    print ("histogram: ", histogram)

    # Mapping function
    uniform_hist = (nlevels - 1) * (np.cumsum(histogram)/(gray.size * 1.0))
    uniform_hist = uniform_hist.astype('uint8')
    print ("uniform hist: ", uniform_hist)

    # Set the intensity of the pixel in the raw gray to its corresponding new intensity
    height, width = gray.shape
    uniform_gray = np.zeros(gray.shape, dtype='uint8')  # Note the type of elements
    for i in range(height):
        for j in range(width):
            uniform_gray[i,j] = uniform_hist[gray[i,j]]

    return uniform_gray


if __name__ == '__main__':
    fname = "320px-Unequalized_Hawkes_Bay_NZ.png" # Gray image
    # Note, matplotlib natively only read png images.
    gray = plt.imread(fname, format=np.uint8)
    if gray is None:
        print ("Image {} does not exist!".format(fname))
        exit(-1)

    # Histogram equalization
    uniform_gray = histequ(gray)

    # Display the result
    fig, (ax1, ax2) = plt.subplots(1, 2)
    ax1.set_title("Raw Image")
    ax1.imshow(gray, 'gray')
    ax1.set_xticks([]), ax1.set_yticks([])

    ax2.set_title("Histogram Equalized Image")
    ax2.imshow(uniform_gray, 'gray')
    ax2.set_xticks([]), ax2.set_yticks([])

    fig.tight_layout()
    plt.show()
原始图片 320px-Unequalized_Hawkes_Bay_NZ.png

结果显示

参考资料
[1]. Histogram_equalization - Wikipedia. https://en.wikipedia.org/wiki/Histogram_equalization
[2]. Histogram Equalization. https://www.math.uci.edu/icamp/courses/math77c/demos/hist_eq.pdf