EM算法与混合高斯模型
close all;
clear;
clc;
%% Sample Generate
N=5000;
a_real =[3/10,5/10,2/10];
mu_real = [7,12;12,7;14,15];
cov_real(:,:,1) = [1,0;0,1];
cov_real(:,:,2) = [3,1;1,3];
cov_real(:,:,3) = [3,1;1,3];
X_1 = mvnrnd(mu_real(1,:),cov_real(:,:,1),N*a_real(1));
X_2 = mvnrnd(mu_real(2,:),cov_real(:,:,2),N*a_real(2));
X_3 = mvnrnd(mu_real(3,:),cov_real(:,:,2),N*a_real(3));
X=[X_1;X_2;X_3];
X = X(randperm(size(X,1)),:);
%% Sample Ploting
x = 0:0.5:20;
y = 0:0.5:20;
[x y]=meshgrid(x,y);
mesh = [x(:),y(:)];
z_real = a_real(1)*mvnpdf(mesh,mu_real(1,:),cov_real(:,:,1))+...
a_real(2)* mvnpdf(mesh,mu_real(2,:),cov_real(:,:,2))+...
a_real(3)* mvnpdf(mesh,mu_real(3,:),cov_real(:,:,3));
subplot(2,3,1);
plot(X_1(:,1),X_1(:,2),'x',X_2(:,1),X_2(:,2),'o',X_3(:,1),X_3(:,2),'<')
subplot(2,3,2);
contour(x,y,reshape(z_real,size(x,2),size(y,2)));
subplot(2,3,3);
surf(x,y,reshape(z_real,size(x,2),size(y,2)));
subplot(2,3,4);
plot(X(:,1),X(:,2),'x');
%%subplot(2,2,3);
%%surf(x,y,reshape(z_real,size(x,2),size(y,2)));
%%shading interp;
%% Parameter Initialization
a = [1/3, 1/3,1/3];
cov(:,:,1) = [1,0;0,1];
cov(:,:,2) = [1,0;0,1];
cov(:,:,3) = [1,0;0,1];
mu_y_init = (max(X(:,1))+min(X(:,1)))/2;
mu_x1_init = max(X(:,2))/4+3*min(X(:,2))/4;
mu_x2_init = 2*max(X(:,2))/4+2*min(X(:,2))/4;
mu_x3_init = 3*max(X(:,2))/4+1*min(X(:,2))/4;
w = zeros(size(X,1),length(a)); %%w(i,j),i是样本数量,j是聚类数量,w(i,j)的值表示样本i属于聚类j的概率,最大值表示i的聚类
mu = [mu_x1_init,mu_y_init;mu_x2_init,mu_y_init;mu_x3_init,mu_y_init];
%% EM Implementation
iter = 40;
for i = 1:iter
%% Expectaion: 根据现有的(最新得到的)高斯分布和先验概率,计算每一个样本属于每一个聚类的概率
for j = 1 : length(a)
w(:,j)=a(j)*mvnpdf(X,mu(j,:),cov(:,:,j));
end
w=w./repmat(sum(w,2),1,size(w,2)); %%为了方便./计算,建立一个和w一样规模的矩阵,矩阵的列是相同的,每一行是w(:,1)+w(:,2)的值
%% Maximum: 根据现有的(最新得到的)的每一个样本属于每一个聚类的概率,计算先验概率和高斯参数
a = sum(w,1)./size(w,1); %%把w的每一行加起来就能得到每一个聚类的先验概率
mu = w'*X; %%分别得到X每一维对于每一个聚类的期望,mu(i,j),i是维数,j是聚类数
mu= mu./repmat((sum(w,1))',1,size(mu,2));
for j = 1 : length(a)
vari = repmat(w(:,j),1,size(X,2)).*(X- repmat(mu(j,:),size(X,1),1)); %%得到一个特定聚类X每一维的方差矩阵,乘以w,(相当于选择出属于该聚类的X)
cov(:,:,j) = (vari'*vari)/sum(w(:,j),1);
end
end
%% Estimation
[c estimate] = max(w,[],2);
%% Estimation Plotting
z = a(1)*mvnpdf(mesh,mu(1,:),cov(:,:,1))+...
a(2)* mvnpdf(mesh,mu(2,:),cov(:,:,2))+...
a(3)* mvnpdf(mesh,mu(3,:),cov(:,:,3));
subplot(2,3,5);
contour(x,y,reshape(z,size(x,2),size(y,2)));
one = find(estimate==1);
two = find(estimate == 2);
three = find(estimate == 3);
% Plot Examples
subplot(2,3,6);
plot(X(one, 1), X(one, 2), 'x',X(two, 1), X(two, 2), 'o', X(three, 1), X(three, 2), '<');
%plot(X(neg, 1), X(neg, 2), 'o');
%% Build-in EM Implementation
%options = statset('Display','final');
%gm = gmdistribution.fit(X,2,'Options',options);
%subplot(2,2,4);
%ezcontour(@(x,y)pdf(gm,[x y]),[0 20],[0 20]);
matlab中各种高斯相关函数
matlab, 高斯函数, 高斯分布
最常见的是产生服从一维标准正态分布 的随机数
的随机数
-
n=100;

-
x=randn(1,n)

实现服从任意一维高斯分布的随机数
-
u=10;

-
sigma=4;

-
x=sigma*randn(1,n)+u


产生服从多元高斯分布的随机变量 函数mvnrnd,[multivarite normal random]
-
n=100; %产生随机数的个数

-
mu=[1 -1];

-
Sigma=[.9,.4;.4,.3];

-
r=mvnrnd(mu,Sigma,n);

将产生的随机数绘制在二维平面
-
scatter(r(:,1),r(:,2));


1474457688429.jpg
当然mvnrnd函数还可以产生更高维数的高斯随机数,具体参见matlab help。

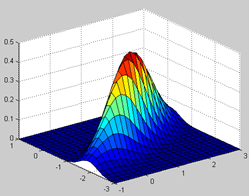
产生多元高斯分布概率密度函数
Y=mvnpdf(X,[MU,Sigma])
其中可省参数MU,Sigma默认值分别为零向量和单位阵,X是 的矩阵,N是样本个数,D是样本维数。
-
mu = [1 -1]; Sigma = [.9 .4; .4 .3];

-
[X1,X2] = meshgrid(linspace(-1,3,25)', linspace(-3,1,25)');

-
X = [X1(:) X2(:)];

-
p = mvnpdf(X, mu, Sigma);

-
surf(X1,X2,reshape(p,25,25));

和下面代码产生的趋势相同
-
mu = [1 -1];

-
Sigma = [.9 .4; .4 .3];

-
[X,Y] = meshgrid(linspace(-1,3,25)', linspace(-3,1,25)');

-
for i=1:25

-
for j=1:25

-
XY=[X(i,j),Y(i,j)];

-
Z(i,j)=exp(-0.5*(XY-mu)/Sigma*(XY-mu)');

-
end

-
end

-
surf(X,Y,Z);


1474460161935.jpg

高斯分布函数
Y=mvncdf(X,[Mu],[Sigma]) , cumulative probability of the multivariate norm distribution with mean Mu and covariance Sigma.
具体使用看代码
-
mu = [1 -1]; Sigma = [.9 .4; .4 .3];

-
[X1,X2] = meshgrid(linspace(-1,3,25)', linspace(-3,1,25)');

-
X = [X1(:) X2(:)];

-
p = mvncdf(X, mu, Sigma);

-
surf(X1,X2,reshape(p,25,25));


1474460555428.jpg

高斯隶属函数
gaussmf(X,[Sigma,Mu])
-
x = (0:0.1:10)';

-
y1 = gaussmf(x, [0.5 5]);

-
y2 = gaussmf(x, [1 5]);

-
y3 = gaussmf(x, [2 5]);

-
y4 = gaussmf(x, [3 5]);

-
plot(x, [y1 y2 y3 y4]);

