http://pyecharts.org/#/zh-cn/quickstart
test1,pyecharts 所有方法均支持链式调用。
from pyecharts.charts import Bar

bar = Bar()
bar.add_xaxis(["演员", "情节指数", "动作指数", "教育指数", "推荐度", "点击量"])
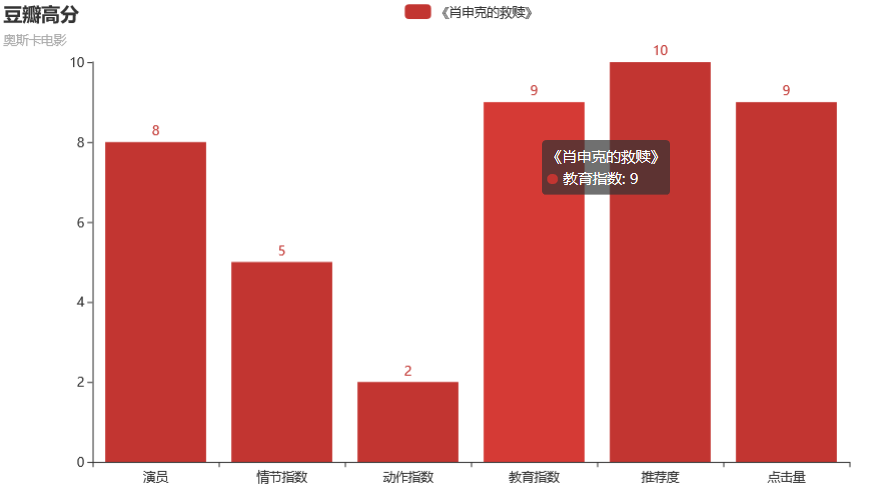
bar.add_yaxis("《肖申克的救赎》", [8, 5, 2, 9, 10, 9])
# render 会生成本地 HTML 文件,默认会在当前目录生成 render.html 文件
# 也可以传入路径参数,如 bar.render("mycharts.html")
bar.render()

#or

from pyecharts.charts import Bar

bar = (
    Bar()
    .add_xaxis(["演员", "情节指数", "动作指数", "教育指数", "推荐度", "点击量"])
    .add_yaxis("《肖申克的救赎》", [8, 5, 2, 9, 10, 9])
)
bar.render()

test2,使用 options 配置项,在 pyecharts 中,一切皆 Options。
from pyecharts.charts import Bar
from pyecharts import options as opts

# V1 版本开始支持链式调用
# 你所看到的格式其实是 `black` 格式化以后的效果
# 可以执行 `pip install black` 下载使用
bar = (
    Bar()
    .add_xaxis(["演员", "情节指数", "动作指数", "教育指数", "推荐度", "点击量"])
    .add_yaxis("《肖申克的救赎》", [8, 5, 2, 9, 10, 9])
    .set_global_opts(title_opts=opts.TitleOpts(title="豆瓣高分", subtitle="奥斯卡电影"))
    # 或者直接使用字典参数
    # .set_global_opts(title_opts={"text": "主标题", "subtext": "副标题"})
)
bar.render()

# 不习惯链式调用的开发者依旧可以单独调用方法
bar = Bar()
bar.add_xaxis(["演员", "情节指数", "动作指数", "教育指数", "推荐度", "点击量"])
bar.add_yaxis("《肖申克的救赎》", [8, 5, 2, 9, 10, 9])
bar.set_global_opts(title_opts=opts.TitleOpts(title="豆瓣高分", subtitle="奥斯卡电影"))
bar.render()
