• highchart 动态刷新(可用于制作股票时时走势)


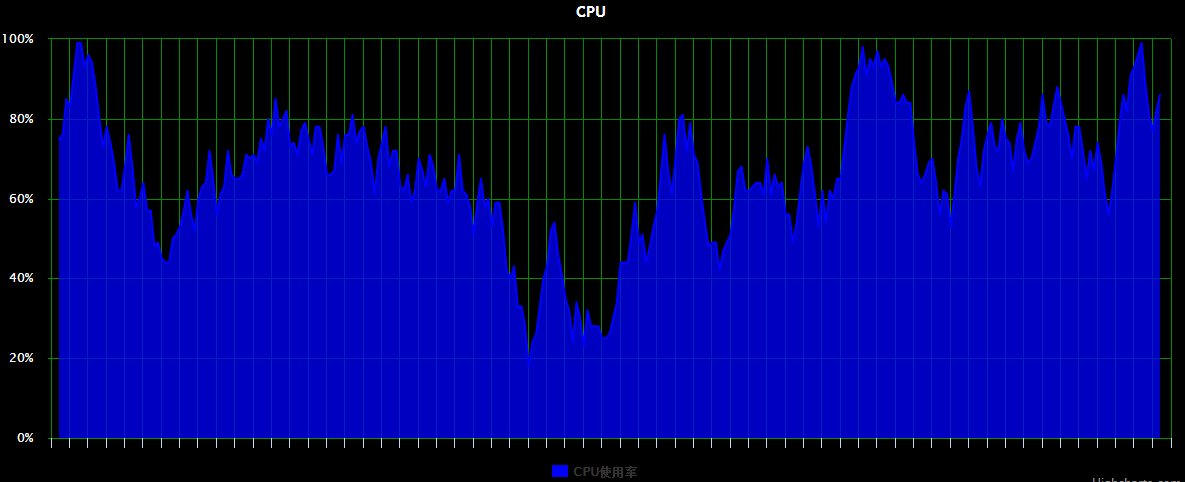
    最近项目中要求获取时时的cpu动态图,利用 highchart 可以轻松实现该功能,效果可在此地址查看:动态效果

    代码如下: 

    页面 js 引用: 

        <script src="你项目js的所在目录/jquery-1.8.3.min.js" type="text/javascript"></script>
        <script src="你项目js的所在目录/highcharts/highcharts.js" type="text/javascript"></script>

    创建一个div :

    <div id="syscharts" style="100%;height:500px;"></div>

    javascript 代码:

    $(function () {   
        var k=0;  
        $(document).ready(function() { 
            $('#syscharts').highcharts({             
                chart: {//设置背景色       
                    backgroundColor: {       
                        linearGradient: { x1: 0, y1: 0, x2: 1, y2: 1 },      
                        stops: [       
                            [0, 'rgb(0, 0, 0)'],      
                            [1, 'rgb(0, 0, 0)']      
                        ]
                    },
                    //设置放大的方向 可以是x或者y     
                    zoomType: 'xy',         
                    //设置绘图区域边框颜色和宽度 
                    plotBorderColor: '#008800',     
                    plotBorderWidth: 0,     
                    shadow:true,                  
                    //设置动画效果                  
                    animation: Highcharts.svg,                 
                    //左边距和右边距                  
                    marginRight: 20,     
                    borderColor: '#008800',      
                    borderWidth: 1,                 
                    events: {                      
                        load: function() {                                                 
                            var series = this.series[0]; 
                            var old = 0;                      
                            setInterval(function() {     
                                var x =(k++);
                                var y = Math.random()*100;
                                while(y-old>=10 || y - old <= -10){
                                    y = Math.random()*100;
                                }
                                old = y;
                                series.addPoint([x, parseInt(y)], true, true); 
                            }, 1000);                     
                        }                 
                    }             
                }, 
                title: {       
                    text:"CPU",       
                    style: {        
                        color: '#FFFFFF',        
                        font: 'bold 16px "Trebuchet MS", Verdana, sans-serif'       
                    }        
                },
                xAxis: {      
                    tickInterval: 5,      
                    gridLineColor: '#008800',      
                    gridLineWidth: 1,      
                    lineWidth:0,      
                    labels:{ 
                        formatter: function() { return ""; },      
                        step:1
                    },                 
                },             
                yAxis: [{    
                    tickInterval: 10,   
                    gridLineColor: '#008800',     
                    gridLineWidth: 1,     
                    min:0,     
                    max:100,                 
                    labels: {                      
                        formatter: function() {                         
                            return this.value +"%";                     
                        },                             
                        style: {                          
                            color: '#FFFFFF'                     
                        }                 
                    },                  
                    title: {  text: ''  },                  
                    opposite: false             
                }],              
                tooltip: {       
                    shared: false,
                    valueDecimals : 0             
                },              
                legend: {                  
                    enabled: true                 
                },              
                exporting: {                  
                    enabled: false             
                },       
                plotOptions: {                 
                    area: {                 
                        marker: {                          
                            enabled: false,                         
                            symbol: 'circle',                         
                            radius: 2,                         
                            states: {                             
                                hover: {                                  
                                    enabled: true                             
                                }                         
                            }                     
                        }                 
                    },                  
                    line: {                      
                        marker: {                          
                            enabled: false,
                            symbol: 'circle',                         
                            radius: 1,                        
                            states: {                             
                                hover: {                                  
                                    enabled: true                             
                                }                         
                            }                     
                        }                 
                    }             
                },
                credits:{ enabled:false},                          
                series: [{                  
                        name: 'CPU使用率',                 
                        type: 'area',//line 则为不填充折线样式                  
                        color: '#0000FF',     
                        yAxis: 0,                   
                        data: (function() {                 
                            var data = [], i;                            
                            for (i = -300; i <= 0; i++) {                         
                                data.push({                              
                                    x: i,                             
                                    y: 0                         
                                });                    
                            }                       
                            return data;                 
                    })() 
               }]         
            });     
        });      
    });

    附上两张静态效果图,也可以查看 →.→  动态效果 ←.←
  • 相关阅读:
    关于java中的批注@SuppressWarnings
    Enumeration接口的用法
    java中的Properties类的操作
    编译java时出现(端口冲突)Address already in use: JVM_Bind<null>:1919
    jQuery画廊插件-GalleryView
    jQuery中用attr和prop获取checkbox的属性问题
    (报错记录)Failed to execute goal org.apache.maven.plugins:maven-compiler-plugin:2.3.2:
    JDK 和 JRE 的区别(转载)
    css属性之vertical-align详解
    this——笔记
  • 原文地址:https://www.cnblogs.com/jying/p/4346062.html
Copyright © 2020-2023  润新知