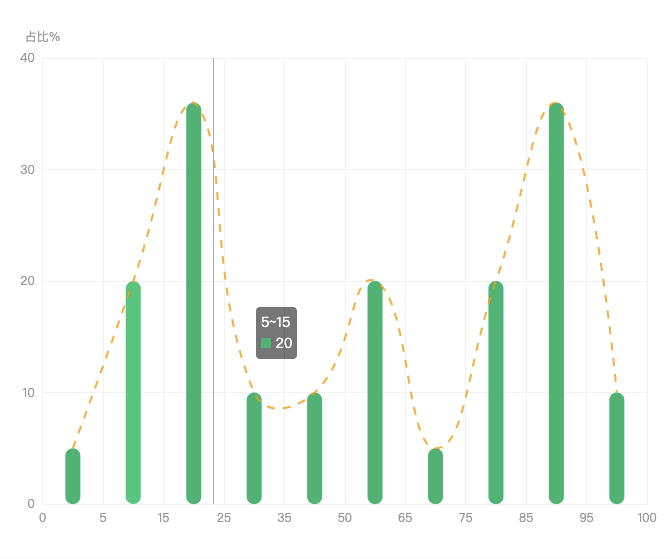
功能需求:有时候往往需要一个范围区间显示一个值。
解决思路:一般正常设置,只能一个刻度对应一个值。那么则需要使用两个x轴来解决即可。
  1 const xData = ['0', '5', '15', '25', '35', '50', '65', '75', '85', '95', '100'];
  2 const barData = [5, 20, 36, 10, 10, 20, 5, 20, 36, 10];
  3
  4
  5 option = {
  6     grid: {
  7         left: '3%',
  8         right: '4%',
  9         bottom: '3%',
 10         containLabel: true,
 11     },
 12     tooltip: {
 13         show: true,
 14         trigger: 'axis',
 15         confine: true,
 16         formatter(item) {
 17             const html = `<div>
 18                                         <div>${xData[item[0].dataIndex]}~${xData[item[0].dataIndex + 1]}</div>
 19                                             <div><span style="10px;height:10px;display: inline-block;background:${
 20                                                 item[0].color
 21                                             }"></span> ${item[0].data}</div>
 22                                   </div>`;
 23             return html;
 24         },
 25     },
 26     xAxis: [
 27         {
 28             data: barData,
 29             show: false,
 30         },
 31         {
 32             data: xData,
 33             position: 'bottom',
 34             boundaryGap: false,
 35             axisPointer: {
 36                 show: false,
 37             },
 38             nameTextStyle: {
 39                 color: '#999',
 40             },
 41             axisLine: {
 42                 show: false,
 43             },
 44             axisTick: {
 45                 show: false,
 46             },
 47             axisLabel: {
 48                 interval: 0,
 49                 color: '#999999',
 50             },
 51             splitLine: {
 52                 show: true,
 53                 lineStyle: {
 54                     color: '#F1F1F1',
 55                 },
 56             },
 57         },
 58     ],
 59     yAxis: {
 60         type: 'value',
 61         name: '占比%',
 62         nameTextStyle: {
 63             color: '#999',
 64         },
 65         axisLine: {
 66             show: false,
 67         },
 68         axisTick: {
 69             show: false,
 70         },
 71         axisLabel: {
 72             color: '#999999',
 73         },
 74         splitLine: {
 75             show: true,
 76             lineStyle: {
 77                 color: '#F1F1F1',
 78             },
 79         },
 80     },
 81     series: [
 82         {
 83             data: barData,
 84             type: 'bar',
 85             name: '全国常模标准',
 86             barWidth: 15,
 87             itemStyle: {
 88                 color: '#00B66C',
 89                 barBorderRadius: 20,
 90             },
 91             markPoint: {
 92                 animation: false,
 93                 symbolSize: [45, 30],
 94                 symbol: 'image://https://oss.zhihanyun.com/1623144238845_icon2.png',
 95                 symbolOffset: [0, -20],
 96                 silent: true,
 97                 label: {
 98                     color: '#fff',
 99                     position: ['25%', '25%'],
100                 },
101                 itemStyle: {},
102                 data: [],
103             },
104         },
105         {
106             data: barData,
107             type: 'line',
108             xAxisIndex: 0,
109             symbol: 'none',
110             smooth: true,
111             lineStyle: {
112                 type: 'dashed',
113                 color: '#FFA100',
114                 opacity: 0.9,
115             },
116         },
117     ],
118 };
效果图:
