ping 命令以前是一个很好用并且常用的网络测试工具,它是基于 ICMP 协议,但是出于网络安全等因素,大部分网络环境以及云环境可能都会禁止 ICMP 协议,所以在工作中,我们必须掌握一些其他比较流行的网络测试工具,下面分别介绍 tcpping、tcping、psping、hping、paping 等几款网络测试工具。
关于 ICMP 概念:
ICMP 是(Internet Control Message Protocol)Internet 控制报文协议。它是 TCP/IP 协议族的一个子协议,用于在 IP 主机、路由器之间传递控制消息。控制消息是指网络通不通、主机是否可达、路由是否可用等网络本身的消息。这些控制消息虽然并不传输用户数据,但是对于用户数据的传递起着重要的作用。
tcpping 介绍
tcpping 工具工作在 TCP 层,通过发送伪造的 TCP SYN 包并侦听来自服务器或中间设备返回的 SYN/ACK 或 RST 。代码100多行,源代码在此链接http://www.vdberg.org/~richard/tcpping,tcpping需要调用tcptraceroute。打印与ping近乎相同测试结果,目前版本为V1.7,tcping的介绍参考链接http://www.vdberg.org/~richard/tcpping.html,这个是Richard van den Berg在2002年编写的,作者当时需要测量TCP往返时间。所以写了这个脚本。tcpping只支持Linux。不支持Windows平台。
tcpping 安装
1: tcpping 脚本依赖 tcptraceroute 组件,所以必须先安装 tcptraceroute
#yum install tcptraceroute
2:下载tcpping文件
wget [http://www.vdberg.org/~richard/tcpping](http://www.vdberg.org/~richard/tcpping)
3:将 tcpping 文件移动到 /usr/bin 下并授权。
# mv tcpping /usr/bin/

# cd /usr/bin

# chmod 755 tcpping
tcpping****测试
tcpping帮助信息。
| 参数 | 参数描述 |
|---|---|
| -d | 在每个结果输出前打印时间戳 |
| -c | 将结果输出在一列 |
| -C | 输出与fping的-C选项相同的打印格式 |
| -w | Wait time in seconds (defaults to 3) |
| -r | -r n:每n秒重复一次(默认为1) |
| -x | 重复n次(默认为无限制) |
![clip_image001[4]](http://images2017.cnblogs.com/blog/73542/201712/73542-20171223111513678-1475746623.png "clip_image001[4]")
![clip_image002[4]](http://images2017.cnblogs.com/blog/73542/201712/73542-20171223111514412-1013451817.png "clip_image002[4]")
tcping 介绍
tcping 也是通过 tcp 端口工作,tcping 还能监听某个端口的状态,注意 tcping 与 tcpping 是不同的两款工具,另外 tcping 也有很多版本。如下所示:
来自 kirchner 源代码的 TCPing
来自 Eli Fulkerson 源代码的 TCPing
tcping****安装
Windows 平台:
从https://www.elifulkerson.com/projects/tcping.php下载该工具后。放到 C:WindowsSystem32 目录下即可。无需安装。
Linux 平台:
linux 平台较多,安装方式也较多,当然最简单的莫过于 yum 安装。测试感觉 Linux 下的这款工具功能过于简单。
yum install tcping
tcping 测试
Eli Fulkerson 写的 Windows 下的 tcping 功能十分强大。参数多到不想去总结,实在是太多了,如果不清楚,每次使用的时候查看帮助文档即可。
C:Users>tcping www.aliyun.com

Probing 140.205.172.20:80/tcp - Port is open - time=2.444ms

Probing 140.205.172.20:80/tcp - Port is open - time=2.574ms

Probing 140.205.172.20:80/tcp - Port is open - time=2.965ms

Probing 140.205.172.20:80/tcp - Port is open - time=4.074ms

Ping statistics for 140.205.172.20:80

4 probes sent.

4 successful, 0 failed.

Approximate trip times in milli-seconds:

Minimum = 2.444ms, Maximum = 4.074ms, Average = 3.014ms
C:Users>tcping www.aliyun.com 80

Probing 140.205.172.20:80/tcp - Port is open - time=2.731ms

Probing 140.205.172.20:80/tcp - Port is open - time=2.126ms

Probing 140.205.172.20:80/tcp - Port is open - time=2.916ms

Probing 140.205.172.20:80/tcp - Port is open - time=2.609ms

Ping statistics for 140.205.172.20:80

4 probes sent.

4 successful, 0 failed.

Approximate trip times in milli-seconds:

Minimum = 2.126ms, Maximum = 2.916ms, Average = 2.595ms
Linux:
Linux 下的 tcping 命令功能非常简单,如下所示,感觉没有 tcpping 或 Windows 下的 tcping 功能强大。
Usage: tcping [-q] [-t timeout_sec] [-u timeout_usec] <host> <port>

[root@DB-Server ~]# tcping  192.168.27.57 1433

192.168.27.57 port 1433 open.
PsPing介绍
下面是官方文档以及 Azure 官方文档关于 PsPing 的介绍资料,这些介绍已经全面的阐述了 PsPing 这款工具:
PsPing implements Ping functionality, TCP ping, latency and bandwidth measurement. Use the following command-line options to show the usage for each test type:
通常,我们测试数据包能否通过 IP 协议到达特定主机时,都习惯使用 ping 命令。工作时用 ping 向目标主机发送一个 IMCP Echo 请求的数据包,并等待接收 Echo 响应数据包,通过响应时间和成功响应的次数来估算丢包率和网络时延。但是在 Azure 中 ICMP 包无法通过防火墙和负载均衡器,所以不能直接使用 ping 来测试 Azure 中的虚拟机和服务的连通性(VPN 和 Express Route 通道中的流量不经过负载均衡器,所以只要链路上的防火墙允许 ICMP 包传递,ping 依然可用)。
为了在 Azure 中进行连通性测试,例如测试 RDP、SSH 端口可用性,或者 HTTP、HTTPS 服务稳定性,甚至测试从 Azure 向外部服务的连接,我们都推荐使用 PsPing 或PaPing。PsPing 是微软 PSTools 工具套件中的其中一个命令。除了ICMP ping 测试,它主要用来测试 TCP 端口的连通性,还可以测试 TCP/UDP 网络时延和带宽。不过, PsPing只能在 Windows 中运行。如果您需要在 Linux 中发起 TCP 端口连通性和网路时延的测试,可以使用 PaPing 。PaPing 是一个跨平台的开源工具。它的功能相对 PsPing 而言更简单,只支持 TCP 端口的相关测试,不支持 UDP 端口的测试。
PsPing安装
PSTool 工具包可以从微软官方网址下载:https://docs.microsoft.com/zh-cn/sysinternals/downloads/psping 。 解压 PSTools.zip 包后,将 psping.exe 拷贝到 C:WindowsSystem32 下,那么你在 cmd 命令窗口的任意目录都可以使用 PsPing 命令了。当然你也可以单独将 psping.exe 命令解压出来放在任意路径,然后从命令提示符来运行。只是这样就需要在运行命令前转换到 psping.exe 所在的路径。
PsPing 参数
psping 帮助信息查看,如下所示 psping 四个主要功能的帮助命令,四个功能分别是 ICMP Ping、TCP Ping、延迟测试、带宽测试。
![clip_image003[4]](http://images2017.cnblogs.com/blog/73542/201712/73542-20171223111514943-302199473.png "clip_image003[4]")
ping 测试
| 参数 | 参数说明 |
|---|---|
| -h | 输出直方图(默认步长数量为20) |
| -i | 指定ping包的间隔秒数,快ping则设置为0 |
| -l | 指定ping包大小,默认单位是byte。使用 k为单位代表kilobytes(KB),使用m为单位代表megabytes(MB) |
| -n | 指定测试次数。还可以指定测试的时间长度,以秒为单位,使用时在数字后加上s,例如“10s” |
| -q | 测试过程中不输出结果,结束后显示统计结果 |
| -t | 类似于 ICMP 的长 ping 测试,直到按下 Ctrl+C 停止测试,并显示统计结果 |
| -w | 热身次数,默认为 1 次 |
| -4 | 强制使用 IPv4 |
| -6 | 强制使用 IPv6 |
![clip_image004[4]](http://images2017.cnblogs.com/blog/73542/201712/73542-20171223111515506-751262379.png "clip_image004[4]")
延迟测试多了参数-r,-u,-f
| 参数 | 参数说明 |
|---|---|
| -f | Open source firewall port during the run. |
| -u | 使用UDP ping(默认是TCP) |
| -h | 输出直方图(默认步长数量为20) |
| -r | 从服务器接收代替发送 |
| -i | 指定ping包的间隔秒数,快ping则设置为0 |
| -l | 指定ping包大小,默认单位是byte。使用 k为单位代表kilobytes(KB),使用m为单位代表megabytes(MB) |
| -n | 指定测试次数。还可以指定测试的时间长度,以秒为单位,使用时在数字后加上s,例如“10s” |
| -q | 测试过程中不输出结果,结束后显示统计结果; |
| -t | 类似于 ICMP 的长 ping 测试,直到按下 Ctrl+C 停止测试,并显示统计结果; |
| -w | 热身次数,默认为 5 次 |
| -4 | 强制使用 IPv4 |
| -6 | 强制使用 IPv6 |
| -s | 服务器监听地址和端口 |
C:Users>psping -? b

PsPing v2.10 - PsPing - ping, latency, bandwidth measurement utility

Copyright (C) 2012-2016 Mark Russinovich

Sysinternals - [www.sysinternals.com](http://www.cnblogs.com/kerrycode/p/www.sysinternals.com)

TCP and UDP bandwidth usage:

server: psping [-6|-4] [-f] -s address:port

client: psping -b -l requestsize[k|m] -n count[s] [-r] [-u [target]] [-i outstan

ding] [-w count] [-f] [-h [buckets|val1,val2,...]] [-6|-4] destination:port

-b    Bandwidth test.

-l    Request size. Append 'k' for kilobytes and 'm' for megabytes.

-n    Number of sends/receives. Append 's' to specify seconds e.g. '10s'.

-r    Receive from the server instead of sending.

-u    UDP (default is TCP). Specify target bandwidth in MB/s.

-i    Number of outstanding I/Os (default is min of 16 and 2x CPU cores).

-w    Warmup for the specified iterations (default is 2x CPU cores).

-f    Open source firewall port during the run.

-h    Print histogram (default bucket count is 20).

If you specify a single argument, it's interpreted as a bucket

count and the histogram will contain that number of

buckets covering the entire time range of values.

Specify a comma-separated list of times to create a custom

histogram (e.g. "0.01,0.05,1,5,10").

-4    Force using IPv4.

-6    Force using IPv6.

-s    Server listening address and port.

The server can serve both latency and bandwidth tests and remains active until

you terminate it with Control-C.
带宽测试多了 -b、-i 两个参数。如下所示:
-b 带宽测试
-i 未完成的I/O数量
PsPing****测试案例
例子1,例如我要检查服务器的1433端口是否开放
![clip_image005[4]](http://images2017.cnblogs.com/blog/73542/201712/73542-20171223111516006-940477958.png "clip_image005[4]")
例子2:网络时延测试
C:Users>psping -n 6 -w 2 -h xxxxxx.database.chinacloudapi.cn:1433

PsPing v2.10 - PsPing - ping, latency, bandwidth measurement utility

Copyright (C) 2012-2016 Mark Russinovich

Sysinternals - www.sysinternals.com

TCP connect to 139.219.130.35:1433:

8 iterations (warmup 2) ping test:

Connecting to 139.xxx.130.xx:1433 (warmup): from 192.168.103.21:57851: 36.10ms

Connecting to 139.xxx.130.xx:1433 (warmup): from 192.168.103.21:57852: 36.32ms

Connecting to 139.xxx.130.xx:1433: from 192.168.103.21:57853: 40.33ms

Connecting to 139.xxx.130.xx:1433: from 192.168.103.21:57854: 34.71ms

Connecting to 139.xxx.130.xx:1433: from 192.168.103.21:57855: 35.60ms

Connecting to 139.xxx.130.xx:1433: from 192.168.103.21:57856: 35.74ms

Connecting to 139.xxx.130.xx:1433: from 192.168.103.21:57858: 40.21ms

Connecting to 139.xxx.130.xx:1433: from 192.168.103.21:57859: 39.50ms

TCP connect statistics for 139.xxx.130.xxx:1433:

Sent = 6, Received = 6, Lost = 0 (0% loss),

Minimum = 34.71ms, Maximum = 40.33ms, Average = 37.68ms

Latency Count

34.71   1

35.01   0

35.30   0

35.60   2

35.89   0

36.19   0

36.49   0

36.78   0

37.08   0

37.37   0

37.67   0

37.96   0

38.26   0

38.56   0

38.85   0

39.15   0

39.44   1

39.74   0

40.03   1

40.33   1
例子3:网络带宽测试
![clip_image006[4]](http://images2017.cnblogs.com/blog/73542/201712/73542-20171223111516521-1801612859.png "clip_image006[4]")
paping 安装测试
paping的下载地址如下,它分Windows和Linux版本。
https://code.google.com/archive/p/paping/downloads
tar -xvf paping_1.5.5_x86-64_linux.tar.gz
解压到任意目录,就可以直接执行。另外 paping 命令对比 psping 命令,功能更简单、单一。它只有简单的4个参数。
-p, --port N 指定被测试服务的 TCP 端口(必须);
--nocolor 屏蔽彩色输出;
-t, --timeout 指定超时时长,单位为毫秒,默认值为 1000;
-c, --count N 指定测试次数。
[root@DB-Server tmp]# ./paping -?

paping v1.5.5 - Copyright (c) 2011 Mike Lovell

Syntax: paping [options] destination

Options:

-?, --help     display usage

-p, --port N   set TCP port N (required)

--nocolor  Disable color output

-t, --timeout  timeout in milliseconds (default 1000)

-c, --count N  set number of checks to N

[root@DB-Server tmp]# ./paping --nocolor -p 80 -c 10 www.azure.cn

paping v1.5.5 - Copyright (c) 2011 Mike Lovell

Connecting to 1stcncloud.dtwscachev290.ourwebcdn.com [27.155.71.36] on TCP 80:

Connected to 27.155.71.36: time=0.39ms protocol=TCP port=80

Connected to 27.155.71.36: time=0.33ms protocol=TCP port=80

Connected to 27.155.71.36: time=0.73ms protocol=TCP port=80

Connected to 27.155.71.36: time=0.48ms protocol=TCP port=80

Connected to 27.155.71.36: time=0.49ms protocol=TCP port=80

Connected to 27.155.71.36: time=0.39ms protocol=TCP port=80

Connected to 27.155.71.36: time=0.37ms protocol=TCP port=80

Connected to 27.155.71.36: time=0.35ms protocol=TCP port=80

Connected to 27.155.71.36: time=0.47ms protocol=TCP port=80

Connected to 27.155.71.36: time=0.52ms protocol=TCP port=80

Connection statistics:

Attempted = 10, Connected = 10, Failed = 0 (0.00%)

Approximate connection times:

Minimum = 0.33ms, Maximum = 0.73ms, Average = 0.45ms
Hping 介绍
Hping 是一个命令行下使用的 TCP/IP 数据包组装/分析工具,其命令模式很像 Unix 下的 ping 命令,但是它不仅能发送 ICMP 回应请求,它还可以支持 TCP、UDP、ICMP 和 RAW-IP 协议,它有一个路由跟踪模式,能够在两个相互包含的通道之间传送文件。Hping 常被用于检测网络和主机,其功能非常强大,可在多种操作系统下运行,如 Linux,FreeBSD,NetBSD,OpenBSD,Solaris,MacOs X,Windows。目前最新的版本为 hping3
Hping 的主要功能有:
1、防火墙测试
2、高级端口扫描
3、网络检测,可以用不同的协议、服务类型(TOS)、IP分片
4、手工探测MTU(最大传输单元)路径
5、先进的路由跟踪,支持所有的协议
6、远程操作系统探测
7、远程的运行时间探测
8、TCP/IP堆栈审计
Hping 的官方网址为http://www.hping.org/,开发者为是 Salvatore Sanfilippo.
Hping 安装
Hping 这个项目在 GitHub 上,https://github.com/antirez/hping,可以直接从这里下载安装。另外如果 yum 源有安装程序,使用 yum 安装最方便、快捷。
yum install hping3
下面是官方文档的源码安装,不过源码安装需要依赖一些组件,想必yum安装麻烦很多:
Linux

-----

please, follows this steps:

$ ./configure (first try ./configure --help)

$ vi Makefile (optional)

$ make

$ su

# make install

FreeBSD, OpenBSD, NetBSD

------------------------

You will need the libpcap and the gmake utility installed on your system.

$ ./configure

$ gmake

$ su (or calife)

# gmake install
Hping****测试
查看hping的帮助信息:
[root@DB-Server ~]# hping3 --help #或者hping --help
下面表格整理了部分参数信息,更多参数信息可以参考帮助文档或http://man.linuxde.net/hping
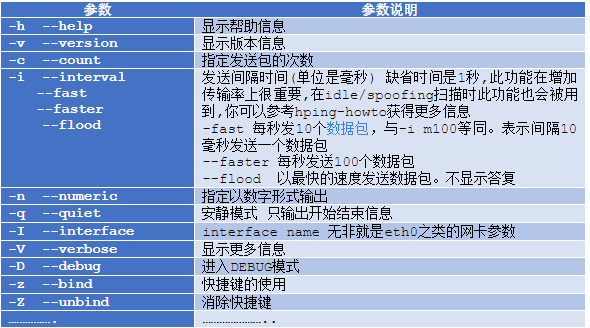
![clip_image007[4]](http://images2017.cnblogs.com/blog/73542/201712/73542-20171223111517146-1945489703.png "clip_image007[4]")
#hping3  -S 192.168.27.57 -p 1433

HPING 192.168.27.57 (eth0 192.168.27.57): S set, 40 headers + 0 data bytes

len=44 ip=192.168.27.57 ttl=60 DF id=0 sport=1433 flags=SA seq=0 win=5840 rtt=31.4 ms

len=44 ip=192.168.27.57 ttl=60 DF id=0 sport=1433 flags=SA seq=1 win=5840 rtt=23.5 ms

len=44 ip=192.168.27.57 ttl=118 DF id=10907 sport=1433 flags=SA seq=2 win=8192 rtt=20.4 ms

len=44 ip=192.168.27.57 ttl=118 DF id=10908 sport=1433 flags=SA seq=3 win=8192 rtt=15.6 ms

len=44 ip=192.168.27.57 ttl=60 DF id=0 sport=1433 flags=SA seq=4 win=5840 rtt=15.5 ms

len=44 ip=192.168.27.57 ttl=60 DF id=0 sport=1433 flags=SA seq=5 win=5840 rtt=14.1 ms

len=44 ip=192.168.27.57 ttl=60 DF id=0 sport=1433 flags=SA seq=6 win=5840 rtt=14.4 ms

^C

--- 192.168.27.57 hping statistic ---

7 packets transmitted, 7 packets received, 0% packet loss

round-trip min/avg/max = 14.1/19.3/31.4 ms
个人感觉 Hping 是功能最强大的一款工具,可以测试防火墙功能、端口扫描、Idle 扫描、拒绝服务攻击、木马功能,这篇hping3命令已经详细介绍了,而且有些测试不方便展示在此。在此略过细节。另外,工具再好,也需要可以掌握、驾驭工具的人。
参考资料:
https://docs.microsoft.com/en-us/sysinternals/downloads/psping
http://zhjwpku.com/2016/12/17/tcpping-hping-mtr.html
https://www.slashroot.in/what-tcp-ping-and-how-it-usedyouy