• echarts动态从后台获取数据展示在页面上


    1.html内容

    <div class="row">
            <div class="col-sm-12">
                <div class="ibox float-e-margins">
                    <div class="ibox-title">
                        <h5>趋势图</h5>
                    </div>
                    <div class="ibox-content">
                        <div class="row">
                            <div class="col-sm-12">
                                <div class="echarts" id="echarts-line-chart"></div>
                            </div>
                        </div>
                    </div>
                </div>
            </div>
        </div>

    2.对应的ajax请求函数

    <script>

    function getTrendByTime() {
        $.ajax({
            type: "post",
            url: "../deal/abnormal.do",
            data: {'action': 'getdatabyperhour2'},
            dataType: 'json',
            success: function (data) {
                //alert(JSON.stringify(data));
                var xdata = data.xdata;
                var ydata = data.ydata;
                var myChart = echarts.init(document.getElementById('echarts-line-chart'));
                var option = {
                    title: {text: '时间和流量'},
                    tooltip: {trigger: 'axis'},
                    legend: {data: ['24小时内流量']},
                    grid: {
                        left: '3%',
                        right: '8%',
                        bottom: '3%',
                        containLabel: true
                    },
    //                label: {
    //                    normal: {
    //                        show: true,
    //                        position: 'top'
    //                    }
    //                },
                    toolbox: {
                        show: true,
                        feature: {
                            dataView: { //数据视图
                                show: true,
                                readOnly:true
                            },
                            magicType: {//动态类型切换
                                type: ['bar', 'line', 'pie']
                            },
                            dataZoom: { //数据缩放视图
                                show: true
                            },
                            saveAsImage: {//保存图片
                                show: true
                            },
                            restore: { //重置
                                show: true
                            }
                        }
                    },
                    xAxis: {
                        type: 'category',
                        boundaryGap: true,
                        data: xdata,
                        name:'时间',
                        nameTextStyle:{
                            fontSize:15,
                            fontWight:'bold'
                        },
                        axisTick:{
                            alignWithLabel:true,
                            interval:0,
                            inside:true,
                            length:2.5
                        }
                    },
                    yAxis: {
                        type: 'value',
                        name:'流量(G)',
                        nameTextStyle:{
                            fontSize:15,
                            fontWeight:'bold'
                        },
                        axisTick:{
                            show:false
                        }
                    },
                    series: [{
                        name: '今日流量',
                        type: 'bar',
                        data: ydata
                    }]
                };
                myChart.setOption(option);
                window.onresize = function(){
                    myChart.resize();
                };
            },
            error: function (data) {
                //alert(data.status);
            }
        });
    }

    </script>

    3.效果图

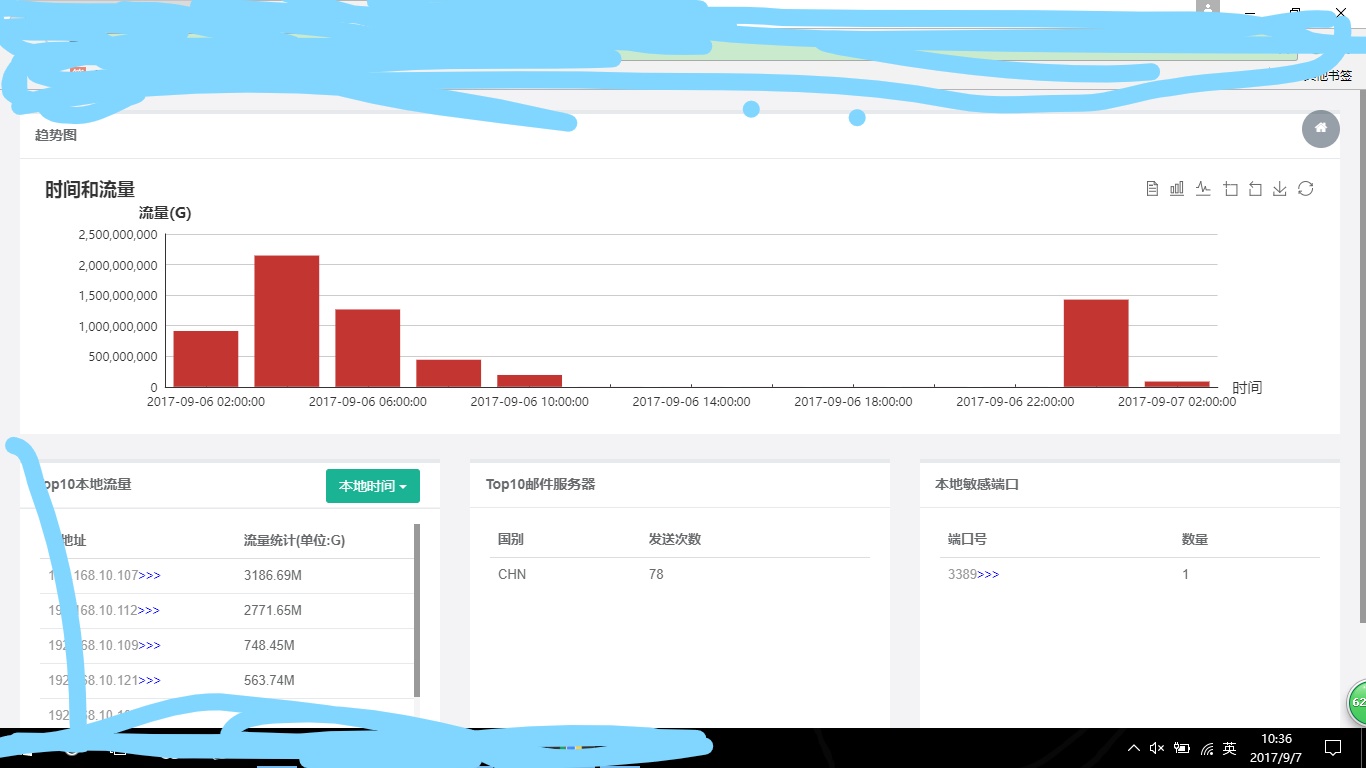
    其中图的类型可以手动切换为折线图,柱状图,数据试图

  • 相关阅读:
    分页
    IBM TAM手册
    单点登录集成商。
    Using Web Services Instead of DCOM
    symantec endpoint protection SEP禁用所有usb设备,只允许部分例外
    桌面管理landesk太古案例
    AdventureWorks数据库的安装和NorthWind例子数据库下载
    IBM Tivoli Access Manager for ebusiness 6.1.1 Administration and Deployment
    word编辑长文档方法
    笔记本电源消耗测量
  • 原文地址:https://www.cnblogs.com/johnny-cli/p/7489856.html
Copyright © 2020-2023  润新知