以下是使用Chart.JS绘制Gauge图的例子。
WebForm.aspx
<%@ Page Language="C#" AutoEventWireup="true" CodeBehind="WebForm1.aspx.cs" Inherits="chartjs.WebForm1" %>

<!DOCTYPE html>

<html xmlns="http://www.w3.org/1999/xhtml">
<head runat="server">
    <title></title>
</head>
<body>
    <div class="col-md-6 offset-md-3 my-5">
        <div class="card">
            <div class="card-body">
                <h1 class="pt-3 text-center">Chart JS Gauge Chart</h1>
            </div>
            <div class="card-body">
                <%--define a canvas--%>
                <canvas id="myChart"></canvas>
            </div>
        </div>
    </div>

    <script src="https://cdnjs.cloudflare.com/ajax/libs/Chart.js/2.7.3/Chart.min.js"></script>

    <script>
        var ctx = document.getElementById('myChart').getContext('2d');
        var chart = new Chart(ctx, {
            // The type of chart we want to create
            type: 'doughnut',

            // The data for our dataset
            data: {
                labels: <%=Newtonsoft.Json.JsonConvert.SerializeObject(labels)%>,
                datasets: [{
                    label: "My First dataset",
                    backgroundColor: ['blue', 'green', 'red', 'yellow', 'orange','purple','pink','gray','brown','black','cyan','gold'],
                    borderColor: '#fff',
                    data: <%=Newtonsoft.Json.JsonConvert.SerializeObject(data)%> // [1,2,1,3,...]
                }]
            },

            // Configuration options go here
            options: {
                circumference: 2 * Math.PI,
                rotation: 1 * Math.PI,
                cutoutPercentage: 80
            }
        });
    </script>
</body>
</html>
WebForm.aspx.cs
    public partial class WebForm1 : System.Web.UI.Page
    {
        public List<string> labels;
        public List<int> data;

        protected void Page_Load(object sender, EventArgs e)
        {
            labels = new List<string> { "January", "February", "March", "April", "May", "June", "July", "August", "September", "October", "November", "December" };
            data = new List<int> { 5, 10, 5, 2, 20, 6, 11, 3, 5, 8, 4, 14 };
        }
    }
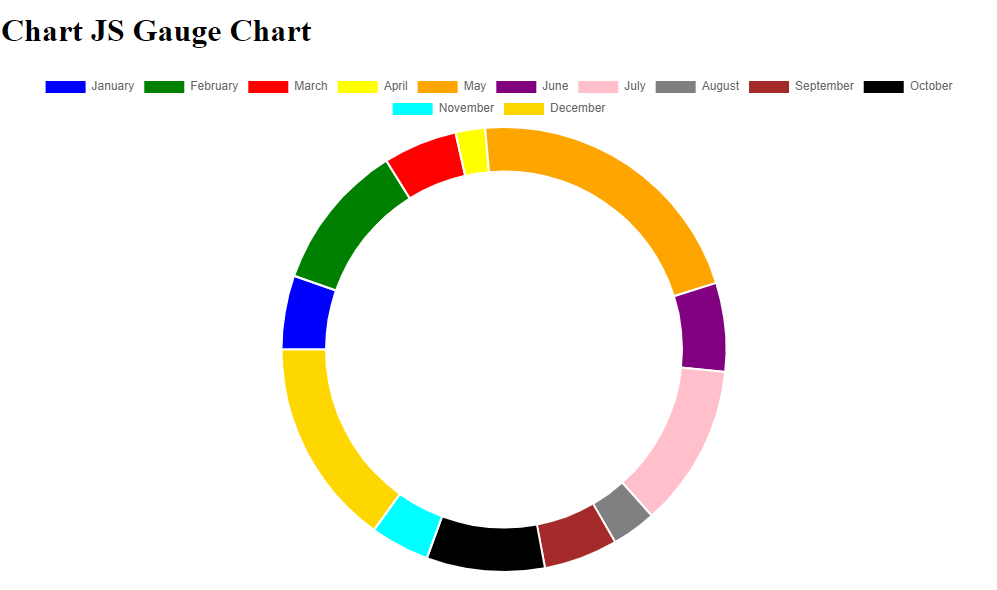
测试结果: