在前面讲过在linux下定位磁盘IO的一个命令:iostat
其实还有一个查看linux下磁盘IO读写速度命令:iotop
查看iotop -help,有哪些用法
# iotop -help
Usage: /usr/sbin/iotop [OPTIONS]

DISK READ and DISK WRITE are the block I/O bandwidth used during the sampling
period. SWAPIN and IO are the percentages of time the thread spent respectively
while swapping in and waiting on I/O more generally. PRIO is the I/O priority at
which the thread is running (set using the ionice command).

Controls: left and right arrows to change the sorting column, r to invert the
sorting order, o to toggle the --only option, p to toggle the --processes
option, a to toggle the --accumulated option, i to change I/O priority, q to
quit, any other key to force a refresh.

Options:
--version show program's version number and exit
-h, --help show this help message and exit
-o, --only only show processes or threads actually doing I/O
-b, --batch non-interactive mode
-n NUM, --iter=NUM number of iterations before ending [infinite]
-d SEC, --delay=SEC delay between iterations [1 second]
-p PID, --pid=PID processes/threads to monitor [all]
-u USER, --user=USER users to monitor [all]
-P, --processes only show processes, not all threads
-a, --accumulated show accumulated I/O instead of bandwidth
-k, --kilobytes use kilobytes instead of a human friendly unit
-t, --time add a timestamp on each line (implies --batch)
-q, --quiet suppress some lines of header (implies --batch)
在linux(我的是centos)用iotop命令出现下面的内容:
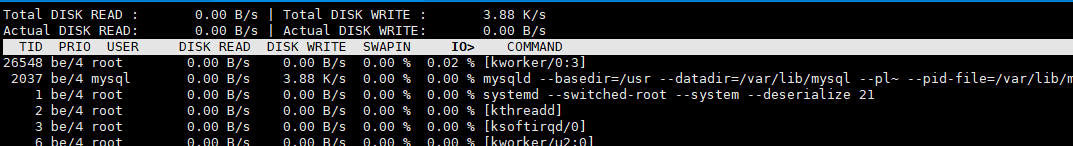
现在高版本的mysql(5.6.40或以上)中有一个很好用的系统数据库performance_schema,然后里面有一张表 threads,
记录了线程的各种信息,上面等iotop的第一个参数TID,就是mysql的一个线程,如果我们看到DISK_READ,
DISK_WRITE 读写的数据很大, 那么我们就可以找出这个线程的TID,然后到threads里面去查看哪个sql执行的
比较慢
以前的方法是去查看 slow log 慢日志
mysql> select * from performance_schema.threads where thread_id=29G
*************************** 1. row ***************************
THREAD_ID: 29
NAME: thread/sql/one_connection
TYPE: FOREGROUND
PROCESSLIST_ID: 10
PROCESSLIST_USER: root
PROCESSLIST_HOST: 192.168.0.100
PROCESSLIST_DB: performance_schema
PROCESSLIST_COMMAND: Sleep
PROCESSLIST_TIME: 21
PROCESSLIST_STATE: NULL
PROCESSLIST_INFO: NULL
PARENT_THREAD_ID: 1
ROLE: NULL
INSTRUMENTED: YES
1 row in set (0.00 sec)
PROCESSLIST_INFO 这个参数就是显示慢SQL信息