• echarts入门,5分钟上手写ECharts的第一个图表


    1.新建一个echarts.html文件,为ECharts准备一个具备大小(宽高)的Dom。

    <!DOCTYPE html>
    <head>
        <meta charset="utf-8">
        <title>ECharts</title>
    </head>
    
    <body>
        <!-- 为ECharts准备一个具备大小(宽高)的Dom -->
        <div id="main" style="height:400px"></div>
    </body>
    

    2.新建script标签引入模块化单文件echarts.js

    <!DOCTYPE html>
    <head>
        <meta charset="utf-8">
        <title>ECharts</title>
    </head>
    <body>
        <!-- 为ECharts准备一个具备大小(宽高)的Dom -->
        <div id="main" style="height:400px"></div>
        <!-- ECharts单文件引入 -->
        <script src="http://echarts.baidu.com/build/dist/echarts.js"></script>
    </body>
    

    3.新建script标签中为模块加载器配置echarts和所需图表的路径

    <!DOCTYPE html>
    <head>
        <meta charset="utf-8">
        <title>ECharts</title>
    </head>
    <body>
        <!-- 为ECharts准备一个具备大小(宽高)的Dom -->
        <div id="main" style="height:400px"></div>
        <!-- ECharts单文件引入 -->
        <script src="http://echarts.baidu.com/build/dist/echarts.js"></script>
        <script type="text/javascript">
            // 路径配置
            require.config({
                paths: {
                    echarts: 'http://echarts.baidu.com/build/dist'
                }
            });
        </script>
    </body>
    

    4.script标签内动态加载echarts和所需图表,回调函数中可以初始化图表并驱动图表的生成

    <!DOCTYPE html>
    <head>
        <meta charset="utf-8">
        <title>ECharts</title>
    </head>
    <body>
        <!-- 为ECharts准备一个具备大小(宽高)的Dom -->
        <div id="main" style="height:400px"></div>
        <!-- ECharts单文件引入 -->
        <script src="http://echarts.baidu.com/build/dist/echarts.js"></script>
        <script type="text/javascript">
            // 路径配置
            require.config({
                paths: {
                    echarts: 'http://echarts.baidu.com/build/dist'
                }
            });
            
            // 使用
            require(
                [
                    'echarts',
                    'echarts/chart/bar' // 使用柱状图就加载bar模块,按需加载
                ],
                function (ec) {
                    // 基于准备好的dom,初始化echarts图表
                    var myChart = ec.init(document.getElementById('main')); 
                    
                    var option = {
                        tooltip: {
                            show: true
                        },
                        legend: {
                            data:['销量']
                        },
                        xAxis : [
                            {
                                type : 'category',
                                data : ["衬衫","羊毛衫","雪纺衫","裤子","高跟鞋","袜子"]
                            }
                        ],
                        yAxis : [
                            {
                                type : 'value'
                            }
                        ],
                        series : [
                            {
                                "name":"销量",
                                "type":"bar",
                                "data":[5, 20, 40, 10, 10, 20]
                            }
                        ]
                    };
            
                    // 为echarts对象加载数据 
                    myChart.setOption(option); 
                }
            );
        </script>
    </body>
    

    5.查看效果

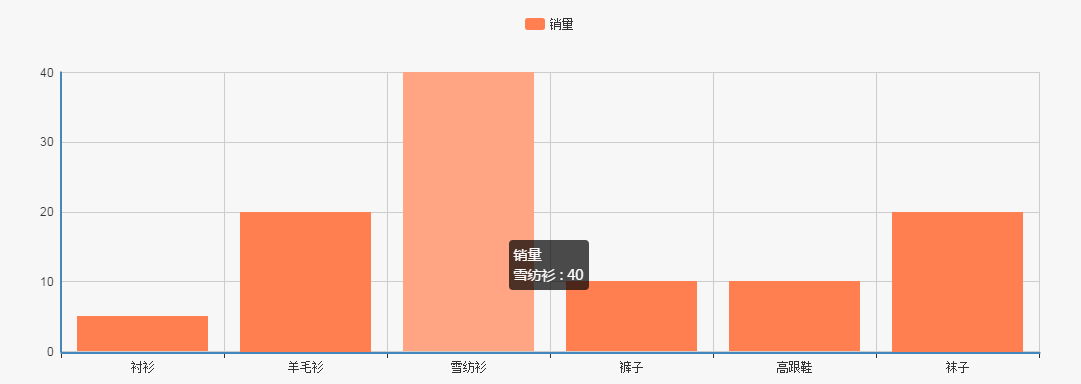
    参考上述内容+官方相关案例,调整修改,应用到自己的项目中
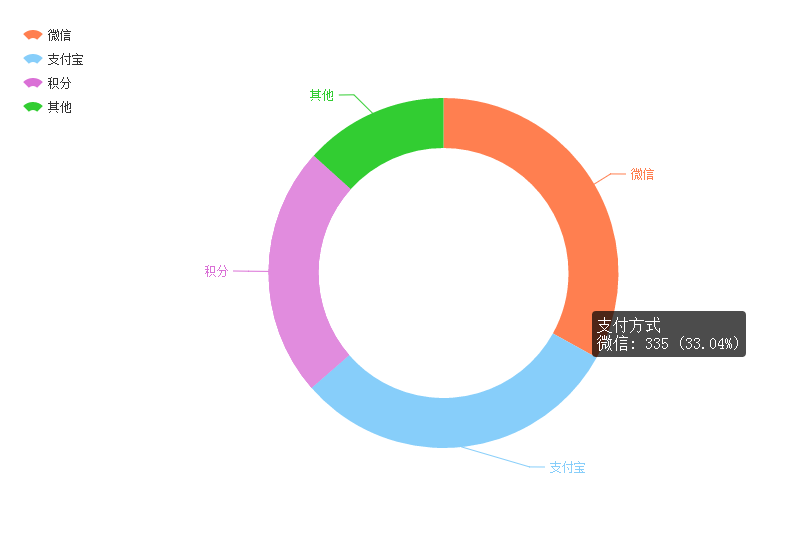
    <!DOCTYPE html>
    <head>
        <meta charset="utf-8">
        <title>支付方式统计</title>
        <style>
            #main {
                margin: 30px;
            }
        </style>
    </head>
    
    <body>
        <!-- 为ECharts准备一个具备大小(宽高)的Dom -->
        <div id="main" style="height:500px"></div>
        <!-- ECharts单文件引入 -->
        <script src="http://echarts.baidu.com/build/dist/echarts.js"></script>
        <script type="text/javascript">
            // 路径配置
            require.config({
                paths: {
                    echarts: 'http://echarts.baidu.com/build/dist'
                }
            });
            
            // 使用
            require(
                [
                    'echarts',
                    'echarts/chart/pie' // 使用柱状图就加载bar模块,按需加载
                ],
                function (ec) {
                    // 基于准备好的dom,初始化echarts图表
                    var myChart = ec.init(document.getElementById('main')); 
                    
                    option = {
                        tooltip: {
                            trigger: 'item',
                            formatter: "{a} <br/>{b}: {c} ({d}%)"
                        },
                        legend: {
                            orient: 'vertical',
                            x: 'left',
                            data:['微信','支付宝','积分','其他']
                        },
                        series: [
                            {
                                name:'支付方式',
                                type:'pie',
                                radius: ['50%', '70%'],
                                avoidLabelOverlap: false,
                                label: {
                                    normal: {
                                        show: false,
                                        position: 'center'
                                    },
                                    emphasis: {
                                        show: true,
                                        textStyle: {
                                            fontSize: '30',
                                            fontWeight: 'bold'
                                        }
                                    }
                                },
                                labelLine: {
                                    normal: {
                                        show: false
                                    }
                                },
                                data:[
                                    {value:'{sh:$payment.weixin}', name:'微信'},
                                    {value:'{sh:$payment.alipay}', name:'支付宝'},
                                    {value:'{sh:$payment.integral}', name:'积分'},
                                    {value:'{sh:$payment.other}', name:'其他'}
                                ]
                            }
                        ]
                    };
            
                    // 为echarts对象加载数据 
                    myChart.setOption(option); 
                }
            );
        </script>
    </body>
    

    获取相关数据

    <?php
    /**
     * 支付方式管理
     */
    class PaymentAction extends AgentAction{
    	protected function _initialize() {
    		parent::_initialize();
    	}
    	
        // 付款方式统计
    	public function index(){
            // 统计订单的支付方式
            $orderModel = D('Order');
            $payment['weixin'] = $orderModel->getPaytypeOrderNum('weixin');
            $payment['alipay'] = $orderModel->getPaytypeOrderNum('alipay');
            $payment['integral'] = $orderModel->getPaytypeOrderNum('integral');
            $payment['other'] = $orderModel->getPaytypeOrderNum();
    
            $this->assign('payment',$payment);
            $this->display();
        }
    }
    ?>
    

  • 相关阅读:
    化DataSet对象并压缩
    数据库连接
    触发器
    事务
    关于C语言的宏
    GCC中的一些参数
    《tkinter实用教程六》tkinter ttk.Label 控件
    《tkinter实用教程三》ttk.Button 控件
    5. 替换空格
    《tkinter实用教程二》ttk 子模块
  • 原文地址:https://www.cnblogs.com/jiqing9006/p/5736135.html
Copyright © 2020-2023  润新知