import pandas as pd
import numpy as np
import seaborn as sns
import matplotlib
import matplotlib.pyplot as plt
from scipy.stats import skew
from scipy.stats.stats import pearsonr
%config InlineBackend.figure_format = 'retina'
%matplotlib inline
一、kdeplot(核密度估计图)
核密度估计(kernel density estimation)是在概率论中用来估计未知的密度函数,属于非参数检验方法之一。通过核密度估计图可以比较直观的看出数据样本本身的分布特征。
x=np.random.randn(100) #随机生成100个符合正态分布的数
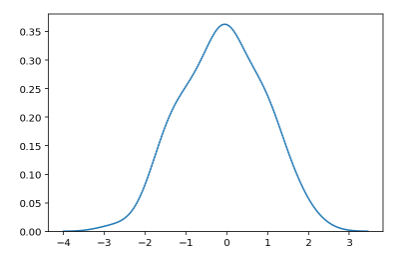
sns.kdeplot(x)

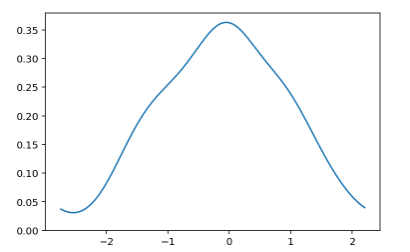
sns.kdeplot(x,cut=0) #cut:参数表示绘制的时候,切除带宽往数轴极限数值的多少(默认为3)

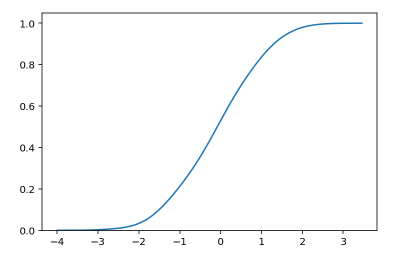
sns.kdeplot(x,cumulative=True)#cumulative :是否绘制累积分布

sns.kdeplot(x,cumulative = True,shade=True,color = 'r')
#shade:若为True,则在kde曲线下面的区域中进行阴影处理,color控制曲线及阴影的颜色

sns.kdeplot(x,cumulative = True,shade=True,color = 'r',vertical = True)#vertical:表示以X轴进行绘制还是以Y轴进行绘制

二元Kde图像
y=np.random.randn(100)
sns.kdeplot(x,y,shade=True,cbar = True)#cbar:参数若为True,则会添加一个颜色棒(颜色帮在二元kde图像中才有)

二、distplot()
displot()集合了matplotlib的hist()与核函数估计kdeplot的功能,增加了rugplot分布观测条显示与利用scipy库fit拟合参数分布的新颖用途。直方图又称质量分布图,它是表示资料变化情况的一种主要工具。用直方图可以解析出资料的规则性,比较直观地看出产品质量特性的分布状态,对于资料分布状况一目了然,便于判断其总体质量分布情况。直方图表示通过沿数据范围形成分箱,然后绘制条以显示落入每个分箱的观测次数的数据分布。
sns.distplot(x,color="g")

通过hist和kde参数调节是否显示直方图及核密度估计(默认hist,kde均为True)
fig,axes = plt.subplots(1,3)
sns.distplot(x,ax = axes[0])                #左图 参数ax= 把图形放在哪个框里
sns.distplot(x,hist = False ,ax = axes[1]) #中图
sns.distplot(x,kde = False, ax = axes[2])  #右图

bins:int或list,控制直方图的划分
fig,axes = plt.subplots(1,2)
sns.distplot(x,kde = False,bins = 20,ax = axes[0]) #kde=False 纵轴表示的时频数不再是频率
sns.distplot(x,kde = False,bins = [x for x in range(4)],ax = axes[1])

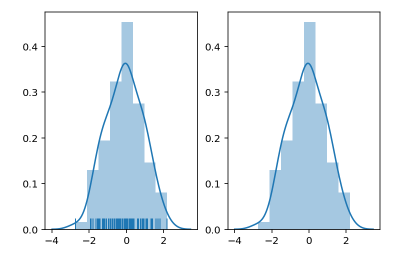
rug:控制是否生成观测数值的小细条
fig,axes = plt.subplots(1,2)
sns.distplot(x,rug=True,ax = axes[0]) #左图
sns.distplot(x,ax = axes[1])           #右图

fit:控制拟合的参数分布图形,能够直观地评估它与观察数据的对应关系(黑色线条为确定的分布)
from scipy.stats import *
sns.distplot(x,hist = False,fit =norm) #fit = norm 拟合正态分布

? hist_kws, kde_kws, rug_kws, fit_kws参数接收字典类型,可以自行定义更多高级的样式
sns.distplot(x,kde_kws={"label":"KDE"},vertical=True,color="y")

?norm_hist:若为True, 则直方图高度显示密度而非计数(含有kde图像中默认为True)
fig,axes=plt.subplots(1,2)
sns.distplot(x,norm_hist=True,kde=False,ax=axes[0]) #左图
sns.distplot(x,kde=False,ax=axes[1]) #右图
