参考:
1、《Python机器学习:预测分析核心算法》 P258-P266
1 import numpy
2
3 #from sklearn.cross_validation import train_test_split
4 from sklearn.model_selection import train_test_split
5
6 #这里是可以用来构建GradientBoostingRegressor模型
7 from sklearn import ensemble
8 from sklearn.metrics import mean_squared_error
9 import pylab as plot
1 # 从本机读取数据
2 target_file = open('winequality-red.csv','r')
3 data = target_file.readlines()
4 target_file.close()
 1 #整理原始数据,将原始数据分为属性列表(xList),标签列表(labels)
 2 #将各个属性的名称存入names列表
 3 xList = []
 4 labels = []
 5 names = []
 6 firstLine = True
 7 for line in data:
 8     if firstLine:
 9         names = line.strip().split(";")
10         firstLine = False
11     else:
12         #split on semi-colon
13         row = line.strip().split(";")
14         #put labels in separate array
15         labels.append(float(row[-1]))
16         #remove label from row
17         row.pop()
18         #convert row to floats
19         floatRow = [float(num) for num in row]
20         xList.append(floatRow)
21
22 #计算属性列表的行数和列数
23 nrows = len(xList)
24 ncols = len(xList[0])
1 #将各列表转为numpy数组形式,此形式是RandomForestRegressor的要求
2 #并且这些对象可以使用sklearn的train_test_split构建训练和测试集
3 X = numpy.array(xList)
4 y = numpy.array(labels)
5 wineNames = numpy.array(names)
1 #构建test集为30%规模的训练集和测试集
2 #random_state设置为一个特殊整数,而不是让随机数生成器自己选择一个不可重复的内部值
3 #这样重复代码可以获得同样的结果,便于开发阶段的调整,否则随机性会掩盖所做的改变
4 #固定random_state就固定了测试集,会对测试数据集过度训练
5 #take fixed holdout set 30% of data rows
6 xTrain, xTest, yTrain, yTest = train_test_split(X, y, test_size=0.30, random_state=531)
 1 # Train gradient boosting model to minimize mean squared error
 2
 3 #对梯度提升法参数设置和调整的建议:
 4 #1、除了设置subsample为0.5的情况,其他情况都以缺省值开始训练。
 5 #2、模型训练完成后,观察模型在测试数据(out_of_sample, oos)下的预测性能与决策树数目的关系及变化。
 6 #3、如果测试数据性能在图的右侧迅速提高,增加n_estimators或者learning_rate
 7 #4、如果测试数据性能在图的右侧迅速恶化,则减少learning_rate
 8 #5、一旦测试数据的性能曲线在整体都有改善,并且图的右侧基本持平,则尝试改变max_depth和max_features
 9
10 nEst = 2000
11 depth = 7
12 learnRate = 0.01
13 subSamp = 0.5
14
15 wineGBMModel = ensemble.GradientBoostingRegressor(n_estimators=nEst,
16                                                   max_depth=depth,
17                                                   learning_rate=learnRate,
18                                                   subsample = subSamp,
19                                                   loss='ls')
20
21 wineGBMModel.fit(xTrain, yTrain)
运行后显示:
GradientBoostingRegressor(alpha=0.9, ccp_alpha=0.0, criterion='friedman_mse',
                          init=None, learning_rate=0.01, loss='ls', max_depth=7,
                          max_features=None, max_leaf_nodes=None,
                          min_impurity_decrease=0.0, min_impurity_split=None,
                          min_samples_leaf=1, min_samples_split=2,
                          min_weight_fraction_leaf=0.0, n_estimators=2000,
                          n_iter_no_change=None, presort='deprecated',
                          random_state=None, subsample=0.5, tol=0.0001,
                          validation_fraction=0.1, verbose=0, warm_start=False)
 1 # compute mse on test set
 2 msError = []
 3 #利用迭代器staged_predict观察测试数据误差与决策树数目的关系
 4 predictions = wineGBMModel.staged_predict(xTest)
 5 for p in predictions:
 6     msError.append(mean_squared_error(yTest, p))
 7
 8 print("MSE" )
 9 print(min(msError))
10 print(msError.index(min(msError)))
运行后显示:
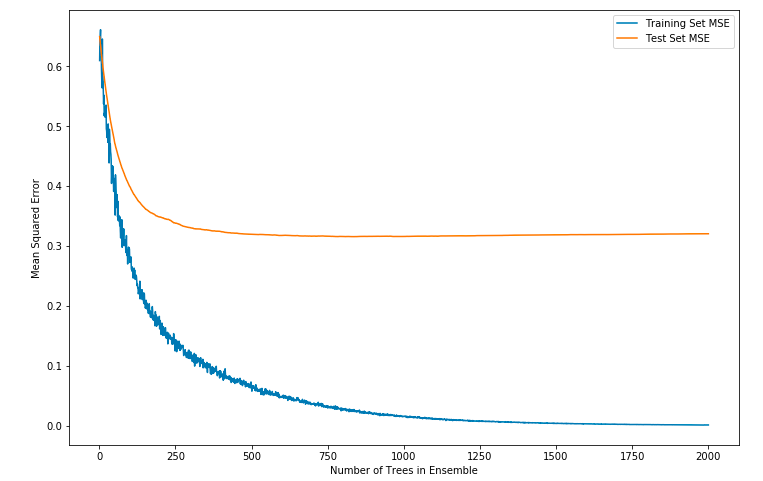
MSE
0.3155227031463733
826
1 #plot training and test errors vs number of trees in ensemble
2 plot.figure(figsize=(12,8))
3 plot.plot(range(1, nEst + 1), wineGBMModel.train_score_, label='Training Set MSE')
4 plot.plot(range(1, nEst + 1), msError, label='Test Set MSE')
5 plot.legend(loc='upper right')
6 plot.xlabel('Number of Trees in Ensemble')
7 plot.ylabel('Mean Squared Error')
8 plot.show()
运行后显示:
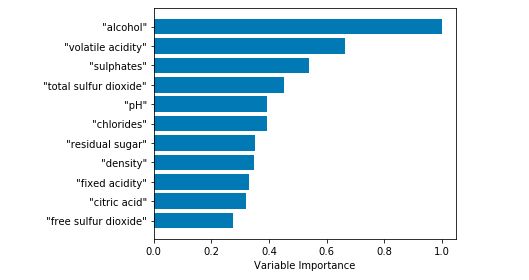
 1 # Plot feature importance
 2 featureImportance = wineGBMModel.feature_importances_
 3
 4 # normalize by max importance
 5 featureImportance = featureImportance / featureImportance.max()
 6 idxSorted = numpy.argsort(featureImportance)
 7 barPos = numpy.arange(idxSorted.shape[0]) + .5
 8 plot.barh(barPos, featureImportance[idxSorted], align='center')
 9 plot.yticks(barPos, wineNames[idxSorted])
10 plot.xlabel('Variable Importance')
11 plot.subplots_adjust(left=0.2, right=0.9, top=0.9, bottom=0.1)
12 plot.show()
运行后显示: