使用DOT语言和Graphviz绘图(翻译)
简述
本文翻译自Drawing Graphs using Dot and Graphviz
1. 许可
Copyright (C) 2013, 2014 Tony Ballantyne. Permission is granted to copy, distribute and/or modify this document under the terms of the GNU Free Documentation License, Version 1.3 or any later version published by the Free Software Foundation; with no Invariant Sections, no Front-Cover Texts, and no Back-Cover Texts.
Code in this document is free software: you can redistribute it and/or modify it under the terms of the GNU General Public License as published by the Free Software Foundation, either version 3 of the License, or (at your option) any later version.
This code is distributed in the hope that it will be useful, but WITHOUT ANY WARRANTY; without even the implied warranty of MERCHANTABILITY or FITNESS FOR A PARTICULAR PURPOSE. See the GNU General Public License for more details.
2. 介绍
2.1 什么是DOT?
DOT是纯文本图像描述语言,对于计算机和人来说,都很容易阅读。
2.2 什么是Graphviz?
Graphviz是一个开源的图像可视化的软件,所谓图像可视化就是使用一种简单的方法,来将结构化的信息表现成用抽象图片和网络构成的示意图。
2.3 谁适合看这篇文章?
这篇文章本来是我写来给自己当速成手册看的。不过现在看起来已经被我弄成给学计算机的学生看的教程了。现在这篇文章可以给任何想通过例子学习DOT的人看。
2.4 相关材料
我博客还有类似的其他文章TonyBallantyne.com/tech
如果你是想了解关于我作为一名SF and Fantasy writer的工作,但不幸点到这篇文章的话,下面的链接可能就对你比较有用:
- TonyBallantyne.com: 这里有我的小说和短故事
- Emacs Tutorial: 给作家的一个关于Emacs的简短介绍
- My Emacs Writing Setup: 关于我如何使用Emacs的Org Mode来写小说和短故事
译注:这儿所谓的相关材料其实是作者自己其他的一些文章,跟DOT关系不大
3. 安装
如果你要顺着这个教程继续下去,那你可能就需要要装Graphviz套件了。Graphviz可以在官网免费下载。
4. 基础例子
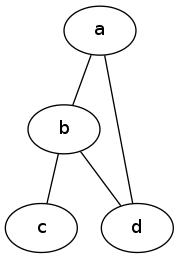
4.1 简单图例
graph graphname {
    a -- b;
    b -- c;
    b -- d;
    d -- a;
}
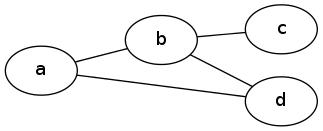
4.2 一样的图,不一样的布局
graph graphname {
    rankdir=LR;  //Rank Direction Left to Right
    a -- b;
    b -- c;
    b -- d;
    d -- a;
}
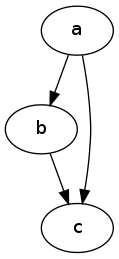
4.3 简单有向图
digraph graphname{
    a -> b;
    b -> c;
    a -> c;
}
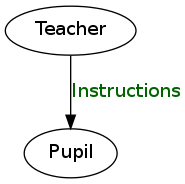
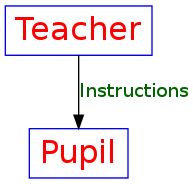
4.4 带标签的简单有向图
digraph graphname{

    T [label="Teacher"]      // node T
    P [label="Pupil"]  // node P

    T->P [label="Instructions", fontcolor=darkgreen] // edge T->P
}
4.5 同样的图,不同的形状和颜色
digraph graphname {
    T [label="Teacher" color=Blue, fontcolor=Red, fontsize=24, shape=box]      // node T
    P [label="Pupil" color=Blue, fontcolor=Red, fontsize=24, shape=box]  // node P

    T->P [label="Instructions", fontcolor=darkgreen] // edge T->P
}
这儿你可以选择的形状有: box, polygon, ellipse, oval, circle, point, egg, triangle, plaintext, diamond, trapezium, parallelogram, house, pentagon, hexagon, septagon, octagon, doublecircle, doubleoctagon, tripleoctagon 更多的形状看这里
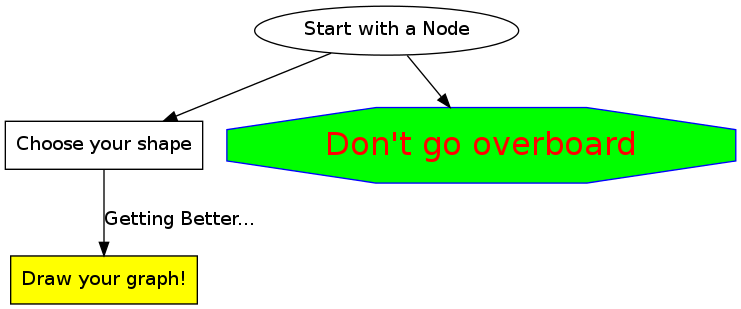
4.6 总结
digraph summary{
    start [label="Start with a Node"]
    next [label="Choose your shape", shape=box]
    warning [label="Don't go overboard", color=Blue, fontcolor=Red,fontsize=24,style=filled, fillcolor=green,shape=octagon]
    end [label="Draw your graph!", shape=box, style=filled, fillcolor=yellow]

    start->next
    start->warning
    next->end [label="Getting Better...", fontcolor=darkblue]
}
5. 高级
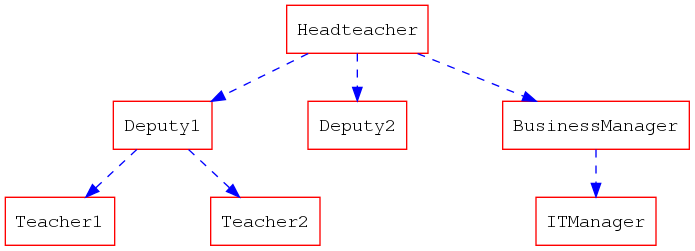
5.1 节省时间的技巧
单独地去定义每一个节点其实很浪费时间的,下面这个技巧能够让你快点儿。
digraph hierarchy {

    nodesep=1.0 // increases the separation between nodes

    node [color=Red,fontname=Courier,shape=box] //All nodes will this shape and colour
    edge [color=Blue, style=dashed] //All the lines look like this

    Headteacher->{Deputy1 Deputy2 BusinessManager}
    Deputy1->{Teacher1 Teacher2}
    BusinessManager->ITManager
    {rank=same;ITManager Teacher1 Teacher2}  // Put them on the same level
}
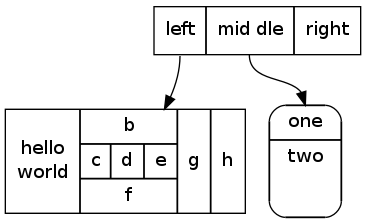
5.2 记录
你现在可以用HTML来定义这一类节点了,这里有更多相关信息。
digraph structs {
    node[shape=record]
    struct1 [label="<f0> left|<f1> mid dle|<f2> right"];
    struct2 [label="{<f0> one|<f1> two


}" shape=Mrecord];
    struct3 [label="hello
world |{ b |{c|<here> d|e}| f}| g | h"];
    struct1:f1 -> struct2:f0;
    struct1:f0 -> struct3:f1;
}
6. 例子
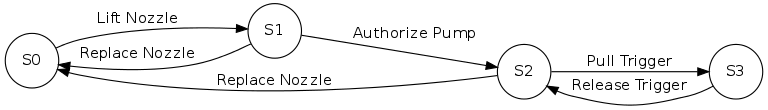
6.1 有限状态机
digraph finite_state_machine {
    rankdir=LR;
    size="8,5"
    node [shape = circle];
    S0 -> S1 [ label = "Lift Nozzle" ]
    S1 -> S0 [ label = "Replace Nozzle" ]
    S1 -> S2 [ label = "Authorize Pump" ]
    S2 -> S0 [ label = "Replace Nozzle" ]
    S2 -> S3 [ label = "Pull Trigger" ]
    S3 -> S2 [ label = "Release Trigger" ]
}
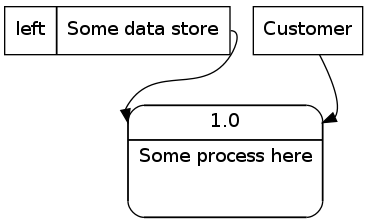
6.2 数据流示意图
digraph dfd{
    node[shape=record]
    store1 [label="<f0> left|<f1> Some data store"];
    proc1 [label="{<f0> 1.0|<f1> Some process here


}" shape=Mrecord];
    enti1 [label="Customer" shape=box];
    store1:f1 -> proc1:f0;
    enti1-> proc1:f0;
}
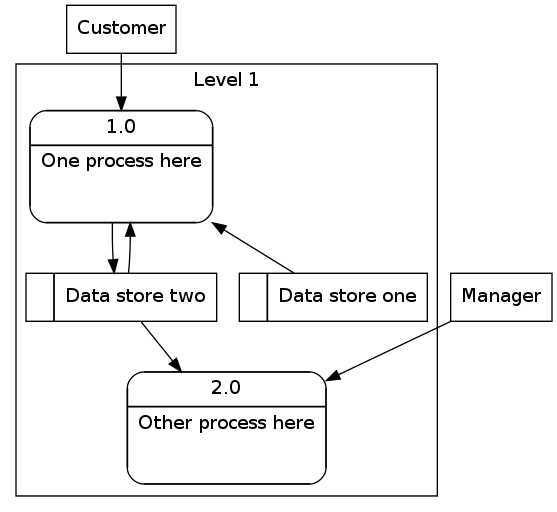
6.3 数据流示意图2
digraph dfd2{
    node[shape=record]
    subgraph level0{
    enti1 [label="Customer" shape=box];
    enti2 [label="Manager" shape=box];
    }
    subgraph cluster_level1{
                    label ="Level 1";
                    proc1 [label="{<f0> 1.0|<f1> One process here


}" shape=Mrecord];
                    proc2 [label="{<f0> 2.0|<f1> Other process here


}" shape=Mrecord];
                    store1 [label="<f0>    |<f1> Data store one"];
                    store2 [label="<f0>   |<f1> Data store two"];
                    {rank=same; store1, store2}

    }
    enti1 -> proc1
    enti2 -> proc2
    store1 -> proc1
    store2 -> proc2
    proc1 -> store2
    store2 -> proc1
}
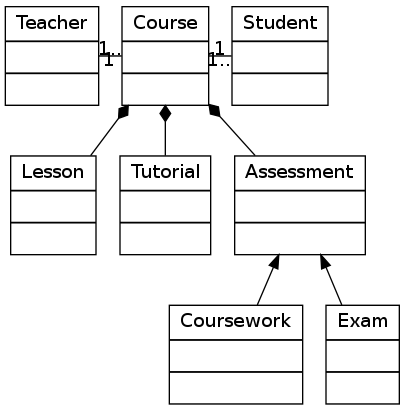
6.4 对象继承
digraph obj{
    node[shape=record];
    rankdir="BT";

    teacher [label = "{<f0> Teacher|<f1>
  |<f2>
   }"];
    course [label = "{<f0> Course|<f1>
  |<f2>
   }"];
    student [label = "{<f0> Student|<f1>
  |<f2>
   }"];
    lesson [label = "{<f0> Lesson |<f1>
  |<f2>
   }"];
    tutorial [label = "{<f0> Tutorial|<f1>
  |<f2>
   }"];
    assessment[label = "{<f0> Assessment|<f1>
  |<f2>
   }"];
    coursework [label = "{<f0> Coursework|<f1>
  |<f2>
   }"];
    exam [label = "{<f0> Exam|<f1>
  |<f2>
   }"];

    {rank=same; teacher course student}

    teacher->course [dir="forward",arrowhead="none",arrowtail="normal",headlabel="1",taillabel="1.."];
    student->course [dir="forward",arrowhead="none",arrowtail="normal",headlabel="1",taillabel="1.."];
    lesson->course [dir="forward",arrowhead="diamond",arrowtail="normal"];
    tutorial->course [dir="forward",arrowhead="diamond",arrowtail="normal"];
    assessment->course [dir="forward",arrowhead="diamond",arrowtail="normal"];
    coursework->assessment;
    exam->assessment;
}
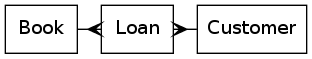
6.5 关系型实体
digraph ER{
    node[shape=box];
    Book;
    Customer;
    Loan;
    {rank=same;Book,Customer,Loan}
    Book->Loan[dir="forward",arrowhead="crow",arrowtail="normal"];
    Customer->Loan[dir="forward",arrowhead="crow",arrowtail="normal"];
}
7. 参考
以下可能是你在画图时候最有用的一些属性,完整的列表可以在这里看。
7.1 图像属性
    label="My Graph";       # 给图像设置标签

    rankdir=LR;             # 将图片由原来的从上到下布局变成从左到右布局

    {rank=same; a, b, c }   # 将一组元素放到同一个level

    splines="line";         # 让边框变为直线,没有曲线和锐角

    K=0.6;                  # 用来在布局中影响spring属性,spring属性可以用于将节点往外推,这个在twopi和sfdp布局中很有用。
译注:暂时还没明白这个spring属性应该怎么翻,初步猜测是弹性。胡克定律里面的常量名也叫K。
7.2 交点属性
    [label="Some Label"]    # 给交点打标签

    [color="red"]           # 给交点上色

    [fillcolor="blue"]      # 设置交点的填充色
7.3 边的属性
    [label="Some Label"]    # 给边设置标签 (设置路径权重的时候很有用)

    [color="red"]           # 给交点上色 (标示路径的时候很有用)

    [penwidth=2.0]          # 给边适配厚度,标示路径的时候很有用。
7.4 尺寸, 背景颜色
    fixedsize=true;
    size="1,1";
    resolution=72;
    bgcolor="#C6CFD532";

    # 不是我偷懒不翻译哦,原文就没有解释。
8. 附录
8.1 拓展阅读
An Introduction to GraphViz and dot
Graphviz Examples and Tutorial
8.2 使用Emacs的Org Mode
Emacs的Org Mode不管对于写作,还是执行和导出DOT图片都是个很理想的工作环境。
8.2.1 配置
下载并安装Graphviz,然后把相关路径加到exec-path这个变量里去。
你也要把你的.emacs文件更新成能够把DOT作为babel语言加载,下面这个配置可以很容易的设置DOT为babel语言,其他语言也可以类似操作
(org-babel-do-load-languages
    (quote org-babel-load-languages)
    (quote
        (
            (emacs-lisp . t)
            (java . t)
            (dot . t)
            (ditaa . t)
            (R . t)
            (python . t)
            (ruby . t)
            (gnuplot . t)
            (clojure . t)
            (sh . t)
            (ledger . t)
            (org . t)
            (plantuml . t)
            (latex . t)
        )
    )
)
8.2.2 将Dot嵌入Emacs
Org Mode通过使用Library of Babel来解析各种语言。要想这么做的话,就用begin_src和end_src标签把你的dot代码想下面这样包含进去。你也需要在包裹的时候像下面那样添加一些命令行参数。
用<s[TAB]快捷键可以快速生成一个begin_src代码块。
#+begin_src dot :file ./img/example1.png :cmdline -Kdot -Tpng
graph graphname {
                a -- b;
                b -- c;
                b -- d;
                d -- a;
        }
#+end_src
8.2.3 命令行相关
#+begin_ src dot :file ./img/example1.png :cmdline -Kdot -Tpng里的:cmdline -Kdot -Tpng就是命令行参数. 他们告诉dot如何渲染和展示。
-Kdot使用dot布局方式. 你也可以尝试其他的布局方式,比如Kneato,Kcirco,Ktwopi,Kfdp,Ksfdp-Tpng渲染成png格式
完整的命令行参数可以看这里
Date: <2013-10-21 Mon>
Author: Tony Ballantyne
Translator: Casa Taloyum
Created: 2014-04-12 Sat 10:13
Emacs 23.3.1 (Org mode 8.0.2)
评论系统我用的是Disqus,不定期被墙。所以如果你看到文章下面没有加载出评论列表,翻个墙就有了。
本文遵守CC-BY。 请保持转载后文章内容的完整,以及文章出处。本人保留所有版权相关权利。
我的博客拒绝挂任何广告,如果您觉得文章有价值,可以通过支付宝扫描下面的二维码捐助我。