流失预测是个重要的业务,通过预测哪些客户可能取消对服务的订阅来最大限度地减少客户流失。虽然最初在电信行业使用,但它已经成为银行,互联网服务提供商,保险公司和其他垂直行业的通用业务。
预测过程是大规模数据的驱动,并且经常结合使用先进的机器学习技术。在本篇文章中,我们将看到通常使用的哪些类型客户数据,对数据进行一些初步分析,并生成流失预测模型 - 所有这些都是通过Spark及其机器学习框架来完成的。
使用数据科学更好地理解和预测客户行为是一个迭代过程,其中涉及:
1.发现和模型创建:
- 分析历史数据。
- 由于格式,大小或结构,传统分析或数据库不能识别新数据源。
- 收集,关联和分析跨多数据源的数据。
- 认识并应用正确的机器学习算法来从数据中获取价值。
2.在生产中使用模型进行预测。
3.使用新数据发现和更新模型。

为了了解客户,可以分析许多特征因素,例如:
- 客户人口统计数据(年龄,婚姻状况等)。
- 社交媒体的情感分析。
- 客户习惯模式和地理使用趋势。
- 标记数据。
- 从点击流日志中分析浏览行为。
- 支持呼叫中心统计
- 显示行为模式的历史数据。
通过这种分析,电信公司可以获得预测和增强客户体验,防止客户流失和定制营销活动。
分类
分类是一系列有监督的机器学习算法,其基于已知项目的标记特征(即,已知是欺诈的交易)来识别项目属于哪个类别(即交易是否是欺诈)。分类采用已知标签和预定特征的一组数据,并学习如何基于该标记信息应用与新记录。特征就是你问的“问题”。标签是这些问题的答案。在下面的例子中,如果它像鸭子一样走路,游泳,嘎嘎叫,那么标签就是“鸭子”。

我们来看一个电信客户流失的例子:
- 我们试图预测什么?
- 客户是否有很高的服务退订概率。
- 流失被标记为“真”或“假”。
- 什么是“问题”或你可以用属性来做出预测?
- 来电统计,客服电话等
- 要构建分类器模型,需要提取最有助于分类的有利的特征。
决策树
决策树根据几个输入特征预测类或标签来创建模型。决策树通过在每个节点处评估包含特征的表达式并根据答案选择到下一个节点的分支来工作。下面显示了一个可能的信用风险的决策树预测。特征问题是节点,答案“是”或“否”是树中到子节点的分支。
- 问题1:检查帐户余额是否> 200DM?
- 没有
- Q2:目前的就业年限是多少>1年?
- 没有
- 不可信

示例用例数据集
对于本教程,我们将使用Orange 电信公司流失数据集。它由已清理的客户活动数据(特征)和流失标签组成,标记客户是否取消订阅。数据可以从BigML的S3 bucket,churn-80和churn-20中获取。churn-80和churn-20两套是来自同一批次,但已被分成80/20的比例。我们将使用较大的集合进行训练和交叉验证,最后一组数据用于测试和模型性能评估。为方便起见,这两个数据集已包含在此存储库中的完整代码中。数据集有以下结构:
1. State: string

2. Account length: integer

3. Area code: integer

4. International plan: string

5. Voice mail plan: string

6. Number vmail messages: integer

7. Total day minutes: double

8. Total day calls: integer

9. Total day charge: double

10.Total eve minutes: double

11. Total eve calls: integer

12. Total eve charge: double

13. Total night minutes: double

14. Total night calls: integer

15. Total night charge: double

16. Total intl minutes: double

17. Total intl calls: integer

18. Total intl charge: double

19. Customer service calls: integer
CSV文件具有以下格式:
LA,117,408,No,No,0,184.5,97,31.37,351.6,80,29.89,215.8,90,9.71,8.7,4,2.35,1,False

IN,65,415,No,No,0,129.1,137,21.95,228.5,83,19.42,208.8,111,9.4,12.7,6,3.43,4,True
下图显示了数据集的前几行:

软件
本教程将在Spark 2.0.1及更高版本上运行。
- 您可以从这里下载代码和数据来运行这些示例。
- 这个帖子中的例子可以在启动spark-shell命令之后运行在Spark shell中。
- 您也可以将代码作为独立应用程序运行,如在MapR沙箱上启动Spark的教程中所述,使用用户名user01,密码mapr登录到MapR沙箱。使用scp 将示例数据文件复制到沙箱主目录/ user / user01下。用以下命令启动Spark shell: $
spark -shell --master local [1]
从CSV文件加载数据

首先,我们将导入SQL和机器学习包。
import org.apache.spark._

import org.apache.spark.sql.SparkSession

import org.apache.spark.sql.functions._

import org.apache.spark.sql.types._

import org.apache.spark.sql._

import org.apache.spark.sql.Dataset

import org.apache.spark.ml.Pipeline

import org.apache.spark.ml.classification.DecisionTreeClassifier

import org.apache.spark.ml.classification.DecisionTreeClassificationModel

import org.apache.spark.mllib.evaluation.BinaryClassificationMetrics

import org.apache.spark.ml.evaluation.BinaryClassificationEvaluator

import org.apache.spark.ml.feature.StringIndexer

import org.apache.spark.ml.tuning.ParamGridBuilder

import org.apache.spark.ml.tuning.CrossValidator

import org.apache.spark.ml.feature.VectorAssembler

我们使用Scala案例类和Structype来定义模式,对应于CSV数据文件中的一行。

// define the Churn Schema

case  class  Account(state: String, len: Integer, acode: String,

intlplan: String,  vplan: String,  numvmail: Double,

tdmins: Double,  tdcalls: Double,  tdcharge: Double,

temins: Double,  tecalls: Double,  techarge: Double,

tnmins: Double,  tncalls: Double,  tncharge: Double,

timins: Double,  ticalls: Double,  ticharge: Double,

numcs: Double,  churn: String)

val schema =StructType(Array(

          StructField("state", StringType,true),

          StructField("len", IntegerType,true),

          StructField("acode", StringType,true),

          StructField("intlplan", StringType,true),

          StructField("vplan", StringType,true),

          StructField("numvmail", DoubleType,true),

          StructField("tdmins", DoubleType,true),

          StructField("tdcalls", DoubleType,true),

          StructField("tdcharge", DoubleType,true),

          StructField("temins", DoubleType,true),

          StructField("tecalls", DoubleType,true),

          StructField("techarge", DoubleType,true),

          StructField("tnmins", DoubleType,true),

          StructField("tncalls", DoubleType,true),

          StructField("tncharge", DoubleType,true),

          StructField("timins", DoubleType,true),

          StructField("ticalls", DoubleType,true),

          StructField("ticharge", DoubleType,true),

          StructField("numcs", DoubleType,true),

          StructField("churn", StringType,true)

))
使用Spark 2.0,我们指定要加载到数据集中的数据源和模式。请注意,对于Spark 2.0,将数据加载到DataFrame中时指定模式将比模式推断提供更好的性能。我们缓存数据集以便快速重复访问。我们也打印数据集的模式。
val train: Dataset[Account]= spark.read.option("inferSchema","false")

.schema(schema).csv("/user/user01/data/churn-bigml-80.csv").as[Account]

train.cache

val test: Dataset[Account]= spark.read.option("inferSchema","false")

.schema(schema).csv("/user/user01/data/churn-bigml-20.csv").as[Account]

test.cache

train.printSchema()

root

|-- state:string(nullable =true)

|-- len:integer(nullable =true)

|-- acode:string(nullable =true)

|-- intlplan:string(nullable =true)

|-- vplan:string(nullable =true)

|-- numvmail:double(nullable =true)

|-- tdmins:double(nullable =true)

|-- tdcalls:double(nullable =true)

|-- tdcharge:double(nullable =true)

|-- temins:double(nullable =true)

|-- tecalls:double(nullable =true)

|-- techarge:double(nullable =true)

|-- tnmins:double(nullable =true)

|-- tncalls:double(nullable =true)

|-- tncharge:double(nullable =true)

|-- timins:double(nullable =true)

|-- ticalls:double(nullable =true)

|-- ticharge:double(nullable =true)

|-- numcs:double(nullable =true)

|-- churn:string(nullable =true)

//display the first 20 rows:

 train.show

摘要统计
Spark DataFrame包含一些用于统计处理的内置函数。describe()函数对所有数字列执行摘要统计的计算,并将其作为DataFrame形式返回。
train.describe()
输出:

数据探索
我们可以使用Spark SQL来研究数据集。以下是使用Scala DataFrame API的一些示例查询:
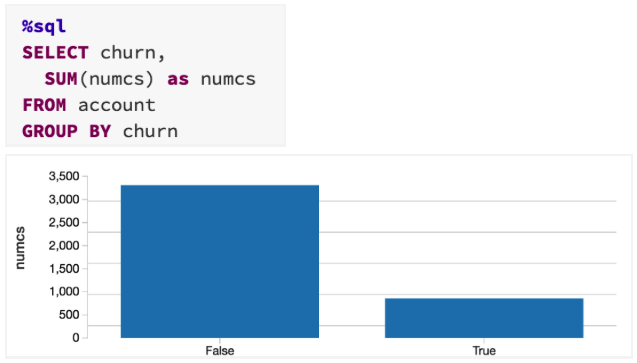
train.groupBy("churn").sum("numcs").show

+-----+----------+

|churn|sum(numcs)|

+-----+----------+

|False|3310.0|

| True|856.0|

+-----+----------+

train.createOrReplaceTempView("account")

spark.catalog.cacheTable("account")

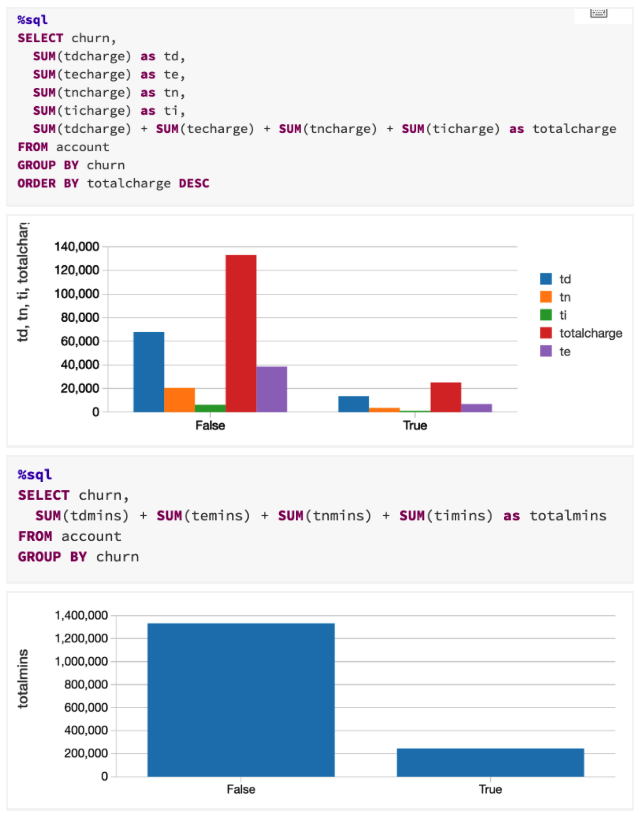
总日分钟数和总日费用是高度相关的领域。这样的相关数据对于我们的模型训练运行不会有利处,所以我们将会删除它们。我们将通过删除每个相关字段对中的一列,以及州和地区代码列,我们也不会使用这些列。
val dtrain =train.drop("state").drop("acode").drop("vplan")

.drop("tdcharge").drop("techarge")

根据churn 字段对数据进行分组并计算每个组中的实例数目,显示其中有大约是真实流失样本6倍的虚假流失样本。
dtrain.groupBy("churn").count.show

输出:

+-----+-----+

|churn|count|

+-----+-----+

|False|2278|

| True|388|

+-----+-----+
商业决策将被用来保住最有可能离开的客户,而不是那些可能留下来的客户。因此,我们需要确保我们的模型对Churn = True样本敏感。
分层抽样
我们可以使用分层采样将两个样本类型放在同一个基础上。DataFrames sampleBy() 函数在提供要返回的每个样本类型的分数时执行此操作。在这里,我们保留Churn = True类的所有实例,但是将Churn = False类下采样为388/2278分之一。
val fractions =Map("False"->.17,"True"->1.0)

val strain = dtrain.stat.sampleBy("churn", fractions, 36L)

strain.groupBy("churn").count.show
输出:
-----+-----+

|churn|count|

+-----+-----+

|False|379|

| True|388|

+-----+-----+
特征数组
要构建分类器模型,可以提取对分类贡献最大的特征。每个条目的特征由以下显示的字段组成:
- 标签 - 流失:真或假
- 特征 -
{“len”,“iplanIndex”,“numvmail”,“tdmins”,“tdcalls”,“temins”,“tecalls”,“tminmin”,“tncalls”,“timins”,“ticalls” }
为了使这些特征被机器学习算法使用,它们需变换并放入特征向量中,特征向量是代表每个特征值的数字的向量。

使用Spark ML包
在ML封装是机器学习程序的新库。Spark ML提供了在DataFrame上构建的统一的高级API集合。

我们将使用ML管道将数据通过变换器传递来提取特征和评估器以生成模型。
- 转换器(Transformer):将一个DataFrame转换为另一个DataFrame的算法。我们将使用变换器来获取具有特征矢量列的DataFrame。
- 估计器(Estimator):可以适合DataFrame生成变换器(例如,在DataFrame上进行训练/调整并生成模型)的算法。
- 管道:连接多个变换器和估算器,以指定一个ML工作流程。
特征提取和流水线
ML包需要将数据放入(label:Double,features:Vector) DataFrame格式并带有相应命名的字段。我们建立了一个流水线,通过三个转换器来传递数据 ,以此提取特征:2个StringIndexers 和1个 VectorAssembler。我们使用StringIndexers将String Categorial特性intlplan 和标签转换为数字索引。索引分类特征允许决策树适当地处理分类特征,提高性能。

// set up StringIndexer transformers for label and string feature

val ipindexer =newStringIndexer()

.setInputCol("intlplan")

.setInputCol("intlplan")

val labelindexer =newStringIndexer()

.setInputCol("churn")

.setOutputCol("label")

VectorAssembler 将一个给定的列表列成一个单一的特征向量列。

// set up a VectorAssembler transformer

val featureCols =Array("len","iplanIndex","numvmail","tdmins",

"tdcalls","temins","tecalls","tnmins","tncalls","timins",

"ticalls","numcs")

val assembler =newVectorAssembler()

.setInputCols(featureCols)

.setOutputCol("features")
我们管道中的最后一个元素是估计器(决策树分类器),对标签和特征向量进行训练。

// set up a DecisionTreeClassifier estimator

val dTree =newDecisionTreeClassifier().setLabelCol("label")

.setFeaturesCol("features")

// Chain indexers and tree in a Pipeline

val pipeline =newPipeline()

.setStages(Array(ipindexer, labelindexer, assembler, dTree))
训练模型

我们想确定决策树的哪个参数值产生最好的模型。模型选择的常用技术是k交叉验证,其中数据被随机分成k个分区。每个分区使用一次作为测试数据集,其余的则用于训练。然后使用训练集生成模型,并使用测试集进行评估,从而得到k个模型性能测量结果。考虑到构建参数,性能得分的平均值通常被认为是模型的总体得分。对于模型选择,我们可以搜索模型参数,比较它们的交叉验证性能。导致最高性能指标的模型参数产生最佳模型。
Spark ML支持使用变换/估计流水线进行k-fold交叉验证,以使用称为网格搜索的过程尝试不同的参数组合,在该过程中设置要测试的参数,并使用交叉验证评估器构建模型选择工作流程。
下面我们用一个 aramGridBuilder 来构造参数网格。
// Search through decision tree's maxDepth parameter for best model

val paramGrid =newParamGridBuilder().addGrid(dTree.maxDepth,

Array(2,3,4,5,6,7)).build()
我们定义一个BinaryClassificationEvaluator 计算器,通过比较测试标签列和测试预测列,它将根据精度度量来评估模型。默认度量标准是ROC曲线下的面积。
// Set up Evaluator (prediction, true label)

val evaluator =newBinaryClassificationEvaluator()

.setLabelCol("label")

.setRawPredictionCol("prediction")
我们使用一个CrossValidator 模型选择。在CrossValidator 使用管道评估,参数网格和分类评估。该CrossValidator 使用 ParamGridBuilder 遍历maxDepth 决策树的参数和评价模型,重复每个参数值三次以便于获得可靠的结果。
// Set up 3-fold cross validation

 val crossval =newCrossValidator().setEstimator(pipeline)

.setEvaluator(evaluator)

.setEstimatorParamMaps(paramGrid).setNumFolds(3)

val cvModel = crossval.fit(ntrain)
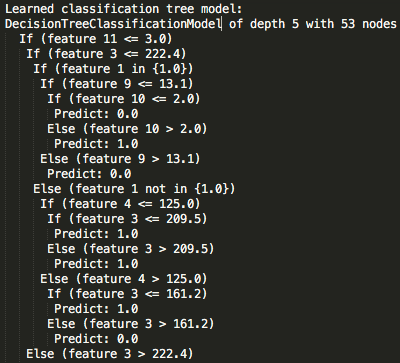
我们得到最佳的决策树模型,以便打印出决策树和参数。
// Fetch best model

val bestModel = cvModel.bestModel

val treeModel = bestModel.asInstanceOf[org.apache.spark.ml.PipelineModel]

.stages(3).asInstanceOf[DecisionTreeClassificationModel]

println("Learned classification tree model:
"+ treeModel.toDebugString)
输出:

//0-11 feature columns: len, iplanIndex, numvmail, tdmins, tdcalls, temins, //tecalls, tnmins, tncalls, timins, ticalls, numcs

println("Feature 11:"+featureCols(11))

println("Feature 3:"+featureCols(3))

Feature 11:numcs

Feature 3:tdmins
我们发现使用交叉验证过程产生的最佳树模型是树深度为5的模型。toDebugString() 函数提供树的决策节点和最终预测结果的打印。我们可以看到特征11和特征3用于决策,因此应该被认为具有高度的预测能力来确定客户流失的可能性。这些特征值映射到“ 客户服务电话 ”字段和“ 总分钟数”字段并不奇怪。决策树通常用于特征选择,因为它们提供了一个确定最重要特征(最接近树根的特征)的自动化机制。
预测和模型评估

模型的实际性能可以使用尚未用于任何训练或交叉验证活动的测试数据集来确定。我们将使用模型管道来转换测试集,这将根据相同的方法来映射特征。
val predictions = cvModel.transform(test)

计算器将为我们提供预测的分数,然后我们会将它们的概率打印出来。
val accuracy = evaluator.evaluate(predictions)

evaluator.explainParams()

val result = predictions.select("label","prediction","probability")

result.show
输出:
accuracy: Double =0.8484817813765183

metric name inevaluation(default: areaUnderROC)

在这种情况下,评估返回率为84.8%。预测概率可以非常有用地排列可能性的客户流失。这样,企业可用于保留的有限资源在适当的客户身上。
下面,我们计算一些更多的指标。错误/正确的正面和负面预测的数量也是有用的:
- 真正的好处是模型正确预测订阅取消的频率。
- 误报是模型错误地预测订阅取消的频率。
- 真正的否定表示模型正确预测不消除的频率。
- 假表示模型错误地预测不取消的频率。
val lp = predictions.select("label","prediction")

val counttotal = predictions.count()

val correct = lp.filter($"label"=== $"prediction").count()

val wrong = lp.filter(not($"label"=== $"prediction")).count()

val ratioWrong = wrong.toDouble / counttotal.toDouble

val ratioCorrect = correct.toDouble / counttotal.toDouble

val truep = lp.filter($"prediction"===0.0)

.filter($"label"=== $"prediction").count()/ counttotal.toDouble

val truen = lp.filter($"prediction"===1.0)

.filter($"label"=== $"prediction").count()/ counttotal.toDouble

val falsep = lp.filter($"prediction"===1.0)

.filter(not($"label"=== $"prediction")).count()/ counttotal.toDouble

val falsen = lp.filter($"prediction"===0.0)

.filter(not($"label"=== $"prediction")).count()/ counttotal.toDouble

println("counttotal : "+ counttotal)

println("correct : "+ correct)

println("wrong: "+ wrong)

println("ratio wrong: "+ ratioWrong)

println("ratio correct: "+ ratioCorrect)

println("ratio true positive : "+ truep)

println("ratio false positive : "+ falsep)

println("ratio true negative : "+ truen)

println("ratio false negative : "+ falsen)