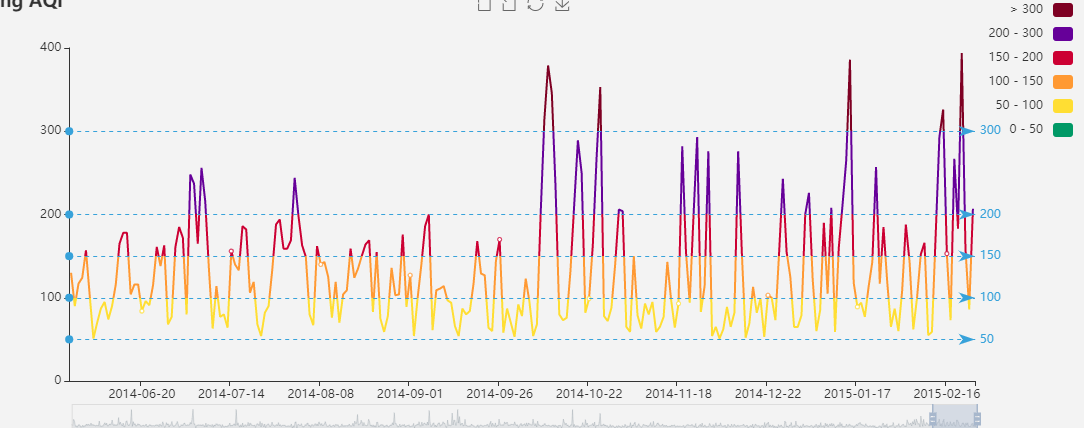
了解图表基本组成
用了v-charts, echarts, highcharts
应该来说highcharts文档最友好,
echarts人用的最多. vue中用的话,可调参数多.
v-charts文档贼烂. 不过可调参数少, 意味着简单.
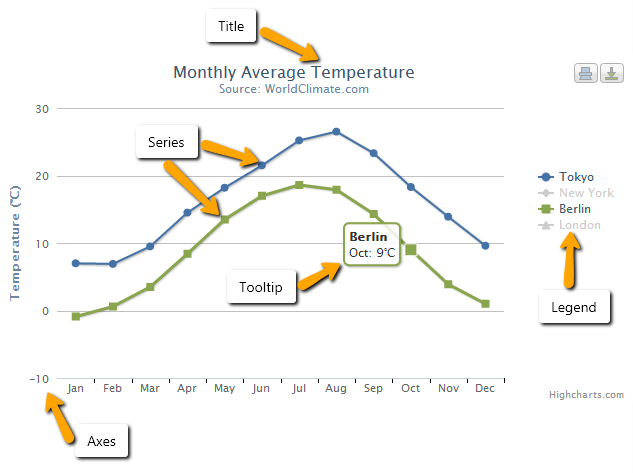
以下一张图的5个概念
Axes
x-Axes x轴
y-Axes y轴
What is a series?
A series is a set of data, for example a line graph or one set of columns. All data plotted on a chart comes from the series object. The series object has the structure:
data: [0, 5, 3, 5]
data: [[5, 2], [6, 3], [8, 2]]
data: [{
    name: 'Point 1',
    color: '#00FF00',
    y: 0
}, {
    name: 'Point 2',
    color: '#FF00FF',
    y: 5
}]
Legend图标
The legend displays the series in a chart with a predefined symbol and the name of the series. Series can be disabled and enabled from the legend.
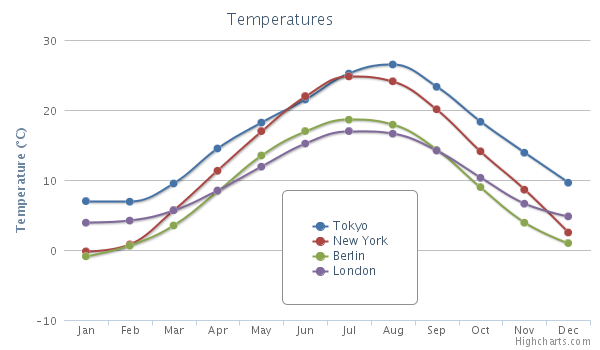
Tooltip
tooltip: {
    backgroundColor: '#FCFFC5',
    borderColor: 'black',
    borderRadius: 10,
    borderWidth: 3
}
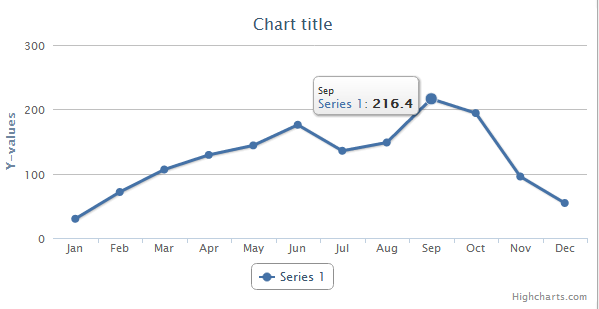
echart实例基础
先看下echart的基本用法
<!DOCTYPE html>
<html style="height: 100%">
<head>
  <meta charset="utf-8">
</head>
<body style="height: 100%; margin: 0">
<div id="container" style="height: 100%"></div>
<script type="text/javascript" src="https://cdn.jsdelivr.net/npm/echarts/dist/echarts.min.js"></script>
<script type="text/javascript" src="https://cdn.jsdelivr.net/npm/echarts/dist/extension/dataTool.min.js"></script>
<script type="text/javascript">
  var app = {}
  option = null
  option = {
    xAxis: {
      type: 'category',
      data: ['Mon', 'Tue', 'Wed', 'Thu', 'Fri', 'Sat', 'Sun']
    },
    yAxis: {
      type: 'value'
    },
    series: [{
      data: [820, 932, 901, 934, 1290, 1330, 1320],
      type: 'line'
    }]
  }
  var dom = document.getElementById('container')
  var myChart = echarts.init(dom)
  if (option && typeof option === 'object') {
    myChart.setOption(option, true)
  }
</script>
</body>
</html>
echarts api
var myChart = echarts.init(dom)
myChart.setOption(option, true)
其次看一下他的 api就明确怎么使用了
echarts

数据通过map成json
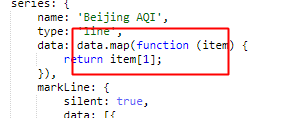
vue中使用echarts
其次就是看看echarts在vue中怎么用, 参照一下[]element admin](https://github.com/PanJiaChen/vue-element-admin/blob/master/src/views/dashboard/admin/components/LineChart.vue)如何封装chart的
<template>
  <div :class="className" :style="{height:height,width}" />
</template>

<script>
import echarts from 'echarts'
require('echarts/theme/macarons') // echarts theme
import resize from './mixins/resize'

export default {
  mixins: [resize],
  props: {
    className: {
      type: String,
      default: 'chart'
    },
     {
      type: String,
      default: '100%'
    },
    height: {
      type: String,
      default: '350px'
    },
    autoResize: {
      type: Boolean,
      default: true
    },
    chartData: {
      type: Object,
      required: true
    }
  },
  data() {
    return {
      chart: null
    }
  },
  watch: {
    chartData: {
      deep: true,
      handler(val) {
        this.setOptions(val)
      }
    }
  },
  mounted() {
    this.$nextTick(() => {
      this.initChart()
    })
  },
  beforeDestroy() {
    if (!this.chart) {
      return
    }
    this.chart.dispose()
    this.chart = null
  },
  methods: {
    initChart() {
      this.chart = echarts.init(this.$el, 'macarons')
      this.setOptions(this.chartData)
    },
    setOptions({ expectedData, actualData } = {}) {
      this.chart.setOption({
        xAxis: {
          data: ['Mon', 'Tue', 'Wed', 'Thu', 'Fri', 'Sat', 'Sun'],
          boundaryGap: false,
          axisTick: {
            show: false
          }
        },
        grid: {
          left: 10,
          right: 10,
          bottom: 20,
          top: 30,
          containLabel: true
        },
        tooltip: {
          trigger: 'axis',
          axisPointer: {
            type: 'cross'
          },
          padding: [5, 10]
        },
        yAxis: {
          axisTick: {
            show: false
          }
        },
        legend: {
          data: ['expected', 'actual']
        },
        series: [{
          name: 'expected', itemStyle: {
            normal: {
              color: '#FF005A',
              lineStyle: {
                color: '#FF005A',
                 2
              }
            }
          },
          smooth: true,
          type: 'line',
          data: expectedData,
          animationDuration: 2800,
          animationEasing: 'cubicInOut'
        },
        {
          name: 'actual',
          smooth: true,
          type: 'line',
          itemStyle: {
            normal: {
              color: '#3888fa',
              lineStyle: {
                color: '#3888fa',
                 2
              },
              areaStyle: {
                color: '#f3f8ff'
              }
            }
          },
          data: actualData,
          animationDuration: 2800,
          animationEasing: 'quadraticOut'
        }]
      })
    }
  }
}
</script>
