• echarts-多折线图


    1、问题背景

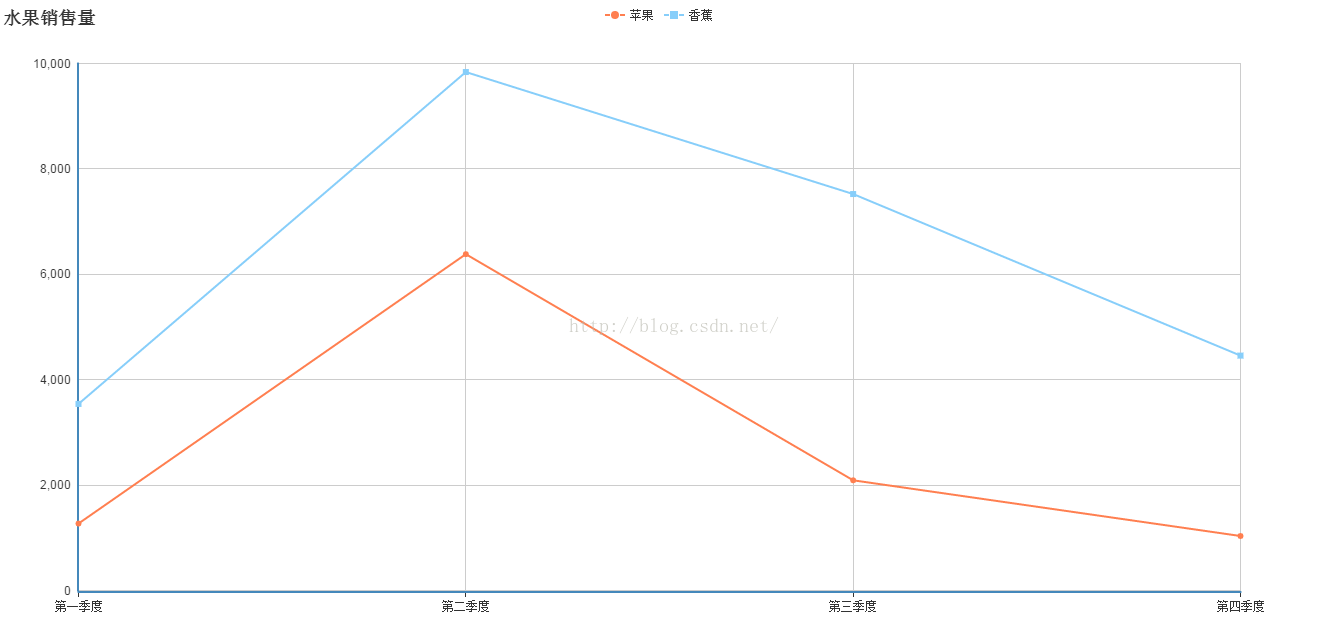
         设计一个折线图,折线图展示苹果、香蕉的销售量


    2、实现源码

    <!DOCTYPE html>
    <html>
    	<head>
    		<meta charset="UTF-8">
    		<title>echarts-多折线图</title>
    		<script type="text/javascript" src="../js/jquery-1.12.4.js" ></script>
    		<script type="text/javascript" src="../js/echarts-2.2.7/build/dist/echarts-all.js" ></script>
    		<style>
    			body,html{
    				 99%;
    				height: 99%;
    				font-family: "微软雅黑";
    				font-size: 12px;
    			}
    			#someline{
    				100%;
    				height:99%;
    			}
    		</style>
    		<script>
    			$(document).ready(function(){
    				var chart = document.getElementById("someline");
    				var echart = echarts.init(chart);
    				var option = {
    				    title: {
    				        text: '水果销售量'
    				    },
    				    tooltip : {
    				        trigger: 'axis'
    				    },
    				    legend: {
    				        data:['苹果','香蕉']
    				    },
    				    toolbox: {
    				        feature: {
    				            saveAsImage: {}
    				        }
    				    },
    				    grid: {
    				        left: '3%',
    				        right: '4%',
    				        bottom: '3%',
    				        containLabel: true
    				    },
    				    xAxis : [
    				        {
    				            type : 'category',
    				            boundaryGap : false,
    				            data : ['第一季度','第二季度','第三季度','第四季度']
    				        }
    				    ],
    				    yAxis : [
    				        {
    				            type : 'value'
    				        }
    				    ],
    				    series : [
    				        {
    				            name:'苹果',
    				            type:'line',
    				            stack: '销量',
    				            areaStyle: {normal: {}},
    				            data:[1270, 6382, 2091, 1034]
    				        },
    				        {
    				            name:'香蕉',
    				            type:'line',
    				            stack: '销量',
    				            areaStyle: {normal: {}},
    				            data:[2270, 3456, 5432, 3423]
    				        }
    				    ]
    				};
    				
    				echart.setOption(option);  
    
    			});
    		</script>
    	</head>
    	<body>
    		<div id="someline"></div>
    	</body>
    </html>
    

    3、实现结果


  • 相关阅读:
    Python学习——模块的基本知识
    Python学习-软件目录结构规范
    路径追踪的理论与实现:复合重要性采样
    路径追踪的理论与实现:渲染方程
    记一个C++随机数导致的bug
    Gamma矫正的原理和实现
    聊一聊Python的sort函数
    BVH树的构建与遍历
    Cocos动画系统
    Cocos事件分发系统
  • 原文地址:https://www.cnblogs.com/hzcya1995/p/13314155.html
Copyright © 2020-2023  润新知