一、写在前面
在阅读这篇文章之前,你可能需要了解 mapbox-gl regl glsl 相关的一些知识;这里给出的一些实现方法并不是完美的,可能会有一些 BUG 和疏漏,并不建议直接使用,仅做学习和参考。
本篇会提及两种实现方式,包含 2 维热力图和三维热力图的实现,也会给出一些优化的方案;地图类库上会涉及 mapbox-gl。
二、原理简介
- 我们大部分人可能知道在如何在 canvas 上实现热力图,比较出名的开源类库是
和 V神的
其基本原理是根据位置(coordinates)、绘制半径(radius)、权重(weight)绘制 circle生成密度图,再根据给定的 gradient colors 进行密度图的着色。他们实现的效果如下图:
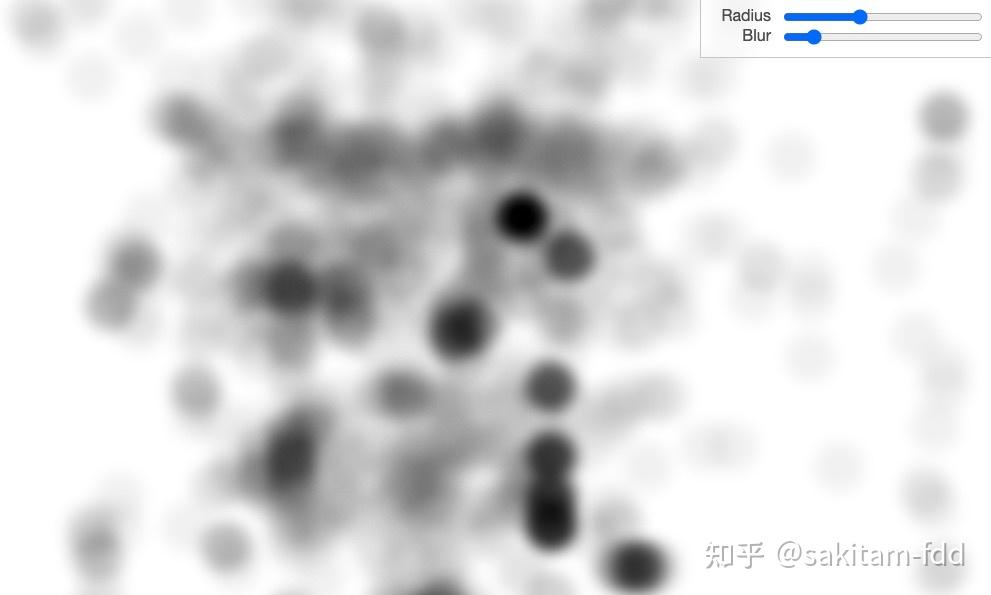
密度图
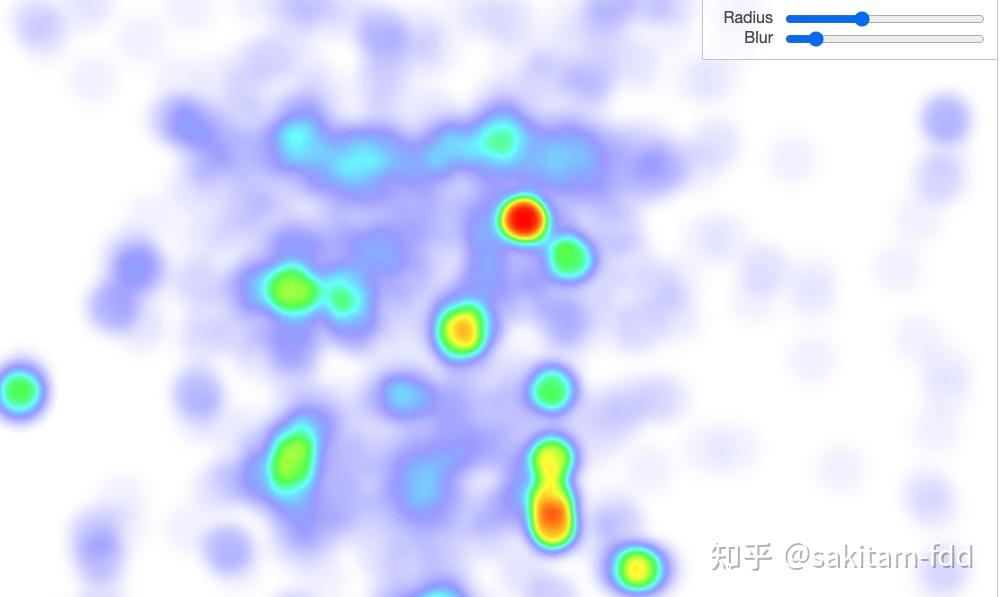
密度图着色
webgl 的热力图也基本遵循这个流程:先生成密度图,然后再进行密度图的着色,下面我们会深入具体的技术细节。
三、技术实现原理
先剖析 mapbox-gl 原版的技术实现,再用 regl 简单复刻一个
1、mapbox-gl 版 heatmap 实现
- 数据:mapbox 的数据加载流程我们这里不再细说,网上已经有很多关于这块的文章,我们主要关注数据块 heatmap_bucket 的实现, heatmap_bucket 又继承自 circle_bucket, heatmap的顶点数据和索引数据在这里进行处理,这里我们可以看一下addFeature 方法,此函数对矢量瓦片的数据做了一次处理,将每个点数据拆分为两个三角形;至于为什么需要拆分两个三角形合并的矩形,我们可以思考一下如果我们直接使用点会出现什么问题。
function addCircleVertex(layoutVertexArray, x, y, extrudeX, extrudeY) {
    layoutVertexArray.emplaceBack(
        (x * 2) + ((extrudeX + 1) / 2),
        (y * 2) + ((extrudeY + 1) / 2));
}

for (const ring of geometry) {
            for (const point of ring) {
                const x = point.x;
                const y = point.y;

                // Do not include points that are outside the tile boundaries.
                // 这里将越界的数据过滤掉,不进行渲染
                if (x < 0 || x >= EXTENT || y < 0 || y >= EXTENT) continue;

                // this geometry will be of the Point type, and we'll derive
                // two triangles from it.
                //
                // ┌─────────┐
                // │ 3     2 │
                // │         │
                // │ 0     1 │
                // └─────────┘
                const segment = this.segments.prepareSegment(4, this.layoutVertexArray, this.indexArray, feature.sortKey);
                const index = segment.vertexLength;

                // 顶点数据
                addCircleVertex(this.layoutVertexArray, x, y, -1, -1);
                addCircleVertex(this.layoutVertexArray, x, y, 1, -1);
                addCircleVertex(this.layoutVertexArray, x, y, 1, 1);
                addCircleVertex(this.layoutVertexArray, x, y, -1, 1);

                // 索引数据
                this.indexArray.emplaceBack(index, index + 1, index + 2);
                this.indexArray.emplaceBack(index, index + 3, index + 2);

                segment.vertexLength += 4;
                segment.primitiveLength += 2;
            }
        }

        this.programConfigurations.populatePaintArrays(this.layoutVertexArray.length, feature, index, {}, canonical);
    }
在上面代码中顶点数据最终都添加到 layoutVertexArray,我们追溯代码可以看到layoutVertexArray 是 CircleLayoutArray 的实例
class StructArrayLayout2i4 extends StructArray {
    uint8: Uint8Array;
    int16: Int16Array;

    _refreshViews() {
        this.uint8 = new Uint8Array(this.arrayBuffer);
        this.int16 = new Int16Array(this.arrayBuffer);
    }

    emplaceBack(v0: number, v1: number) {
        const i = this.length;
        this.resize(i + 1);
        return this.emplace(i, v0, v1);
    }

    emplace(i: number, v0: number, v1: number) {
        const o2 = i * 2;
        this.int16[o2 + 0] = v0;
        this.int16[o2 + 1] = v1;
        return i;
    }
}

export { StructArrayLayout2i4 as CircleLayoutArray }
你是否发现这里的顶点数据都是存在16 位整型中,这个是因为矢量瓦片会将经纬度编码到每个瓦片的 0-8192 范围中,而且这样也避免了常见的
问题。关于矢量瓦片你可以查看这里了解
关于渲染,我们可以在
这里看到热力图的整体渲染流程。
- 密度图顶点着色器
uniform mat4 u_matrix;
uniform float u_extrude_scale;
uniform float u_opacity;
uniform float u_intensity;

attribute vec2 a_pos;

varying vec2 v_extrude;
uniform float weight;
uniform float radius;
// #pragma mapbox: define highp float weight
// #pragma mapbox: define mediump float radius

// Effective "0" in the kernel density texture to adjust the kernel size to;
// this empirically chosen number minimizes artifacts on overlapping kernels
// for typical heatmap cases (assuming clustered source)
const highp float ZERO = 1.0 / 255.0 / 16.0;

// Gaussian kernel coefficient: 1 / sqrt(2 * PI)
#define GAUSS_COEF 0.3989422804014327

void main(void) {
    // #pragma mapbox: initialize highp float weight
    // #pragma mapbox: initialize mediump float radius

    // unencode the extrusion vector that we snuck into the a_pos vector
    vec2 unscaled_extrude = vec2(mod(a_pos, 2.0) * 2.0 - 1.0);

    // This 'extrude' comes in ranging from [-1, -1], to [1, 1].  We'll use
    // it to produce the vertices of a square mesh framing the point feature
    // we're adding to the kernel density texture.  We'll also pass it as
    // a varying, so that the fragment shader can determine the distance of
    // each fragment from the point feature.
    // Before we do so, we need to scale it up sufficiently so that the
    // kernel falls effectively to zero at the edge of the mesh.
    // That is, we want to know S such that
    // weight * u_intensity * GAUSS_COEF * exp(-0.5 * 3.0^2 * S^2) == ZERO
    // Which solves to:
    // S = sqrt(-2.0 * log(ZERO / (weight * u_intensity * GAUSS_COEF))) / 3.0
    float S = sqrt(-2.0 * log(ZERO / weight / u_intensity / GAUSS_COEF)) / 3.0;

    // Pass the varying in units of radius
    v_extrude = S * unscaled_extrude;

    // Scale by radius and the zoom-based scale factor to produce actual
    // mesh position
    vec2 extrude = v_extrude * radius * u_extrude_scale;

    // multiply a_pos by 0.5, since we had it * 2 in order to sneak
    // in extrusion data
    vec4 pos = vec4(floor(a_pos * 0.5) + extrude, elevation(floor(a_pos * 0.5)), 1);

    gl_Position = u_matrix * pos;
}
- 密度图片段着色器 (注意这里的颜色值写入的是 r 通道,所以生成的并不是灰度密度图)
uniform highp float u_intensity;

varying vec2 v_extrude;
uniform float weight;
// #pragma mapbox: define highp float weight

// Gaussian kernel coefficient: 1 / sqrt(2 * PI)
#define GAUSS_COEF 0.3989422804014327

void main() {
    // #pragma mapbox: initialize highp float weight

    // Kernel density estimation with a Gaussian kernel of size 5x5
    float d = -0.5 * 3.0 * 3.0 * dot(v_extrude, v_extrude);
    float val = weight * u_intensity * GAUSS_COEF * exp(d);

    gl_FragColor = vec4(val, 1.0, 1.0, 1.0);
}
- 密度图渲染: 这里使用
Framebuffer作为密度图保存渲染结果,而且提及一下 Attributes 属性 和 Uniforms 全局变量 的来源
a_pos:来源于上面提到layoutVertexArray
elements: 索引数据来源于上面提及的 indexArray
u_matrix: 瓦片的posMatrix
u_opacity: 0-1
u_intensity: 全局密度权重,>= 0
radius: 像素半径 >=1
weight: 密度权重 https://docs.mapbox.com/mapbox-gl-js/style-spec/layers/#paint-heatmap-heatmap-weight
u_extrude_scale: 拉伸比例 pixelsToTileUnits(tile, 1, map.getZoom()) https://sourcegraph.com/github.com/mapbox/mapbox-gl-js/-/blob/src/source/pixels_to_tile_units.js#L19
if (painter.renderPass === 'offscreen') {
        const context = painter.context;
        const gl = context.gl;

        // Allow kernels to be drawn across boundaries, so that
        // large kernels are not clipped to tiles
        // 这里允许密度图跨边界绘制防止裁剪
        const stencilMode = StencilMode.disabled;
        // Turn on additive blending for kernels, which is a key aspect of kernel density estimation formula
        // 启用blend允许颜色混合
        const colorMode = new ColorMode([gl.ONE, gl.ONE], Color.transparent, [true, true, true, true]);

        bindFramebuffer(context, painter, layer);

        context.clear({color: Color.transparent});

        for (let i = 0; i < coords.length; i++) {
            const coord = coords[i];

            // Skip tiles that have uncovered parents to avoid flickering; we don't need
            // to use complex tile masking here because the change between zoom levels is subtle,
            // so it's fine to simply render the parent until all its 4 children are loaded
            if (sourceCache.hasRenderableParent(coord)) continue;

            const tile = sourceCache.getTile(coord);
            const bucket: ?HeatmapBucket = (tile.getBucket(layer): any);
            if (!bucket) continue;

            const programConfiguration = bucket.programConfigurations.get(layer.id);
            const program = painter.useProgram('heatmap', programConfiguration);
            const {zoom} = painter.transform;

            // 使用gl.TRIANGLES进行绘制,并关闭深度测试和面剔除
            program.draw(context, gl.TRIANGLES, DepthMode.disabled, stencilMode, colorMode, CullFaceMode.disabled,
                heatmapUniformValues(coord.posMatrix,
                    tile, zoom, layer.paint.get('heatmap-intensity')),
                layer.id, bucket.layoutVertexBuffer, bucket.indexBuffer,
                bucket.segments, layer.paint, painter.transform.zoom,
                programConfiguration);
        }

        context.viewport.set([0, 0, painter.width, painter.height]);

    }
热力图渲染(密度图着色)
- 顶点着色器
uniform mat4 u_matrix;
uniform vec2 u_world;
attribute vec2 a_pos;
varying vec2 v_pos;

void main() {
    gl_Position = u_matrix * vec4(a_pos * u_world, 0, 1);

    v_pos.x = a_pos.x;
    v_pos.y = 1.0 - a_pos.y;
}
- 片段着色器
uniform sampler2D u_image;
uniform sampler2D u_color_ramp;
uniform float u_opacity;
varying vec2 v_pos;

void main() {
    float t = texture2D(u_image, v_pos).r;
    vec4 color = texture2D(u_color_ramp, vec2(t, 0.5));
    gl_FragColor = color * u_opacity;
}
- 渲染
相对来说,密度图着色的流程相对简单的多,只是将上步生成的 fbo 进行着色,而且需要注意的是上步为了性能考虑 fbo 的大小设置为 painter.width / 4, painter.height / 4;这里同样也说明一下Attributes 属性 和 Uniforms 全局变量 的来源:
a_pos:
elements: 索引数据 https://sourcegraph.com/github.com/mapbox/mapbox-gl-js/-/blob/src/render/painter.js#L244
u_image:密度图
u_color_ramp:热力图渐变色带
u_opacity:0-1 的全局透明度
u_world:[gl.drawingBufferWidth, gl.drawingBufferHeight] https://sourcegraph.com/github.com/mapbox/mapbox-gl-js/-/blob/src/render/program/heatmap_program.js#L71
u_matrix: mat4.ortho(mat4.create(), 0, painter.width, painter.height, 0, 0, 1)
function renderTextureToMap(painter, layer) {
    const context = painter.context;
    const gl = context.gl;

    // Here we bind two different textures from which we'll sample in drawing
    // heatmaps: the kernel texture, prepared in the offscreen pass, and a
    // color ramp texture.
    const fbo = layer.heatmapFbo;
    if (!fbo) return;
    context.activeTexture.set(gl.TEXTURE0);
    gl.bindTexture(gl.TEXTURE_2D, fbo.colorAttachment.get());

    context.activeTexture.set(gl.TEXTURE1);
    let colorRampTexture = layer.colorRampTexture;
    if (!colorRampTexture) {
        colorRampTexture = layer.colorRampTexture = new Texture(context, layer.colorRamp, gl.RGBA);
    }
    colorRampTexture.bind(gl.LINEAR, gl.CLAMP_TO_EDGE);

    painter.useProgram('heatmapTexture').draw(context, gl.TRIANGLES,
        DepthMode.disabled, StencilMode.disabled, painter.colorModeForRenderPass(), CullFaceMode.disabled,
        heatmapTextureUniformValues(painter, layer, 0, 1),
        layer.id, painter.viewportBuffer, painter.quadTriangleIndexBuffer,
        painter.viewportSegments, layer.paint, painter.transform.zoom);
}

if (painter.renderPass === 'translucent') {
        painter.context.setColorMode(painter.colorModeForRenderPass());
        renderTextureToMap(painter, layer);
}
到这里,mapbox-gl 的 heatmap 的实现原理就结束了,其基本流程和 canvas 的 heatmap 区别不大。这里值得一提的是 gl 的密度图的混合和 canvas 默认的
这两个都是生成密度图的关键,而且据大佬所说 globalCompositeOperation 其实就是一个简单的 blend 实现。
2、mapbox-gl + regl 如何实现二维热力图
这里了解原理后考虑一下如何实现一个自定义热力图渲染,当然原理和上述 mapbox-gl 内置的 heatmap 基本一致(daimaquanchao),只是数据部分和着色器有细微的改动,下面我们看下详细的代码实现,完整代码
密度图顶点着色器 grayVs:
attribute vec2 a_position;
attribute float a_instance_count;

uniform mat4 u_matrix;

uniform float u_extrude_scale;
uniform float u_intensity;

uniform float u_radius;

varying vec2 v_extrude;
varying float v_weight;

// Effective "0" in the kernel density texture to adjust the kernel size to;
// this empirically chosen number minimizes artifacts on overlapping kernels
// for typical heatmap cases (assuming clustered source)
const float ZERO = 1.0 / 255.0 / 16.0;

// Gaussian kernel coefficient: 1 / sqrt(2 * PI)
#define GAUSS_COEF 0.3989422804014327

void main() {
  // unencode the extrusion vector that we snuck into the a_pos vector
  vec2 unscaled_extrude = vec2(mod(a_position.xy, 2.0) * 2.0 - 1.0);
  v_weight = a_instance_count;

  // This 'extrude' comes in ranging from [-1, -1], to [1, 1].  We'll use
  // it to produce the vertices of a square mesh framing the point feature
  // we're adding to the kernel density texture.  We'll also pass it as
  // a varying, so that the fragment shader can determine the distance of
  // each fragment from the point feature.
  // Before we do so, we need to scale it up sufficiently so that the
  // kernel falls effectively to zero at the edge of the mesh.
  // That is, we want to know S such that
  // weight * u_intensity * GAUSS_COEF * exp(-0.5 * 3.0^2 * S^2) == ZERO
  // Which solves to:
  // S = sqrt(-2.0 * log(ZERO / (weight * u_intensity * GAUSS_COEF))) / 3.0
  float S = sqrt(-2.0 * log(ZERO / v_weight / u_intensity / GAUSS_COEF)) / 3.0;

  // Pass the varying in units of radius
  v_extrude = S * unscaled_extrude;

  // Scale by radius and the zoom-based scale factor to produce actual
  // mesh position
  vec2 extrude = v_extrude * u_radius * u_extrude_scale;

  // multiply a_pos by 0.5, since we had it * 2 in order to sneak
  // in extrusion data
  vec4 pos = vec4(floor(a_position.xy * 0.5) + extrude, 0.0, 1.0);

  gl_Position = u_matrix * pos;
}
密度图片段着色器 grayFs:
//precision mediump float;
precision highp float;
uniform float u_intensity;

varying vec2 v_extrude;

varying float v_weight;

// Gaussian kernel coefficient: 1 / sqrt(2 * PI)
#define GAUSS_COEF 0.3989422804014327

void main() {
//  if (dot(v_iPosition, v_iPosition) > 1.0) {
//    discard;
//  }

  // Kernel density estimation with a Gaussian kernel of size 5x5
  float d = -0.5 * 3.0 * 3.0 * dot(v_extrude, v_extrude);
  float val = v_weight * u_intensity * GAUSS_COEF * exp(d);

  gl_FragColor = vec4(0.0, 0.0, 0.0, val);
}
我们通过上面着色器代码可以看到核心代码没有变化,仅仅改动了密度图权重weight 的获取方式,其他基本保持不变。其核心 regl 代码如下:
this.regl = REGL({
      gl: gl,
      extensions: [
        'OES_texture_float',
        'OES_element_index_uint',
        'WEBGL_color_buffer_float',
        'OES_texture_half_float',
        'ANGLE_instanced_arrays'
      ],
      attributes: {
        antialias: true,
        preserveDrawingBuffer: false,
      }
    });

    const [width, height] = [this.map.transform.width, this.map.transform.height];

    this.texture = this.regl.texture({
      width,
      height,
      min: 'linear',
      mag: 'linear',
      wrap: 'clamp',
      format: 'rgba',
      type: 'half float'
    });

    this.fbo = this.regl.framebuffer({
      width,
      height,
      depth: false,
      stencil: false,
      colorFormat: 'rgba',
      colorType: 'half float',
      color: this.texture
    });

    this.gradientCommand = this.regl<GradientCommand.Uniforms, GradientCommand.Attributes, GradientCommand.Props>({
      frag: grayFs,

      vert: grayVs,

      attributes: {
        a_position: (_, { a_position }) => a_position,
        a_instance_count: (_, { a_instance_count }) => a_instance_count,
      },

      uniforms: {
        u_matrix: (_, { u_matrix }) => u_matrix,
        u_intensity: (_, { u_intensity }) => u_intensity,
        u_radius: (_, { u_radius }) => u_radius,
        u_opacity: (_, { u_opacity }) => u_opacity,
        u_extrude_scale: (_, { u_extrude_scale }) => u_extrude_scale,
      },

      depth: { // 这里我们关闭深度测试
        enable: false,
        mask: false,
        func: 'less',
        range: [0, 1]
      },

      blend: {
        enable: true,
        func: {
          src: 'one',
          dst: 'one',
        },
        equation: 'add',
        color: [0, 0, 0, 0],
      },

      colorMask: [true, true, true, true],

      elements: (_, { elements }) => elements,

      viewport: (_, { canvasSize: [width, height] }) => ({ x: 0, y: 0, width, height })
    });
密度图着色相关的着色器代码 :
// drawVs
uniform mat4 u_matrix;
uniform vec2 u_world; // 4096 * 2

attribute vec2 a_pos;

attribute vec2 a_texCoord;

varying vec2 v_texCoord;

void main() {
  v_texCoord = a_texCoord;

  gl_Position = u_matrix * vec4(a_pos * u_world, 0.0, 1.0);
}

// drawFs
precision mediump float;

uniform sampler2D u_image;
uniform sampler2D u_color_ramp;
uniform float u_opacity;

varying vec2 v_texCoord;

void main() {
  float t = texture2D(u_image, v_texCoord).a;

  vec4 color = texture2D(u_color_ramp, vec2(t, 0.5));
  gl_FragColor = color * u_opacity;
}
核心代码:
this.colorCommand = this.regl<ColorCommand.Uniforms, ColorCommand.Attributes, ColorCommand.Props>({
      frag: drawFs,

      vert: drawVs,

      attributes: {
        a_pos: (_, { a_pos }) => a_pos,
        a_texCoord: (_, { a_texCoord }) => a_texCoord,
      },

      uniforms: {
        u_matrix: (_, { u_matrix }) => u_matrix,
        u_image: (_, { u_image }) => u_image,
        u_color_ramp: (_, { u_color_ramp }) => u_color_ramp,
        u_world: (_, { u_world }) => u_world,
        u_opacity: (_, { u_opacity }) => u_opacity,
      },

      depth: {
        enable: false,
        mask: true,
        func: 'always',
      },

      blend: {
        enable: true,
        func: {
          src: 'one',
          dst: 'one minus src alpha',
        },
        color: [0, 0, 0, 0]
      },

      colorMask: [true, true, true, true],

      elements: (_, { elements }) => elements,

      viewport: (_, { canvasSize: [width, height] }) => ({ x: 0, y: 0, width, height })
    });
核心渲染代码:
这里没有直接使用矢量瓦片,而是使用 geojson 作为元数据,使用
生成矢量瓦片。
下面在注释里面简单解释一下基本原理
render(gl: WebGLRenderingContext | WebGL2RenderingContext, m: REGL.Mat4) {
    if (!this.regl || !this.hasData) return;

    // 当渲染数据需要更新时销毁原有顶点数据
    if (this.needUpdate) {
      const keys = dataCache.keys();
      let i = 0;
      let len = keys.length;
      for (; i < len; i++) {
        const tile = dataCache.get(keys[i]) as {
          parseData: any;
          instanceData: {
            elements: REGL.Elements,
            position: {
              buffer: REGL.Buffer;
              size: number;
            },
            instanceCount: {
              buffer: REGL.Buffer;
              size: number;
              divisor: number;
              normalized: boolean;
            },
          }
        };
        if (tile) {
          // tile.instanceData?.uvs.buffer.destroy();
          tile.instanceData?.position.buffer.destroy();
          tile.instanceData?.instanceCount.buffer.destroy();
          tile.instanceData?.elements.destroy();
        }
      }
      this.needUpdate = false;
    }

    // 返回当前视图覆盖的瓦片
    const tiles = this.map.transform.coveringTiles({
      tileSize: this.options.tileSize,
      minzoom: this.options.minZoom,
      maxzoom: this.options.maxZoom,
      reparseOverscaled: undefined,
    });

    for (const coord of tiles) {
      const canonical = coord.canonical;
      const cache = dataCache.get(coord.key) as {
        parseData: any;
        instanceData: {
          elements: REGL.Elements,
          position: {
            buffer: REGL.Buffer;
            size: number;
          },
          instanceCount: {
            buffer: REGL.Buffer;
            size: number;
            divisor: number;
            normalized: boolean;
          };
        }
      };
      // 更新瓦片投影矩阵
      coord.posMatrix = this.map.painter.transform.calculatePosMatrix(coord.toUnwrapped());

      if (!this.tileIndex) continue;

      // 如果没有缓存,则从矢量瓦片中读取数据,构建顶点数据、索引数据和、权重数据,这里也是使用两个三角形构造一个点
      // 而且针对这里其实还可以优化,使用[实例化绘制](https://webglfundamentals.org/webgl/lessons/zh_cn/webgl-instanced-drawing.html) 可以大大减少向 gpu 传输的顶点数量,具体实现在下一节 3d heatmap 有使用
      if (!cache) {
        const data = this.tileIndex.getTile(canonical.z, canonical.x, canonical.y);
        const features = data?.features || [];
        let i = 0;
        const len = features.length;
        const n = new Float32Array(2 * 4 * features.length);
        const instanceCount = new Float32Array(features.length);
        const indices = new Uint32Array(features.length * 6);
        for (; i < len; i++) {
          let val = 1;
          if (this.options.weight) {
            val = this.options.weight(features[i]);
          }
          const coords = features[i].geometry[0];
          const x = coords[0];
          const y = coords[1];
          if (x < 0 || x >= EXTENT || y < 0 || y >= EXTENT)
            continue;
          const index = i * 8;
          addCircleVertex(n, index, x, y, -1, -1);
          addCircleVertex(n, index + 2, x, y, 1, -1);
          addCircleVertex(n, index + 2 * 2, x, y, 1, 1);
          addCircleVertex(n, index + 2 * 3, x, y, -1, 1);

          const tt = i * 6;
          const bb = i * 4;

          indices[tt] = bb;
          indices[tt + 1] = bb + 1;
          indices[tt + 2] = bb + 2;

          indices[tt + 3] = bb;
          indices[tt + 4] = bb + 3;
          indices[tt + 5] = bb + 2;

          instanceCount[i] = val;
        }

        coord.instanceData = {
          instanceCount: {
            buffer: this.regl.buffer({
              data: instanceCount,
              type: 'float32',
              usage: 'static',
            }),
            normalized: false,
            size: 1,
            divisor: 4,
          },
          elements: this.regl.elements({
            data: indices,
            primitive: 'triangles',
            type: 'uint32',
          }),
          position: {
            buffer: this.regl.buffer({
              data: n,
              type: 'float',
            }),
            size: 2,
          },
        };

        coord.parseData = features;
        dataCache.set(coord.key, coord);
      } else {
        // 如果有缓存,直接从缓存中取相关数据
        coord.instanceData = cache.instanceData;

        coord.parseData = cache.parseData;
      }
    }

    const [width, height] = [this.map.transform.width, this.map.transform.height];
    const [drawWidth, drawHeight] = [this.map.painter.width, this.map.painter.height];

    // 清空 fbo
    this.regl.clear({
      color: [0, 0, 0, 0],
      depth: 0,
      framebuffer: this.fbo
    });

    // 为了性能优化,fbo 大小设置为画布宽高的1/4
    this.fbo.resize(drawWidth / 4, drawHeight / 4);
    let i = 0;
    const len = tiles.length;
    this.fbo.use(() => {
      for (; i < len; i++) {
        const tile = tiles[i];
        tile.tileSize = this.options.tileSize;
        // 逐瓦片绘制密度图,和上节的过程基本类似,这里不深入
        this.gradientCommand({
          // @ts-ignore
          u_matrix: tile.posMatrix,
          a_position: tile.instanceData.position,
          a_instance_count: tile.instanceData.instanceCount,
          elements: tile.instanceData.elements,
          u_extrude_scale: getExtrudeScale(this.options.extrudeScale !== undefined ? this.options.extrudeScale : 1, this.map.transform.zoom, tile),
          u_intensity: this.options.intensity !== undefined ? this.options.intensity : 1,
          u_radius: this.options.radius !== undefined ? this.options.radius : 20,
          canvasSize: [drawWidth / 4, drawHeight / 4],
        });
      }
    })

    // 生成顶点数据和索引数据,和上节的生成基本类似,不做深入
    const cacheBuffer = this.getPlaneBuffer(this.drawBuffer, 1, 1, 1, 1);

    this.colorCommand({
      a_pos: cacheBuffer.position,
      a_texCoord: cacheBuffer.uvs,
      elements: cacheBuffer.elements,
      u_matrix: this.map.transform.glCoordMatrix, // 这里同上节提到的`mat4.ortho(mat4.create(), 0, painter.width, painter.height, 0, 0, 1)
      u_world: [width, height],
      u_image: this.texture,
      u_color_ramp: this.colorRampTexture,
      u_opacity: this.options.opacity !== undefined ? this.options.opacity : 1,
      canvasSize: [drawWidth, drawHeight],
    });

    this.regl._refresh();
  }
colorRampTexture的生成:
这个很容易理解,不做深入
createColorTexture(colors: [number, string][]) {
    const interpolateColor = colors
      .map((item) => ({
        key: item[0],
        value: item[1],
      }));

    const canvas = document.createElement('canvas');
    const ctx = canvas.getContext('2d');

    canvas.width = 256;
    canvas.height = 1;

    if (ctx) {
      const gradient = ctx.createLinearGradient(0, 0, 256, 0);

      for (let i = 0; i < interpolateColor.length; i += 1) {
        const key = interpolateColor[i].key;
        const color = interpolateColor[i].value;
        gradient.addColorStop(key, color);
      }

      ctx.fillStyle = gradient;
      ctx.fillRect(0, 0, 256, 1);
      const data = new Uint8Array(ctx.getImageData(0, 0, 256, 1).data);

      return this.regl.texture({
         256,
        height: 1,
        data,
        mipmap: false,
        flipY: false,
        format: 'rgba',
        min: 'linear',
        mag: 'linear',
        wrap: 'clamp'
      });
    }
  }
以上就是 mapbox-gl + regl 的2d热力图的简单实现,其效果图如下:
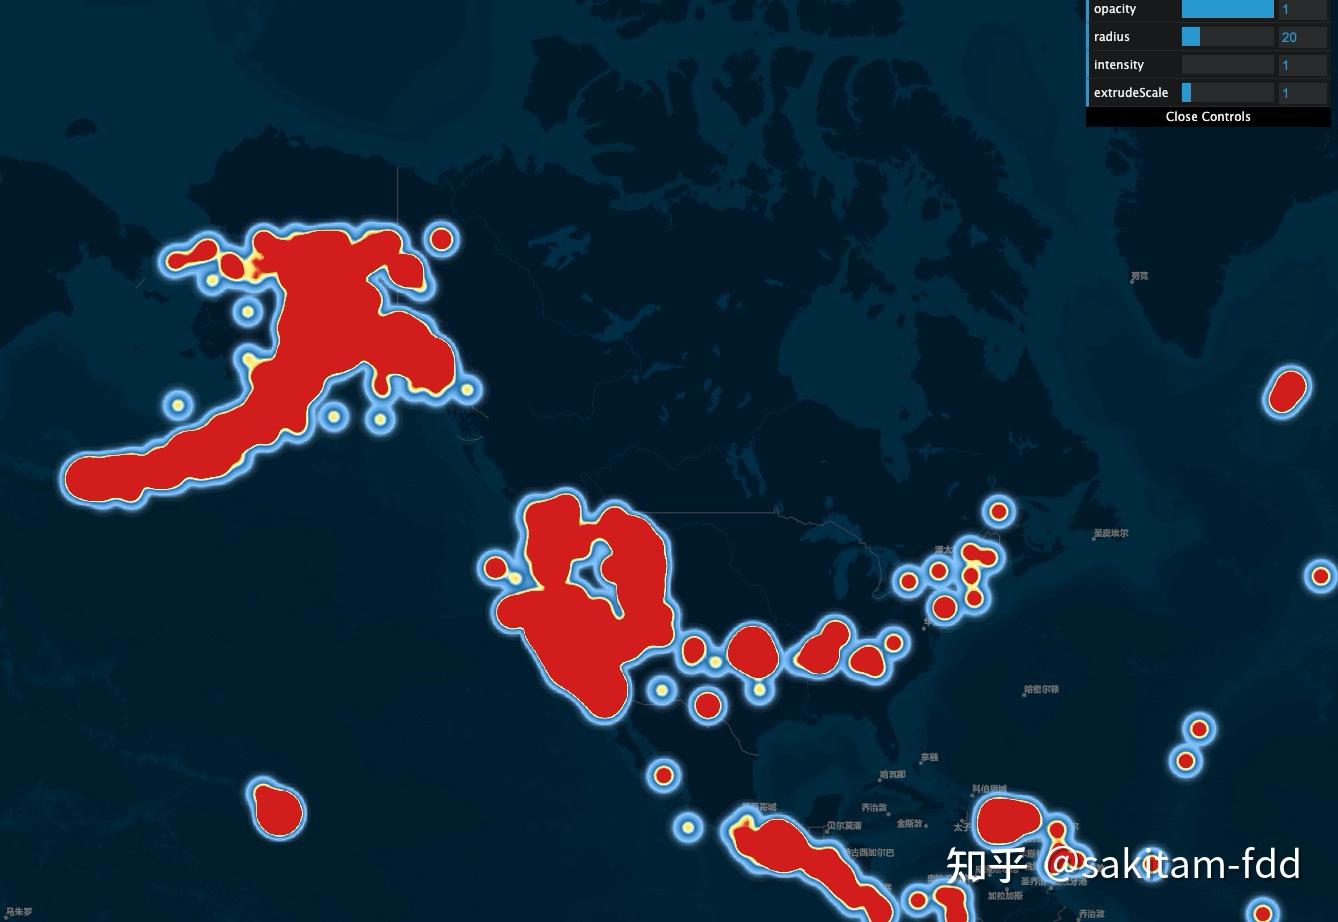
这里也同样展示一下密度图,因为上述代码中写入的是Alpha通道,所以看起来和 canvas 的密度图类似:

但是如果写入的是 red 通道(和 mapbox-gl 类似的话),其效果可能如下图所示:

3、mapbox-gl + regl 如何实现三维热力图
在这一节我们主要关注两个点,一是第二种方式的热力图实现,二是如何赋予热力图高度。下面我们先看新的热力图实现方式:
先上着色器代码:
密度图着色器
// 顶点着色器

attribute vec2 a_position; // 顶点数据
attribute vec2 a_precisionBits; // 顶点数据高位

attribute vec2 a_shape_position;
attribute float a_instance_count;

uniform float u_weight; // 全局密度权重
uniform float u_radius; // 密度图生成的半径
uniform float u_intensity; // 密度
uniform float u_min; // 数据权重最小值
uniform float u_max; // 数据权重最大值

varying float v_intensity;
varying vec2 v_shape_position;

void main() {
  v_shape_position = a_shape_position;

  vec3 worldPosition = project_position(vec3(a_position, 0.0), vec3(a_precisionBits, 0.0));

  v_intensity = clamp((a_instance_count - u_min) / (u_max - u_min), 0.0, 1.0) * u_intensity;

  float r = project_pixel_size(project_size_to_pixel(u_radius));

  vec2 offset = a_shape_position * r;

  vec4 commonPosition = vec4(worldPosition + vec3(offset , 0.0), 1.0);

  gl_Position = project_common_position_to_clipspace(commonPosition);
}

// 片段着色器
precision highp float;

uniform float u_weight; // 全局密度权重

varying float v_intensity;
varying vec2 v_shape_position;

void main() {
  float d = 1.0 - clamp(length(v_shape_position), 0.0, 1.0);
  float intensity = u_weight * v_intensity * d;

  gl_FragColor = vec4(0.0, 0.0, 0.0, intensity);
}
这里使用了与 deck.gl 相同的投影方式,使用了 mercator-proj这个实现。当然,主体代码是从 deck.gl 提取(chao)的最小的计算Web墨卡托投影的类库,其核心原理你可以查看 deck.gl 的相关文章,这里不做深入。
渲染着色器:
// toBezier
precision highp float;

vec2 toBezierInner(float t, vec2 P0, vec2 P1, vec2 P2, vec2 P3) {
  float t2 = t * t;
  float one_minus_t = 1.0 - t;
  float one_minus_t2 = one_minus_t * one_minus_t;
  return (P0 * one_minus_t2 * one_minus_t + P1 * 3.0 * t * one_minus_t2 + P2 * 3.0 * t2 * one_minus_t + P3 * t2 * t);
}

vec2 toBezier(float t, vec4 p) {
  return toBezierInner(t, vec2(0.0, 0.0), vec2(p.x, p.y), vec2(p.z, p.w), vec2(1.0, 1.0));
}

#pragma glslify: export(toBezier)

// 顶点着色器
uniform mat4 u_matrix; // map.transform.mercatorMatrix
uniform mat4 u_inverse_matrix; // map.transform.pixelMatrixInverse

uniform sampler2D u_image; // fbo texture
uniform float u_world_size; // map.transform.worldSize
uniform float u_max_height; //
uniform vec2 u_viewport_size; // [map.transform.width, map.transform.height]
uniform vec4 u_bezier;

attribute vec2 a_pos;
attribute vec2 a_texCoord;

varying float v_alpha;
varying vec2 v_texCoord;

#pragma glslify: toBezier = require(../toBezier)

float interpolate(float a, float b, float t) {
  return (a * (1.0 - t)) + (b * t);
}

float a = PROJECT_EARTH_CIRCUMFRENCE / 1024.0 / 8.0;

void main() {
  v_texCoord = a_texCoord;

  // 纹理坐标转标准化设备坐标(Normalized Device Coordinates, NDC - -1 - 1)
  vec2 clipSpace = a_pos * 2.0 - vec2(1.0);

  vec2 screen = a_pos * u_viewport_size;

  // mapbox-gl-js src/geo/Transform.pointCoordinate
  // since we don't know the correct projected z value for the point,
  // unproject two points to get a line and then find the point on that
  // line with z=0
  vec4 p1 = vec4(screen.xy, 0.0, 1.0);
  vec4 p2 = vec4(screen.xy, 1.0, 1.0);

  vec4 inverseP1 = u_inverse_matrix * p1;
  vec4 inverseP2 = u_inverse_matrix * p2;

  inverseP1 = inverseP1 / inverseP1.w;
  inverseP2 = inverseP2 / inverseP2.w;

  float zPos = 0.0;

  if (inverseP1.z == inverseP2.z) {
    zPos = 0.0;
  } else {
    zPos = (0.0 - inverseP1.z) / (inverseP2.z - inverseP1.z);
  }

  // mapbox-gl-js src/style-spec/util/interpolate.js
  vec2 mapCoord = vec2(interpolate(inverseP1.x, inverseP2.x, zPos), interpolate(inverseP1.y, inverseP2.y, zPos));

  v_alpha = texture2D(u_image, v_texCoord).a;
  float height1 = toBezier(v_alpha, u_bezier).y;
  float height0 = toBezier(0.0, u_bezier).y;
  // 这里的高度值并不准确,只是调试了一个合适的值展示效果
  float height = (height1 - height0) / (a / u_max_height);

  if (height <= 0.0) {
    height = 0.0;
  } else if (height >= 1.0) {
    height = 1.0;
  }

  gl_Position = u_matrix * vec4(mapCoord.xy / u_world_size, height, 1.0);
}

// 片段着色器
precision mediump float;

uniform sampler2D u_color_ramp;
uniform float u_opacity;
uniform sampler2D u_image;

varying float v_alpha;
varying vec2 v_texCoord;

void main() {
  vec4 color = texture2D(u_color_ramp, vec2(v_alpha, 0.5));
  gl_FragColor = color * u_opacity;
//  gl_FragColor = vec4(1.0, 0.0, 0.0, 0.1);
}
在图层上同样是实现了 mapbox-gl 的自定义图层,其核心需要实现两个方法:
onAdd:
// 创建 regl,并开启相应的扩展
this.regl = REGL({
  gl: gl,
  extensions: [
    'OES_texture_float',
    'ANGLE_instanced_arrays',
    // @link https://gitter.im/mikolalysenko/regl?at=57f04621b0ff456d3ad8f268
    'OES_element_index_uint',
    'WEBGL_color_buffer_float',
    'OES_texture_half_float',
    'OES_vertex_array_object'
  ],
  attributes: {
    antialias: true,
    preserveDrawingBuffer: false,
  }
});

const [width, height] = [this.map.transform.width, this.map.transform.height];

this.texture = this.regl.texture({
  width,
  height,
  min: 'linear',
  mag: 'linear',
  wrap: 'clamp',
  format: 'rgba',
  type: 'half float'
});

// 创建密度图 fbo
this.fbo = this.regl.framebuffer({
  width,
  height,
  depth: false,
  stencil: false,
  colorFormat: 'rgba',
  colorType: 'half float',
  color: this.texture
});

const uniforms: any = {};

const keys = getUniformKeys() as MercatorUniformKeys;
keys.forEach((key: any) => {
  // @ts-ignore
  uniforms[key] = this.regl.prop(key);
});

this.gradientCommand = this.regl<GradientCommand.Uniforms, GradientCommand.Attributes, GradientCommand.Props>({
  frag: grayFs,

  // 这里向顶点着色器注入墨卡托投影相关的着色器
  vert: injectMercatorGLSL(this.gl, grayVs),

  attributes: {
    a_position: (_, { a_position }) => a_position,
    a_shape_position: (_, { a_shape_position }) => a_shape_position,
    a_precisionBits: (_, { a_precisionBits }) => a_precisionBits,
    a_instance_count: (_, { a_instance_count }) => a_instance_count,
  },

  uniforms: {
    u_intensity: (_, { u_intensity }) => u_intensity,
    u_weight: (_, { u_weight }) => u_weight,
    u_radius: (_, { u_radius }) => u_radius,
    u_min: (_, { u_min }) => u_min,
    u_max: (_, { u_max }) => u_max,
    u_opacity: (_, { u_opacity }) => u_opacity,

    ...uniforms,
  },

  depth: {
    enable: false,
    mask: false,
    func: 'always',
  },

  blend: {
    enable: true,
    func: {
      src: 'one',
      dst: 'one',
    },
    equation: 'add',
    color: [0, 0, 0, 0],
  },

  colorMask: [true, true, true, true],

  primitive: 'triangle strip',

  instances: (_, { instances }) => instances,

  count: (_, { vertexCount }) => vertexCount,

  viewport: (_, { canvasSize: [width, height] }) => ({ x: 0, y: 0, width, height })
});

this.colorCommand = this.regl<ColorCommand.Uniforms, ColorCommand.Attributes, ColorCommand.Props>({
  frag: drawFs,

  vert: injectMercatorGLSL(this.gl, drawVs),

  attributes: {
    a_pos: (_, { a_pos }) => a_pos,
    a_texCoord: (_, { a_texCoord }) => a_texCoord,
    a_precisionBits: (_, { a_precisionBits }) => a_precisionBits,
  },

  uniforms: {
    u_matrix: (_, { u_matrix }) => u_matrix,
    u_inverse_matrix: (_, { u_inverse_matrix }) => u_inverse_matrix,
    u_image: (_, { u_image }) => u_image,
    u_bezier: (_, { u_bezier }) => u_bezier,
    u_color_ramp: (_, { u_color_ramp }) => u_color_ramp,
    u_opacity: (_, { u_opacity }) => u_opacity,
    u_world_size: (_, { u_world_size }) => u_world_size,
    u_max_height: (_, { u_max_height }) => u_max_height,
    u_viewport_size: (_, { u_viewport_size }) => u_viewport_size,
    ...uniforms,
  },

  depth: {
    enable: false,
    mask: true,
    func: 'always',
  },

  blend: {
    enable: true,
    func: {
      src: 'one',
      dst: 'one minus src alpha',
    },
    color: [0, 0, 0, 0]
  },

  colorMask: [true, true, true, true],

  elements: (_, { elements }) => elements,

  viewport: (_, { canvasSize: [width, height] }) => ({ x: 0, y: 0, width, height })
});
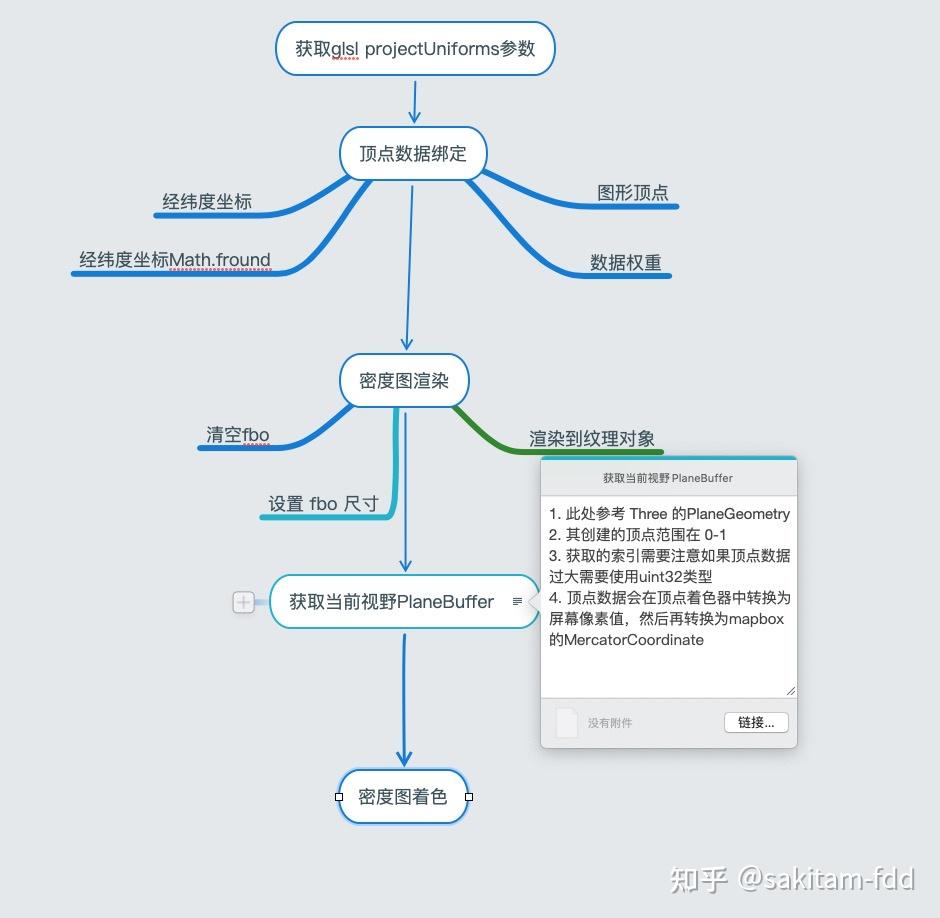
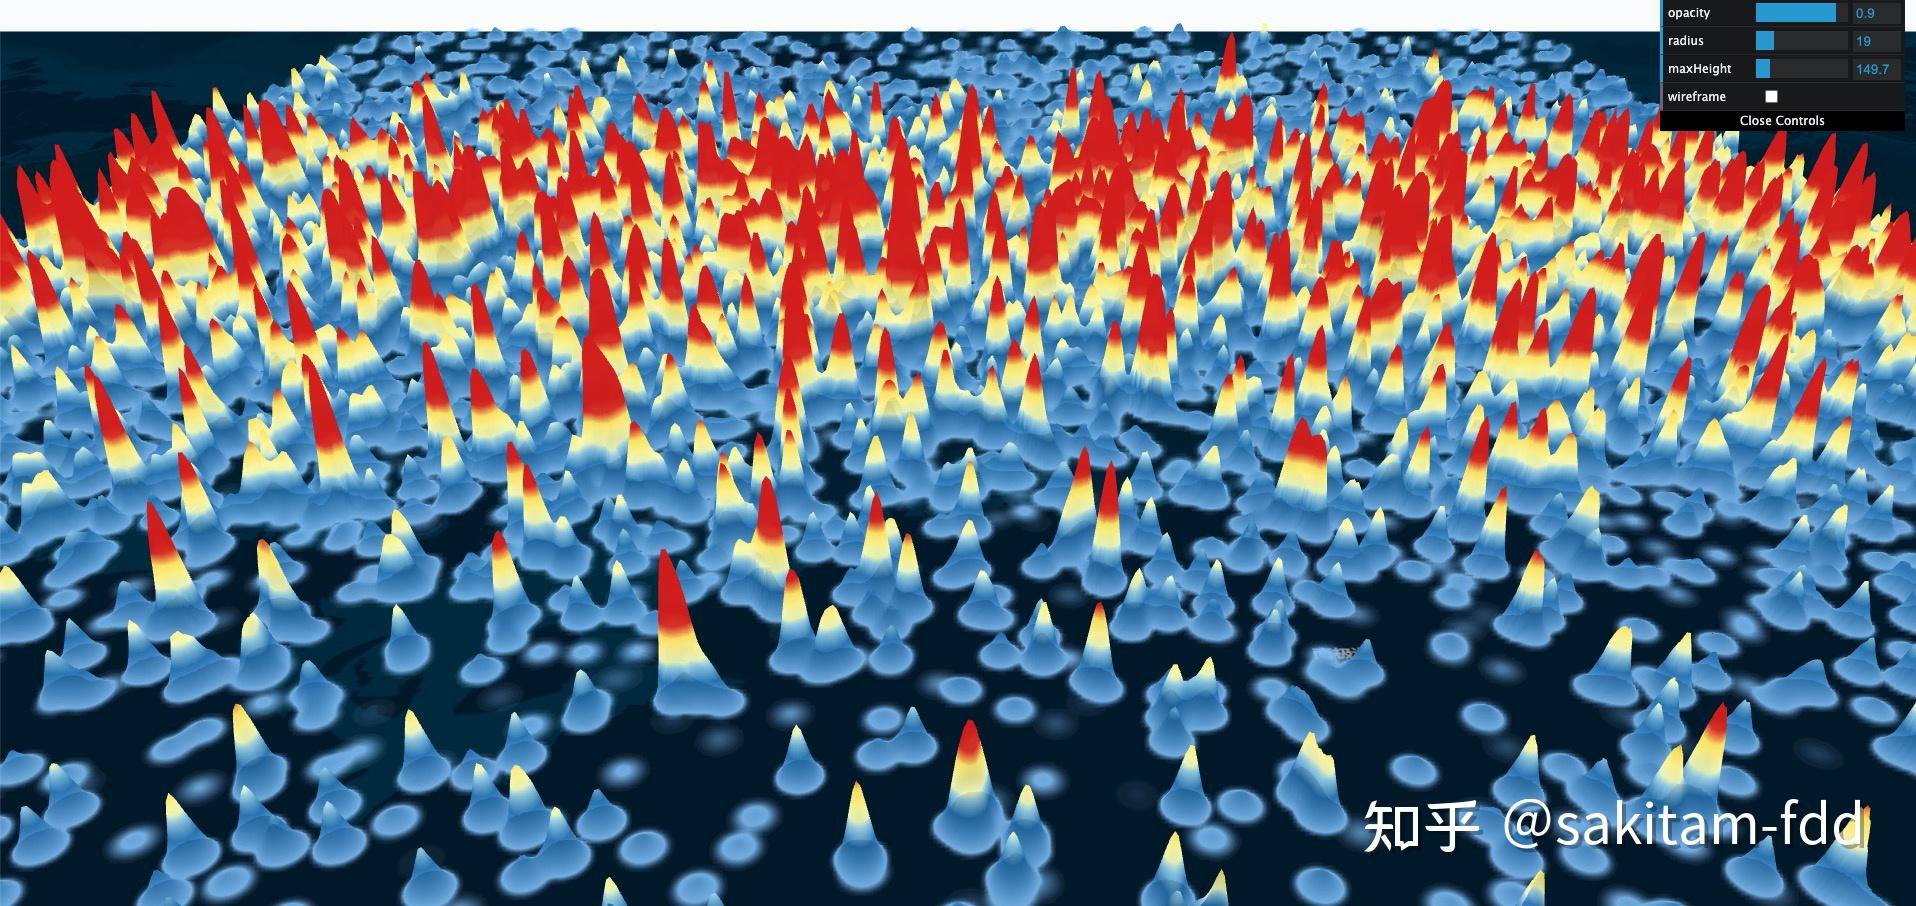
render(其实这步里面的密度图渲染可以放到 prerender 里),这块我就不贴代码了,核心流程有点长,我们用流程图简单描述一下基本渲染流程,如果你对源码感兴趣请查看
最终实现效果如下图 :
到这里整篇文章也就结束了,受限于本人技术水平和语言组织能力文章上可能多有疏漏,欢迎指正。
本文转自 https://zhuanlan.zhihu.com/p/350355621,如有侵权,请联系删除。