一 说明
数据来源:新财富 http://www.xcf.cn/zhuanti/ztzz/hdzt1/500frb/index.html
我是通过把这些数据放到excle表格里统计的数据。
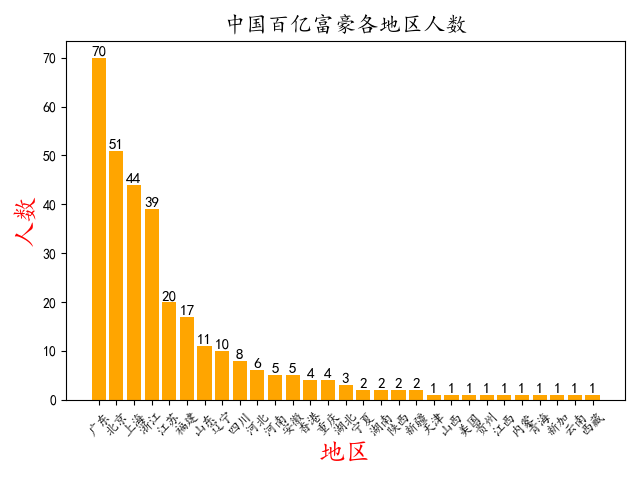
二 统计中国那个地区百亿富豪人数最多
import pandas as pd
import matplotlib as mpl
import matplotlib.pyplot as plt
mpl.rcParams['font.sans-serif'] = ['KaiTi']
mpl.rcParams['font.serif'] = ['KaiTi']
# 统计各地区百亿富豪人数
people = pd.read_excel('C:/Users/hunin/Desktop/by.xlsx')
area = []
for i in people.index:
    area.append('')
people['地区'] = area

for i in people.index:
    # print(i)
    people['地区'].at[i] = people['公司总部'].at[i][0:2]
    # print(students['地区'].at[i])
feng = {}
for i in people.index:
    if people['地区'].at[i] in feng.keys():
        feng[people['地区'].at[i]] += 1
    else:
        feng[people['地区'].at[i]] = 1
data = {
    '地区': list(feng.keys()),
    '人数': list(feng.values())
}

df = pd.DataFrame(data)
df.sort_values(by="人数",inplace=True, ascending=False)
# print(df)
plt.bar(df['地区'], df['人数'], color='orange')
plt.xticks(df['地区'], rotation='45')
plt.xlabel('地区',fontsize=19,color="red")
plt.ylabel('人数',fontsize=19,color="red")
plt.title('中国百亿富豪各地区人数', fontsize=16)

num_list=[]
for i in feng.values():
    num_list.append(i)
num_list.sort(reverse=True)
for a, b in zip(df.地区,num_list):
    plt.text(a, b, '%.0f' % b, ha='center', va='bottom', fontsize=11)
plt.tight_layout()
plt.show()
运行代码结果为:
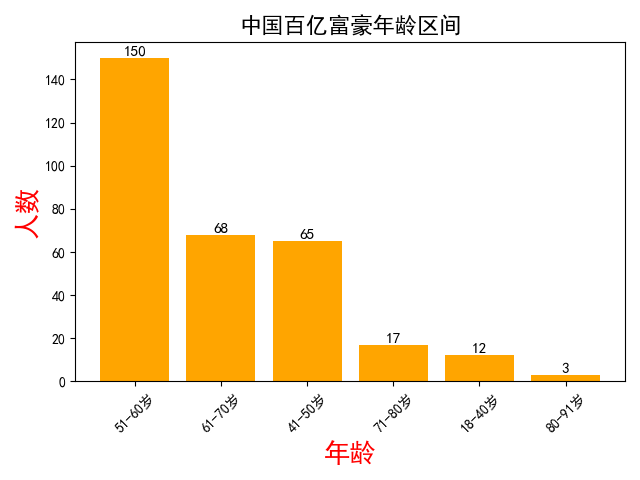
三 统计百亿富豪集中在那个年龄段
import matplotlib.pyplot as plt
import pandas as pd

plt.rcParams['font.sans-serif'] = ['SimHei']

student=pd.read_excel('C:/Users/hunin/Desktop/by.xlsx')
pep1=student.loc[student["年龄"].apply(lambda a:18<=int(a)<=40)]
pep2=student.loc[student["年龄"].apply(lambda a:41<=int(a)<=50)]
pep3=student.loc[student["年龄"].apply(lambda a:51<=int(a)<=60)]
pep4=student.loc[student["年龄"].apply(lambda a:61<=int(a)<=70)]
pep5=student.loc[student["年龄"].apply(lambda a:71<=int(a)<=80)]
pep6=student.loc[student["年龄"].apply(lambda a:81<=int(a)<=90)]
dict={"18-40岁":len(pep1),"41-50岁":len(pep2),"51-60岁":len(pep3),"61-70岁":len(pep4),"71-80岁":len(pep5),"80-91岁":len(pep6)}


data = {
    '年龄': list(dict.keys()),
    '人数': list(dict.values())
}
df = pd.DataFrame(data)
df.sort_values(by="人数",inplace=True, ascending=False)
plt.bar(df['年龄'], df['人数'], color='orange')
plt.xticks(df['年龄'], rotation='45')
plt.xlabel('年龄',fontsize=19,color="red")
plt.ylabel('人数',fontsize=19,color="red")
plt.title('中国百亿富豪年龄区间', fontsize=16)

num_list=[]
for i in dict.values():
    num_list.append(i)
num_list.sort(reverse=True)
for a, b in zip(df.年龄,num_list):
    plt.text(a, b, '%.0f' % b, ha='center', va='bottom', fontsize=11)
plt.tight_layout()
plt.show()
效果如图: