问题描述
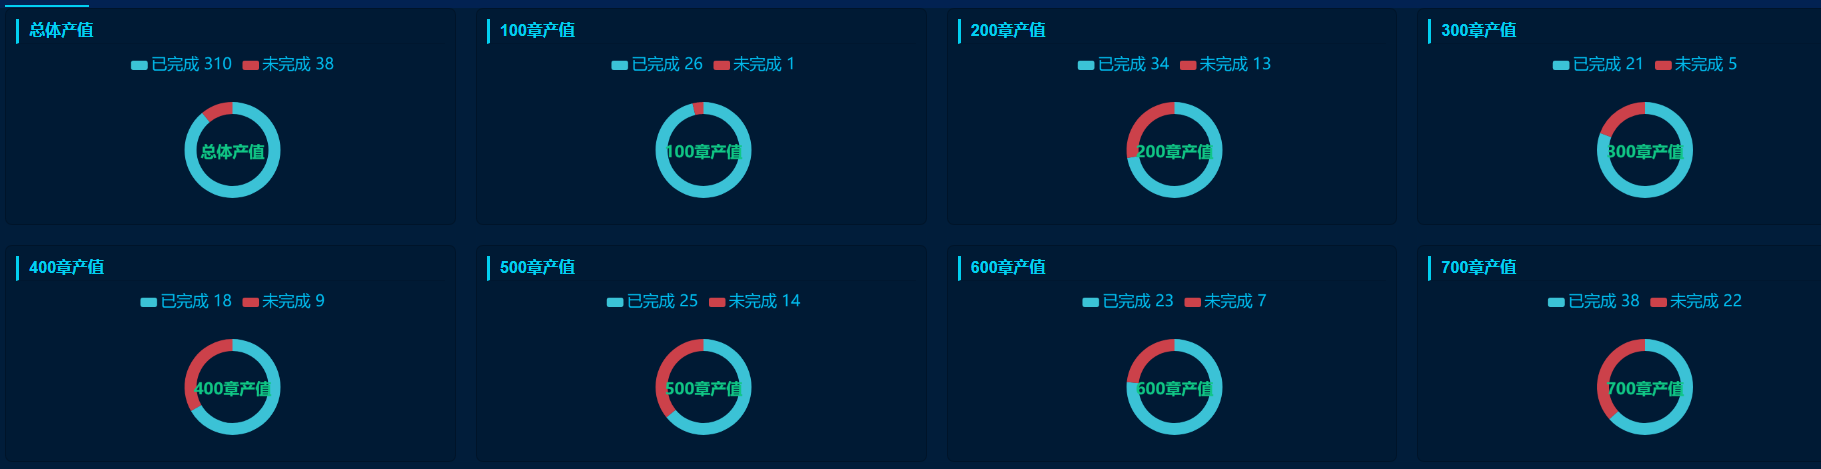
在父组件使用定义好的echarts饼状图组件,通过父组件向子组件传递id和data,子父组件中data定义的数据,子组件可以接收到,图标正常显示;通过axios请求的后台数据,赋给data定义的数据对象,则子组件获取到的还是data之前定义好的数据,赋值无意义
思考 父组件传递prop就是渲染时传递
所以考虑到父组件传递prop,子组件mounted阶段就是渲染时传递,而不是赋值时传递的,所以总是传递的data()里面初始化的数据。所以通过父组件去调用子组件方法去画图也行不通。
那么我就可以给子组件加个判断 v-if 条件,当父组件从后台异步取到数据后,并且赋值给prop后,让flag = true再去渲染子组件,那么此时传递给子组件的prop就是异步获取到数据之后的值,图形就正常展示出来了。
解决方案
给子组件加个判断 v-if 条件,当父组件从后台异步取到数据后,并且赋值给prop后,让flag = true再去渲染子组件
代码如下
父组件
<template>
  <div class="czfx d-flex-wrap">
    <el-row class="" :gutter="30">
      <el-col :span="6">
        <div>
          <div class="tit">总体产值</div>
          <div class="con">
            <PieChart
              v-if="flag.baizhang"
              style="min-height: 1.6rem"
              height="100%"
              width="100%"
              id="allchart"
              :datas="allData"
            ></PieChart>
          </div>
        </div>
      </el-col>
      <el-col :span="6">
        <div>
          <div class="tit">100章产值</div>
          <div class="con">
            <PieChart
              v-if="flag.baizhang"
              style="min-height: 1.6rem"
              height="100%"
              width="100%"
              id="100chart"
              :datas="oneData"
            ></PieChart>
          </div>
        </div>
      </el-col>
      <el-col :span="6">
        <div>
          <div class="tit">200章产值</div>
          <div class="con">
            <PieChart
              v-if="flag.baizhang"
              style="min-height: 1.6rem"
              height="100%"
              width="100%"
              id="200chart"
              :datas="twoData"
            ></PieChart>
          </div>
        </div>
      </el-col>
</el-row>
  </div>
</template>

<script>
import { apiBaizhang, apiProgress } from "@/request/api";
import PieChart from "@/components/chart/pie";
export default {
  name: "App",
  components: {
    PieChart,
    BarChart,
    XbarChart,
    BarlineChart,
    MoreBarChart,
  },
  data() {
    return {
      flag: {
        baizhang: false, //是否开始渲染子组件
      },
      allData: {
        title: "总体产值",
        data: [
          { name: "已完成", value: 1600 },
          { name: "未完成", value: 180 },
        ],
      },
      oneData: {
        title: "100章产值",
        data: [
          { name: "已完成", value: 26 },
          { name: "未完成", value: 10 },
        ],
      },
      twoData: {
        title: "200章产值",
        data: [
          { name: "已完成", value: 26 },
          { name: "未完成", value: 1 },
        ],
      },
};
  },
  mounted() {
    let that = this;
    that.getBaizhangData();
  },
  methods: {
    getBaizhangData() {
      let that = this;
      apiBaizhang().then((res) => {
        if (res.code == "200" || res.code == 200) {
          let datas = res.result;
          that.allData = datas.all;
          that.oneData = datas[100];
          that.twoData = datas[200];
          that.threeData = datas[300];
          that.fourData = datas[400];
          that.fiveData = datas[500];
          that.sixData = datas[600];
          that.sevenData = datas[700];
          that.flag.baizhang = true;
        }
      });
    },
  },
};
</script>
子组件
<template>
  <div :id="id" :style="{ height: height,  width }" :data="datas"></div>
</template>

<script>
const echarts = require('echarts')
import $ from 'jquery'

export default {
  props: {
    height: '',
     '',
    id: '',
    datas: Object,
  },
  data() {
    return {}
  },
  mounted() {
    let that = this
    that.initPieChart()
    console.log('===',that.datas)
  },
  methods: {
    initPieChart() {
      let that = this
      var colors = [
        {
          borderColor: 'rgba(74,237,255,1)',
          start: 'rgba(74,237,255,0.1)',
          end: 'rgba(74,237,255,0.8)',
        },
        {
          borderColor: 'rgba(255,76,80,1)',
          start: 'rgba(255,76,80,0.1)',
          end: 'rgba(255,76,80,0.8)',
        },
        {
          borderColor: 'rgba(66,255,186,1)',
          start: 'rgba(66,255,186,0.1)',
          end: 'rgba(66,255,186,0.8)',
        },
        {
          borderColor: 'rgba(241,205,62,1)',
          start: 'rgba(241,205,62,0.1)',
          end: 'rgba(241,205,62,0.8)',
        },
      ]

      var fontsize = {
        xs: 20,
        small: 24,
        mid: 36,
        big: 48,
      }
      var myChart = echarts.init(document.getElementById(this.id), 'shine')
      let dataArr = []
      console.log(that.datas)
      that.datas.data.forEach(function (item, idx) {
        dataArr.push({
          value: item.value,
          name: item.name,
          itemStyle: {
            normal: {
              color: colors[idx].end,
            },
          },
        })
      })
      let option = {
        tooltip: {
          trigger: 'item',
          formatter: '{b} : {c} ({d}%)',
          textStyle: {
            fontSize: fontsize.small,
          },
        },
        title: [
          {
            text: that.datas.title,
            top: '55%',
            left: 'center',
            textStyle: {
              fontSize: fontsize.small,
              color: '#10c685',
              fontWeight: 700,
            },
          },
        ],
        legend: {
          //orient:'vertical', //图例的布局朝向
          x: 'center', //图例的位置--离左边的距离
          y: 'top', //图例的位置--离上边的距离
          itemGap: 16, //图例的间隔
          data: that.datas.data,
          textStyle: {
            color: '#00BEF0',
            fontSize: fontsize.small,
          },
          formatter: function (name) {
            var total = 0
            var target
            for (var i = 0, l = that.datas.data.length; i < l; i++) {
              total += that.datas.data[i].value
              if (that.datas.data[i].name == name) {
                target = that.datas.data[i].value
              }
            }
            return name + ' ' + target //((target / total) * 100).toFixed(2) + '%'
          },
        },
        toolbox: {
          show: true,
          feature: {
            mark: { show: true },
            dataView: { show: false, readOnly: false },
            magicType: {
              show: true,
              type: ['pie', 'funnel'],
            },
            restore: { show: false },
            saveAsImage: { show: false },
          },
        },
        calculable: true,
        series: [
          {
            type: 'pie',
            radius: ['45%', '60%'],
            center: ['50%', '60%'],
            hoverAnimation: false,
            labelLine: {
              normal: {
                show: false,
                length: 5,
                length2: 5,
              },
              emphasis: {
                show: false,
              },
            },
            data: dataArr,

            label: {
              normal: {
                show: false,
                formatter: '{d}%',
                fontSize: fontsize.xs,
              },
            },
          },
        ],
      }
      window.onresize = function () {
        myChart.resize()
      }
      myChart.setOption(option)
    },
  },
}
</script>