基本代码
<!DOCTYPE html>
<html lang="en">
<head>
  <meta charset="UTF-8">
  <title>canvas</title>
  <style>
    canvas{
        border:1px solid #ccc;
    }
  </style>
</head>
<body>
  <canvas width="800" height="400"></canvas>

  <script>
  var myCanvas=document.querySelector("canvas");
  var ctx=myCanvas.getContext("2d");  //准备画布

  ctx.beginPath();   //开启新路径,适用于只给当前元素添加属性
  ctx.moveTo(100,100);   //这里的直线起点
  ctx.lineTo(200,100);   //这里的直线终点
  ctx.strokeStyle="blue";   //描边的样式
  ctx.lineWidth=5;  //线条宽度
  ctx.stroke();  //描边

  ctx.beginPath();
  ctx.moveTo(100,200.5);  //为什么多用0.5?因为canvas的显示是以刻度算,在浏览器的2个px之间,也就是偏移了0.5个px。所以不手动偏移的话,线条看上去会粗一点,颜色偏灰色(线条默认为黑色,1px宽)
  ctx.lineTo(200,200.5);
  ctx.lineTo(200,300.5);
  ctx.closePath();    //自动闭合,避免闭合处有缺口问题
  ctx.strokeStyle="red";
  ctx.lineWidth=10;
  ctx.stroke();

  </script>
</body>
</html>
方法
ctx.beginPath();   //开启新路径,适用于只给当前元素添加属性
ctx.moveTo(100,100);   //这里的直线起点
ctx.lineTo(200,100);   //这里的直线终点
ctx.strokeStyle="blue";   //描边的样式
ctx.lineWidth=5;  //线条宽度
ctx.stroke();  //描边
ctx.fill();   //填充
ctx.fillStyle="red";  //填充样式
ctx.closePath();   //canvas自动闭合,注意和beginPath()没有任何关系
ctx.lineCap="butt";   //线条末端类型:butt(默认),round(圆弧),square(方形)
ctx.lineJoin="miter"   //拐点样式:miter(默认,尖的),round(圆弧),bevel(平的)
ctx.setLineDash([5,10]);   //设置线条为虚线,数组形式,5表示实线长度,10表示间隔长度。若设置[5,10,15],则表示实线5,间隔10,实线15,间隔5,实线10.。。。。
ctx.lineDashOffset=-20;   //偏移量    正值往左或上偏移,负值往右或下偏移
var y=ctx.canvas.height       //获取画布高度

ctx.rect(100,100,200,100)   //API:绘制矩形,rect(原点横坐标,原点纵坐标,矩形长度,矩形宽度)
ctx.strokeRect(100,100,200,100)   //绘制有描边的矩形
ctx.fillRect(100,100,200,100)   //绘制有填充的矩形
ctx.clearRect(100,100,200,100)   //擦除矩形,也可用于清除指定范围的画布

ctx.createLinearGradient(100,100,500,200);   //渐变api,createLinearGradient(起点横坐标,起点纵坐标,终点横坐标,终点纵坐标)(使用方法见下方例子)
知识点
-
canvas显示是在浏览器2个px之间的,各占0.5px,比如线条本来默认的是黑色,1px宽。但是由于其显示方式,浏览器的2个px各占0.5px,浏览器会自动填充满,因此线条宽看起来就是2px,而且颜色会因为填充而导致变浅,变成灰色。若想精准显示,则手动调整0.5px便可。
-
画一个三角形,线条宽度5px,会有起始点moveTo()和结束点lineTo()之间无法完全闭合的问题,可以使用.closePath()方法
-
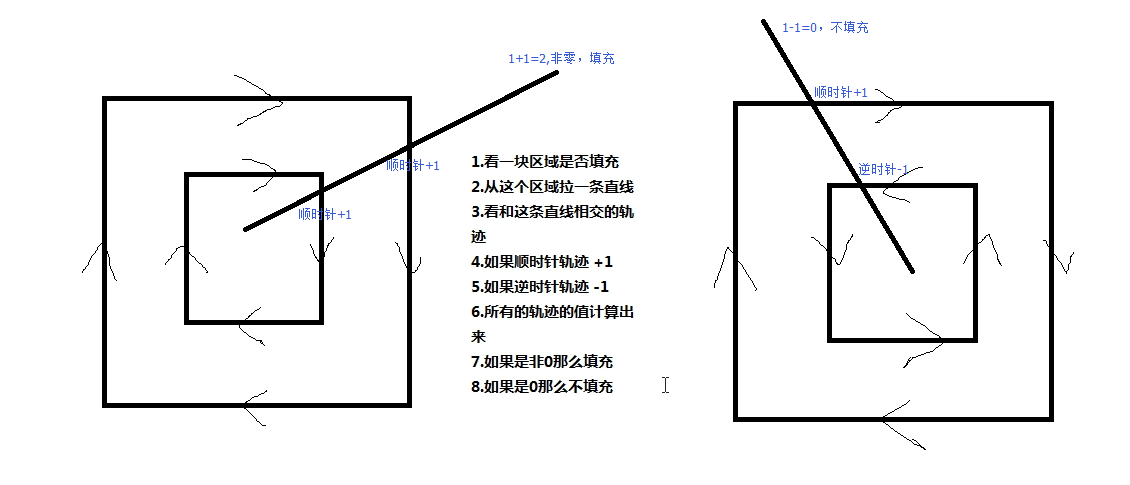
填充的时候遵循“非零环绕规则”
-
canvas API (https://developer.mozilla.org/zh-CN/docs/Web/API/Canvas_API/Tutorial)
绘制弧
    /*圆心x,圆心y,弧长,弧起点(0~Math.PI*2之间的任意一点),弧终点,绘制方向(true为逆时针,false为顺时针,默认为false)*/
    /*在中心位置画一个半径150px的圆弧左下角*/
    var w = ctx.canvas.width;
    var h = ctx.canvas.height;
    ctx.arc(w/2,h/2,150,Math.PI/2,Math.PI,true);
    ctx.stroke();


//若要绘制扇形,则需要有起始点和自动闭合
ctx.moveTo(w/2,h/2);
ctx.closePath();
绘制文本
var str="你好啊哈哈哈";
ctx.font = '40px Microsoft YaHei';     //设置字体大小及字体风格
ctx.strokeText(str,x0,y0,maxWidth);    //  描边形式绘制文本,.strokeText(需要绘制的文本,文本绘制起点横坐标(以文本左下角为基准),起点纵坐标,文本最大宽度(选填))
ctx.fillText(str,x0,y0,maxWidth);     //填充形式绘制文本
ctx.textAlign="center"    //文本水平对齐方式,center left(或start) right(或end)
ctx.textBaseline = 'middle';   //设置基线,即垂直对齐方式。top,bottom,middle
var width = ctx.measureText(str).width;    //获取文本宽度,.measureText(str).width
绘制图片
/*创建对象*/
    var image = new Image();
    /*绑定加载完成事件,图片必须加载完成才可以调用*/
    image.onload = function () {
        /*实现图片绘制*/
        /*绘制图片的三种方式*/

        /*3参数*/
        /*绘制在画布上的坐标 x y*/
        ctx.drawImage(image,100,100);

        /*5个参数*/
        /*图片对象*/
        /*绘制在画布上的坐标 x y*/
        /*是图片的大小:宽,高(不是裁剪,是缩放)*/
        ctx.drawImage(image,100,100,100,100);

        /*9个参数*/   //此方法是在一个原始图片上截图然后将截图展示在画布上
        /*图片对象*/
        /*图片上定位的坐标  x y */
        /*在图片上截取多大的区域  w h*/
        /*绘制在画布上的坐标 x y*/
        /*是图片的大小:宽,高(不是裁剪,是缩放)*/
        ctx.drawImage(image,400,400,400,400,200,200,100,100);

    };
    /*设置图片路径*/
    image.src = 'image/02.jpg';
坐标转换:平移,缩放,旋转(所有的转换对象都是坐标,而非图形)
ctx.translate(100,100);
ctx.scale(0.5,1);
ctx.rotate(Math.PI/6);
自动旋转的矩形
var startAngle = 0;
    ctx.translate(150,150);
    setInterval(function () {
        startAngle += Math.PI/180;
        ctx.rotate(startAngle);
        ctx.strokeRect(-50,-50,100,100);
    },500);
线条颜色渐变(由每个点的变化引起整体线的变化)
ctx.lineWidth = 30;
    for (var i = 0; i < 255; i++) {
        ctx.beginPath();
        ctx.moveTo(100+i-1,100);
        ctx.lineTo(100+i,100);
        ctx.strokeStyle = 'rgb('+i+',0,0)';
        ctx.stroke();
    }
矩形渐变
    var ctx = document.querySelector('canvas').getContext('2d');
    var change = ctx.createLinearGradient(100,100,500,200);   //渐变api,ctx.createLinerGradient(起点横坐标,起点纵坐标,终点横坐标,终点纵坐标)
    change.addColorStop(0,'pink');   //起点颜色
    change.addColorStop(0.5,'red');  //0.5处颜色
    change.addColorStop(1,'blue');   //终点颜色
    ctx.fillStyle = change;
    ctx.fillRect(100,100,400,100);
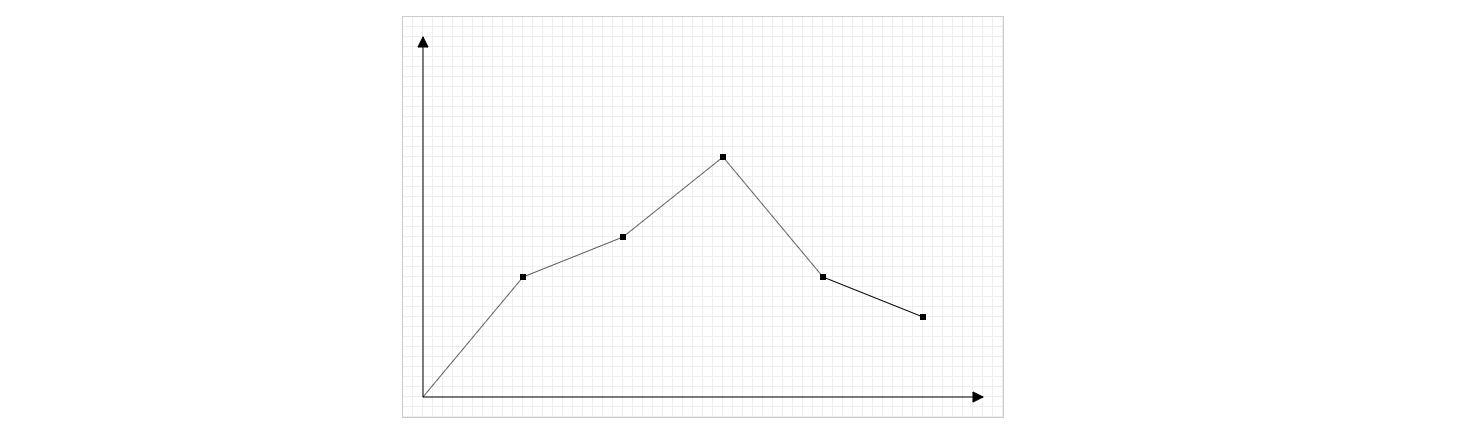
绘制折线图例子
<!DOCTYPE html>
<html lang="en">
<head>
    <meta charset="UTF-8">
    <title>Title</title>
    <style>
        canvas {
            border: 1px solid #ccc;
        }
    </style>
</head>
<body>
<canvas width="600" height="400"></canvas>
<script>
    /*1.构造函数*/
    var LineChart = function (ctx) {
        /*获取绘图工具*/
        this.ctx = ctx || document.querySelector('canvas').getContext('2d');
        /*画布的大小*/
        this.canvasWidth = this.ctx.canvas.width;
        this.canvasHeight = this.ctx.canvas.height;
        /*网格的大小*/
        this.gridSize = 10;
        /*坐标系的间距*/
        this.space = 20;
        /*坐标原点*/
        this.x0 = this.space;
        this.y0 = this.canvasHeight - this.space;
        /*箭头的大小*/
        this.arrowSize = 10;
        /*绘制点*/
        this.dottedSize = 6;
        /*点的坐标 和数据有关系  数据可视化*/
    }
    /*2.行为方法*/
    LineChart.prototype.init = function (data) {
        this.drawGrid();
        this.drawAxis();
        this.drawDotted(data);
    };
    /*绘制网格*/
    LineChart.prototype.drawGrid = function () {
        /*x方向的线*/
        var xLineTotal = Math.floor(this.canvasHeight / this.gridSize);
        this.ctx.strokeStyle = '#eee';
        for (var i = 0; i <= xLineTotal; i++) {
            this.ctx.beginPath();
            this.ctx.moveTo(0, i * this.gridSize - 0.5);
            this.ctx.lineTo(this.canvasWidth, i * this.gridSize - 0.5);
            this.ctx.stroke();
        }
        /*y方向的线*/
        var yLineTotal = Math.floor(this.canvasWidth / this.gridSize);
        for (var i = 0; i <= yLineTotal; i++) {
            this.ctx.beginPath();
            this.ctx.moveTo(i * this.gridSize - 0.5, 0);
            this.ctx.lineTo(i * this.gridSize - 0.5, this.canvasHeight);
            this.ctx.stroke();
        }
    };
    /*绘制坐标系*/
    LineChart.prototype.drawAxis = function () {
        /*X轴*/
        this.ctx.beginPath();
        this.ctx.strokeStyle = '#000';
        this.ctx.moveTo(this.x0, this.y0);
        this.ctx.lineTo(this.canvasWidth - this.space, this.y0);
        this.ctx.lineTo(this.canvasWidth - this.space - this.arrowSize, this.y0 + this.arrowSize / 2);
        this.ctx.lineTo(this.canvasWidth - this.space - this.arrowSize, this.y0 - this.arrowSize / 2);
        this.ctx.lineTo(this.canvasWidth - this.space, this.y0);
        this.ctx.stroke();
        this.ctx.fill();
        /*Y轴*/
        this.ctx.beginPath();
        this.ctx.strokeStyle = '#000';
        this.ctx.moveTo(this.x0, this.y0);
        this.ctx.lineTo(this.space, this.space);
        this.ctx.lineTo(this.space + this.arrowSize / 2, this.space + this.arrowSize);
        this.ctx.lineTo(this.space - this.arrowSize / 2, this.space + this.arrowSize);
        this.ctx.lineTo(this.space, this.space);
        this.ctx.stroke();
        this.ctx.fill();
    };
    /*绘制所有点*/
    LineChart.prototype.drawDotted = function (data) {
        /*1.数据的坐标 需要转换 canvas坐标*/
        /*2.再进行点的绘制*/
        /*3.把线连起来*/
        var that = this;
        /*记录当前坐标*/
        var prevCanvasX = 0;
        var prevCanvasY = 0;
        data.forEach(function (item, i) {
            /* x = 原点的坐标 + 数据的坐标 */
            /* y = 原点的坐标 - 数据的坐标 */
            var canvasX = that.x0 + item.x;
            var canvasY = that.y0 - item.y;
            /*绘制点*/
            that.ctx.beginPath();
            that.ctx.moveTo(canvasX - that.dottedSize / 2, canvasY - that.dottedSize / 2);
            that.ctx.lineTo(canvasX + that.dottedSize / 2, canvasY - that.dottedSize / 2);
            that.ctx.lineTo(canvasX + that.dottedSize / 2, canvasY + that.dottedSize / 2);
            that.ctx.lineTo(canvasX - that.dottedSize / 2, canvasY + that.dottedSize / 2);
            that.ctx.closePath();
            that.ctx.fill();
            /*点的连线*/
            /*当时第一个点的时候 起点是 x0 y0*/
            /*当时不是第一个点的时候 起点是 上一个点*/
            if(i == 0){
                that.ctx.beginPath();
                that.ctx.moveTo(that.x0,that.y0);
                that.ctx.lineTo(canvasX,canvasY);
                that.ctx.stroke();
            }else{
                /*上一个点*/
                that.ctx.beginPath();
                that.ctx.moveTo(prevCanvasX,prevCanvasY);
                that.ctx.lineTo(canvasX,canvasY);
                that.ctx.stroke();
            }
            /*记录当前的坐标,下一次要用*/
            prevCanvasX = canvasX;
            prevCanvasY = canvasY;
        });
    };
    /*3.初始化*/
    var data = [{x: 100,y: 120},{x: 200,y: 160},{x: 300,y: 240},{x: 400,y: 120},{x: 500,y: 80}];
    var lineChart = new LineChart();
    lineChart.init(data);
</script>
</body>
</html>
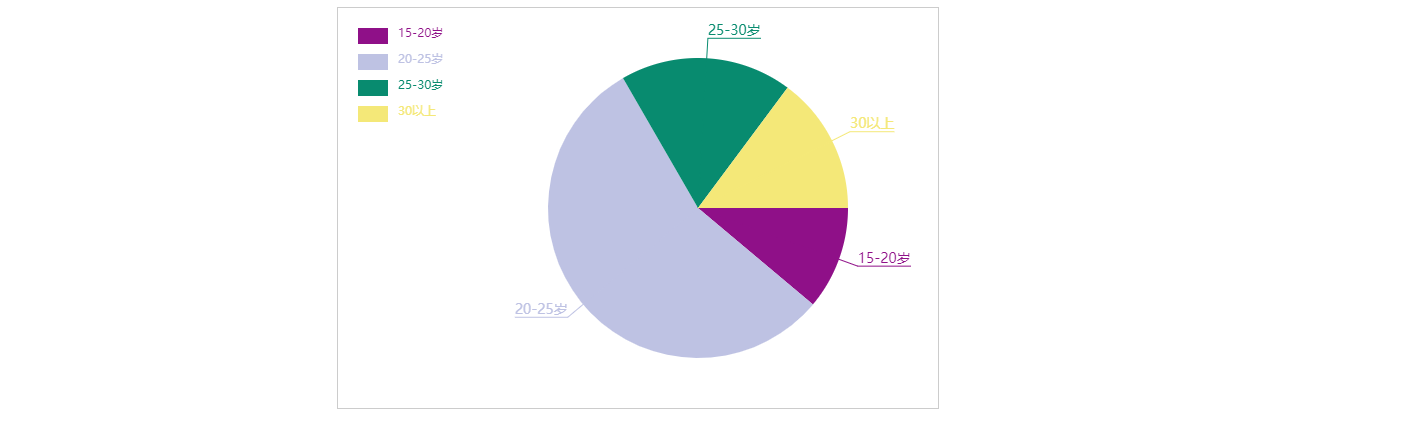
绘制饼状图例子
<!DOCTYPE html>
<html lang="en">
<head>
    <meta charset="UTF-8">
    <title>Title</title>
    <style>
        canvas {
            border: 1px solid #ccc;
            display: block;
            margin: 100px auto;
        }
    </style>
</head>
<body>
<canvas width="600" height="400"></canvas>
<script>
    /*var myCanvas = document.querySelector('canvas');
    var ctx = myCanvas.getContext('2d');*/

    /*1.绘制饼状态图*/
    /*1.1 根据数据绘制一个饼图*/
    /*1.2 绘制标题 从扇形的弧中心伸出一条线在画一条横线在横线的上面写上文字标题*/
    /*1.3 在画布的左上角 绘制说明 一个和扇形一样颜色的矩形 旁边就是文字说明*/

    var PieChart = function (ctx) {
        /*绘制工具*/
        this.ctx = ctx || document.querySelector('canvas').getContext('2d');
        /*绘制饼图的中心*/
        this.w = this.ctx.canvas.width;
        this.h = this.ctx.canvas.height;
        /*圆心*/
        this.x0 = this.w / 2 + 60;
        this.y0 = this.h / 2;
        /*半径*/
        this.radius = 150;
        /*伸出去的线的长度*/
        this.outLine = 20;
        /*说明的矩形大小*/
        this.rectW = 30;
        this.rectH = 16;
        this.space = 20;
    }
    PieChart.prototype.init = function (data) {
        /*1.准备数据*/
        this.drawPie(data);
    };
    PieChart.prototype.drawPie = function (data) {
        var that = this;
        /*1.转化弧度*/
        var angleList = this.transformAngle(data);
        /*2.绘制饼图*/
        var startAngle = 0;
        angleList.forEach(function (item, i) {
            /*当前的结束弧度要等于下一次的起始弧度*/
            var endAngle = startAngle + item.angle;
            that.ctx.beginPath();
            that.ctx.moveTo(that.x0, that.y0);
            that.ctx.arc(that.x0, that.y0, that.radius, startAngle, endAngle);
            var color = that.ctx.fillStyle = that.getRandomColor();
            that.ctx.fill();
            /*下一次要使用当前的这一次的结束角度*/
            /*绘制标题*/
            that.drawTitle(startAngle, item.angle, color , item.title);
            /*绘制说明*/
            that.drawDesc(i,item.title);
            startAngle = endAngle;
        });
    };
    PieChart.prototype.drawTitle = function (startAngle, angle ,color , title) {
        /*1.确定伸出去的线 通过圆心点 通过伸出去的点  确定这个线*/
        /*2.确定伸出去的点 需要确定伸出去的线的长度*/
        /*3.固定伸出去的线的长度*/
        /*4.计算这个点的坐标*/
        /*5.需要根据角度和斜边的长度*/
        /*5.1 使用弧度  当前扇形的起始弧度 + 对应的弧度的一半 */
        /*5.2 半径+伸出去的长度 */
        /*5.3 outX = x0 + cos(angle) * ( r + outLine)*/
        /*5.3 outY = y0 + sin(angle) * ( r + outLine)*/
        /*斜边*/
        var edge = this.radius + this.outLine;
        /*x轴方向的直角边*/
        var edgeX = Math.cos(startAngle + angle / 2) * edge;
        /*y轴方向的直角边*/
        var edgeY = Math.sin(startAngle + angle / 2) * edge;
        /*计算出去的点坐标*/
        var outX = this.x0 + edgeX;
        var outY = this.y0 + edgeY;
        this.ctx.beginPath();
        this.ctx.moveTo(this.x0, this.y0);
        this.ctx.lineTo(outX, outY);
        this.ctx.strokeStyle = color;
        /*画文字和下划线*/
        /*线的方向怎么判断 伸出去的点在X0的左边 线的方向就是左边*/
        /*线的方向怎么判断 伸出去的点在X0的右边 线的方向就是右边*/
        /*结束的点坐标  和文字大小*/
        this.ctx.font = '14px Microsoft YaHei';
        var textWidth = this.ctx.measureText(title).width ;
        if(outX > this.x0){
            /*右*/
            this.ctx.lineTo(outX + textWidth,outY);
            this.ctx.textAlign = 'left';
        }else{
            /*左*/
            this.ctx.lineTo(outX - textWidth,outY);
            this.ctx.textAlign = 'right';
        }
        this.ctx.stroke();
        this.ctx.textBaseline = 'bottom';
        this.ctx.fillText(title,outX,outY);

    };
    PieChart.prototype.drawDesc = function (index,title) {
        /*绘制说明*/
        /*矩形的大小*/
        /*距离上和左边的间距*/
        /*矩形之间的间距*/
        this.ctx.fillRect(this.space,this.space + index * (this.rectH + 10),this.rectW,this.rectH);
        /*绘制文字*/
        this.ctx.beginPath();
        this.ctx.textAlign = 'left';
        this.ctx.textBaseline = 'top';
        this.ctx.font = '12px Microsoft YaHei';
        this.ctx.fillText(title,this.space + this.rectW + 10 , this.space + index * (this.rectH + 10));
    };
    PieChart.prototype.transformAngle = function (data) {
        /*返回的数据内容包含弧度的*/
        var total = 0;
        data.forEach(function (item, i) {
            total += item.num;
        });
        /*计算弧度 并且追加到当前的对象内容*/
        data.forEach(function (item, i) {
            var angle = item.num / total * Math.PI * 2;
            item.angle = angle;
        });
        return data;
    };
    PieChart.prototype.getRandomColor = function () {
        var r = Math.floor(Math.random() * 256);
        var g = Math.floor(Math.random() * 256);
        var b = Math.floor(Math.random() * 256);
        return 'rgb(' + r + ',' + g + ',' + b + ')';
    };

    var data = [
        {
            title: '15-20岁',
            num: 6
        },
        {
            title: '20-25岁',
            num: 30
        },
        {
            title: '25-30岁',
            num: 10
        },
        {
            title: '30以上',
            num: 8
        }
    ];

    var pieChart = new PieChart();
    pieChart.init(data);

</script>
</body>
</html>
方向键控制行走的小人例子(绘制图片的相关知识)

<!DOCTYPE html>
<html lang="en">
<head>
    <meta charset="UTF-8">
    <title>Title</title>
    <style>
        canvas {
            border: 1px solid #ccc;
        }
    </style>
</head>
<body>
<canvas width="600" height="400"></canvas>
<script>
   //创建构造函数
    var Person = function (ctx) {
        /*绘制工具*/
        this.ctx = ctx || document.querySelector('canvas').getContext('2d');
        /*引入图片路径*/
        this.src = 'image/03.png';
        /*画布的大小*/
        this.canvasWidth = this.ctx.canvas.width;
        this.canvasHeight = this.ctx.canvas.height;

        /*行走相关参数*/

        this.stepSzie = 10; //行走步伐大小
        this.direction = 0; //行走方向, 0前 1左 2右 3后
        this.stepX = 0; //x轴方向的偏移步数
        this.stepY = 0; //y轴方向的偏移步数

        /*初始化方法*/
        this.init();
    };

    //初始化方法
    Person.prototype.init = function () {
        var that = this;
        /*1.加载图片*/
        this.loadImage(function (image) {
            /*图片的大小*/
            that.imageWidth = image.width;
            that.imageHeight = image.height;
            /*人物的大小*/
            that.personWidth = that.imageWidth / 4;
            that.personHeight = that.imageHeight / 4;
            /*绘制图片的起点*/
            that.x0 = that.canvasWidth / 2 - that.personWidth / 2;    //为什么减去that.personWidth/2?与css盒子居中原理类似
            that.y0 = that.canvasHeight / 2 - that.personHeight / 2;
            /*2.默认绘制在中心位置正面朝外*/
            that.ctx.drawImage(image,
                0,0,
                that.personWidth,that.personHeight,
                that.x0,that.y0,
                that.personWidth,that.personHeight);

            /*3.能通过方向键去控制人物行走*/
            that.index = 0;
            document.onkeydown = function (e) {
                if(e.keyCode == 40){
                    that.direction = 0;
                    that.stepY ++;    //步数偏移(走了多少步)
                    that.drawImage(image);   //调用函数绘制图片
                    /*前*/
                }else if(e.keyCode == 37){
                    that.direction = 1;
                    that.stepX --;
                    that.drawImage(image);
                    /*左*/
                }else if(e.keyCode == 39){
                    that.direction = 2;
                    that.stepX ++;
                    that.drawImage(image);
                    /*右*/
                }else if(e.keyCode == 38){
                    that.direction = 3;
                    that.stepY --;
                    that.drawImage(image);
                    /*后*/
                }
            }
        });
    }

    /*加载图片专用函数*/
    Person.prototype.loadImage = function (callback) {   //这个函数只用来设定加载图片,所以传一个callback回调,用来实现分离
        var image = new Image();   //实例化一个图片对象
        image.onload = function () {    //图片必须加载完成后才能调用,所以谢了这个函数
            callback && callback(image);
        };
        image.src = this.src;    //引入图片路径
    };

    /*绘制图片*/
    Person.prototype.drawImage = function (image) {
        this.index ++;    //通过index,动态控制小人位置,如this.index*this.personWidth
        this.ctx.clearRect(0,0,this.canvasWidth,this.canvasHeight);   //清除画布

        /*绘图*/
        /*在精灵图上的定位 x  索引*/
        /*在精灵图上的定位 y  方向*/
        this.ctx.drawImage(image,
            this.index * this.personWidth,this.direction * this.personHeight,
            this.personWidth,this.personHeight,
            this.x0 + this.stepX * this.stepSzie ,this.y0 + this.stepY * this.stepSzie,
            this.personWidth,this.personHeight);
        /*如果索引超出了 ,则重新设为0*/
        if(this.index >= 3){
            this.index = 0;
        }
    };


    new Person();

</script>
</body>
</html>