整体架构
filebeat收集日志 -> kafka ->logstash -> kibana
一、Filebeat
- filebeat部署
ansible playbook
---
- name: removed old tar
  file:
    path: /tmp/filebeat-5.5.2.tar.gz
    state: absent

- name: wget filebeat-5.5.2.tar.gz
  get_url:
    url: url
    dest: /tmp/filebeat-5.5.2.tar.gz

- name: unarchive filebeat
  unarchive:
    src: /tmp/filebeat-5.5.2.tar.gz
    dest: /export/servers/
    remote_src: yes

- name: create service dir
  file:
    src: /export/servers/filebeat-5.5.2-linux-x86_64
    dest: /export/servers/filebeat-5.5.2
    state: link
    owner: admin
    group: admin

- name: copy config file
  copy:
    src: opentsdb.yml
    dest: /export/servers/filebeat-5.5.2/filebeat.yml
    owner: admin
    group: admin

- name: stop filebeat service
  become: yes
  become_user: admin
  become_method: su
  shell: ps -ef | grep filebeat | grep -v grep | awk '{ print $2}' | xargs kill
  args:
    executable: /bin/bash
  ignore_errors: yes
  tags:
    - stop

- name: start filebeat service
  become: yes
  become_user: admin
  become_method: su
  shell: nohup ./filebeat -c filebeat.yml &
  args:
    executable: /bin/bash
    chdir: /export/servers/filebeat-5.5.2
  ignore_errors: yes
  tags:
    - start
- filebeat配置文件
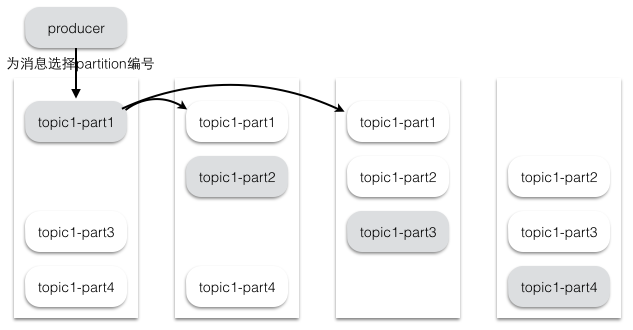
对数据流按照 input_type 级别的打标,通过 document_type 关键字申明:
filebeat.prospectors:
- input_type: log
  paths:
    - /home/admin/soft/filebeat-5.2.1-linux-x86_64/logs/filebeat
  document_type: fb_log
- input_type: log
  paths:
    - /home/admin/soft/elasticsearch-5.2.1/logs/elasticsearch.log
  document_type: es_log
每次只收集追加的日志,不读全部日志
# Optional fields that you can specify to add additional information to the
# output.
  tail_files: "true"
filebeat收集到的数据扔kafka,上面有几个document_type就需要在kafka上create几个topic
output.kafka:
  hosts: ["172.16.134.3:9092"] #kafka多台列表格式
  topic: '%{[type]}' #kafka topic,修改上面对应的document_type即可
  partition.round_robin:
    reachable_only: false
  required_acks: 1
  compression: gzip
  max_message_bytes: 1000000
二、Kafka
Kafka专用术语:
-
Broker:消息中间件处理结点,一个Kafka节点就是一个broker,多个broker可以组成一个Kafka集群。
-
Topic:一类消息,Kafka集群能够同时负责多个topic的分发。
-
Partition:topic物理上的分组,一个topic可以分为多个partition,每个partition是一个有序的队列。
-
Segment:partition物理上由多个segment组成。
-
offset:每个partition都由一系列有序的、不可变的消息组成,这些消息被连续的追加到partition中。partition中的每个消息都有一个连续的序列号叫做offset,用于partition唯一标识一条消息
topic & partition
在Kafka文件存储中,同一个topic下有多个不同partition,每个partition为一个目录,partiton命名规则为topic名称+有序序号,第一个partiton序号从0开始,序号最大值为partitions数量减1。
这里也就是broker——>topic——>partition——>segment
segment file组成:由2大部分组成,分别为index file和data file,此2个文件一一对应,成对出现,后缀".index"和“.log”分别表示为segment索引文件、数据文件
副本(replication)策略
1.数据同步
kafka 0.8后提供了Replication机制来保证Broker的failover。
引入Replication之后,同一个Partition可能会有多个Replica,而这时需要在这些Replication之间选出一个Leader,Producer和Consumer只与这个Leader交互,其它Replica作为Follower从Leader中复制数据。
2.副本放置策略
Kafka分配Replica的算法如下(注意!!! 下面的broker、partition副本数这些编号都是从0开始编号的):
将所有存活的N个Brokers和待分配的Partition排序
将第i个Partition分配到第(i mod n)个Broker上,这个Partition的第一个Replica存在于这个分配的Broker上,并且会作为partition的优先副本( 这里就基本说明了一个topic的partition在集群上的大致分布情况 )
将第i个Partition的第j个Replica分配到第((i + j) mod n)个Broker上
假设集群一共有4个brokers,一个topic有4个partition,每个Partition有3个副本。下图是每个Broker上的副本分配情况。
kafka常用命令
查看所有topic:bin/kafka-topics.sh --zookeeper ip:2181 --list
查看topic的详细信息:./kafka-topics.sh -zookeeper ip:2181 -describe -topic topicname
创建topic:./kafka-topics.sh --create --zookeeper ip:2181 --replication-factor 1 --partitions 1 --topic topicname
为topic增加partition:./bin/kafka-topics.sh –zookeeper localhost:2181 –alter –partitions 20 –topic topicname
kafka生产者客户端命令:./kafka-console-producer.sh --broker-list ip:9092 --topic topicname
kafka消费者客户端命令:./kafka-console-consumer.sh -zookeeper ip:2181 --from-beginning --topic topicname
执行消费组,查看某个topic的消费情况:
./bin/kafka-consumer-groups.sh --bootstrap-server 172.28.117.118:9092 --group test-group --describe
查看所有topic
./bin/kafka-topics.sh --list --zookeeper 172.28.117.118:2181
查看所有group
sh kafka-consumer-groups.sh --bootstrap-server 172.28.117.118:9092 --list
三、logstash
java版本升级8.0
配置文件
input {
    kafka {
        bootstrap_servers => "172.28.117.116:9092,172.28.117.118:9092,172.28.117.120:9092" #kafka server
        topics => ["tsdb-log"] #kafka topic
        group_id => "tsdb-log"
        consumer_threads => 1
        decorate_events => true
        codec => "json"
    }
}

filter {
    grok {
        match => [
            "message", "%{TIMESTAMP_ISO8601:log_date}s(?<logInfo>[.*?]+?)s(?<id_str>([id:))s(?<id>[0-9a-z]{10}?)(?<from_to>.*?]+?)sHTTP %{URIPATHPARAM}sdonesins%{INT:query_time}"
        ] #正则匹配,grok debugger
        remove_field => [ "id_str","from_to","URIPATHPARAM" ] #remove字段
    }
    mutate { convert => {"query_time" => "integer"} } #数据类型转换int
    date { match => ["log_date", "ISO8601"] } #记录的时间是日志产生的时间,不是进入es的时间

}

output {
    if [URIPARAM] != "null" and [logInfo] == "[net.opentsdb.tsd.HttpQuery.logInfo]"{
        elasticsearch {
                hosts => ["172.28.147.77:9200","172.28.147.70:9200","172.28.117.116:9200","172.28.117.118:9200","172.28.117.120:9200","172.28.117.122:9200","172.28.117.124:9200","172.28.147.151:9200"]
                index => "opentsdb-querytime-%{+YYYY.MM.dd}" #es中的index,kinaba中index增加opentsdb-querytime-*
                document_type => "common"
        }

    }
}
启动logstash
nohup ./bin/logstash -w 32 -b 5000 -f logstash.recproxy.conf --path.data=/tmp/recproxy --http.port 9997 --config.reload.automatic >nohup.out 2>&1 &
四、elasticsearch
es故障处理
查看es集群状态
curl -XGET 'http://unknow.com/_cat/health?v&pretty'
查看哪个分片有问题
curl -s "http://localhost:9200/_cat/shards" | grep UNASSIGNED
查看unassigned原因
curl http://localhost:9200/_cluster/allocation/explain?pretty -d '{"index":"index-name","shard":0,"primary":true}'
定位原因,磁盘满了
手动移走shard
curl -XPOST 'http://localhost:9200/_cluster/reroute?retry_failed=5&pretty' -d '
{
    "commands" : [ {
        "allocate_stale_primary" : {
            "index" : "recproxy-2018.08.15",
            "shard" :4,
            "node" : "nodename",
            "accept_data_loss" : true
        }
    }]
}'