1: %%%%%%%%%%%%%%%%%%%%%%%%%%%%%%%%%%info%%%%%%%%%%%%%%%%%%%%%%%%%%%%%%%%%%%%%
2: %author: Yang Li
3: %email: yangli0534@gmail.com
4: %data:2013/12/16
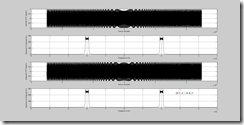
5: %%%%%%%%%%%%%%%%%%%%%%%%%%%%%%%IF signal generation%%%%%%%%%%%%%%%%%%%%%%%%%
6: b=2e6;
7: taup=50/1e6;
8: fc=20e6;
9:
10: n = fix(50 * taup * b);
11: t = linspace(-taup/2,taup/2,n);
12: s= exp(i * pi * (b/taup) .* t.^2 + i * 2 * pi * fc .* t);
13: figure(1)
14: subplot(4,1,1)
15: plot(t,real(s),'k')
16: ylabel('real part of IF signal s')
17: xlabel('time in seconds')
18: grid
19: subplot(4,1,2)
20: sampling_interval = 1 / 5 /fc;
21: freqlimit = 0.5/ sampling_interval;
22: freq = linspace(-freqlimit,freqlimit,n);
23: plot(freq,fftshift(abs(fft(real(s)))),'k');
24: ylabel('Spectrum of real part of s')
25: xlabel('Frequency in Hz')
26:
27: grid
28: subplot(4,1,3)
29: plot(t,imag(s),'k')
30: ylabel('imag part of IF signal s')
31: xlabel('time in seconds')
32: grid
33:
34: subplot(4,1,4)
35:
36: plot(freq,fftshift(abs(fft(imag(s)))),'k');
37: ylabel('Spectrum of imag part of s')
38: xlabel('Frequency in Hz')
39: grid
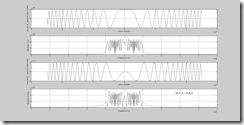
40: %%%%%%%%%%%%%%%%%%%%%%%%%%%%%%%%%mixer%%%%%%%%%%%%%%%%%%%%%%%%%%%%%%%%%%%%%
41: lo = exp(i*2 * pi * fc .* t);
42: smi = real(s) .* real(lo);
43: figure(2)
44: subplot(4,1,1)
45: plot(t, smi,'k')
46: ylabel('real part of signal sm after mixed')
47: xlabel('time in seconds')
48: grid
49: subplot(4,1,2)
50: sampling_interval = 1 / 5 /fc;
51: freqlimit = 0.5/ sampling_interval;
52: freq = linspace(-freqlimit,freqlimit,n);
53: plot(freq,fftshift(abs(fft( smi ))),'k');
54: ylabel('Spectrum of smi')
55: xlabel('Frequency in Hz')
56: grid
57:
58: smq = real(s) .* imag(lo);
59:
60: subplot(4,1,3)
61: plot(t, smq,'k')
62: ylabel('imap part of signal sm after mixed')
63: xlabel('time in seconds')
64: grid
65: subplot(4,1,4)
66: sampling_interval = 1 / 5 /fc;
67: freqlimit = 0.5/ sampling_interval;
68: freq = linspace(-freqlimit,freqlimit,n);
69: plot(freq,fftshift(abs(fft( smq ))),'k');
70: ylabel('Spectrum of smq')
71: xlabel('Frequency in Hz')
72: grid
73:
74:
75: %%%%%%%%%%%%%%%%%%%%%%%%%%%%%CIC filter %%%%%%%%%%%%%%%%%%%%%%%%%%%%%%%%%%%
76: decf = 10; % Decimation Factor
77: diffd = 1; % Differential Delay
78: numsecs = 5; % Number of Sections
79:
80: hm = mfilt.cicdecim(decf, diffd, numsecs);
81: sci=double(filter(hm,smi));
82: scq=double(filter(hm,smq));
83: n=length(sci);
84: t = linspace(-taup/2,taup/2,n);
85: figure(3)
86: subplot(4,1,1)
87: plot(t, sci,'k')
88: ylabel('real part of signal smi after cic filter')
89: xlabel('time in seconds')
90: grid
91: subplot(4,1,2)
92: sampling_interval = 1 / 5 /fc;
93: freqlimit = 0.5/ sampling_interval;
94: freq = linspace(-freqlimit,freqlimit,n);
95: plot(freq,fftshift(abs(fft( sci ))),'k');
96: ylabel('Spectrum of sci')
97: xlabel('Frequency in Hz')
98: grid
99:
100:
101:
102: subplot(4,1,3)
103: plot(t, scq,'k')
104: ylabel('imap part of signal sm after mixed')
105: xlabel('time in seconds')
106: grid
107: subplot(4,1,4)
108: sampling_interval = 1 / 5 /fc;
109: freqlimit = 0.5/ sampling_interval;
110: freq = linspace(-freqlimit,freqlimit,n);
111: plot(freq,fftshift(abs(fft( scq ))),'k');
112: ylabel('Spectrum of smq')
113: xlabel('Frequency in Hz')
114: grid
115:
116: %%%%%%%%%%%%%%%%%%%%%%%%%%%%%lpf filter %%%%%%%%%%%%%%%%%%%%%%%%%%%%%%%%%%%
117: Fs = 9.98; % Sampling Frequency
118:
119: Fpass = 1; % Passband Frequency
120: Fstop = 1.5; % Stopband Frequency
121: Dpass = 0.057501127785; % Passband Ripple
122: Dstop = 0.0001; % Stopband Attenuation
123: dens = 20; % Density Factor
124:
125: % Calculate the order from the parameters using FIRPMORD.
126: [N, Fo, Ao, W] = firpmord([Fpass, Fstop]/(Fs/2), [1 0], [Dpass, Dstop]);
127:
128: % Calculate the coefficients using the FIRPM function.
129: b = firpm(N, Fo, Ao, W, {dens});
130: Hd = dfilt.dffir(b);
131:
132: spi=double(filter(Hd,sci));
133: spq=double(filter(Hd,scq));
134: n=length(spi);
135: t = linspace(-taup/2,taup/2,n);
136: figure(4)
137: subplot(4,1,1)
138: plot(t, spi,'k')
139: ylabel('real part of signal spi after lpf filter')
140: xlabel('time in seconds')
141: grid
142: subplot(4,1,2)
143: sampling_interval = 1 / 5 /fc;
144: freqlimit = 0.5/ sampling_interval;
145: freq = linspace(-freqlimit,freqlimit,n);
146: plot(freq,fftshift(abs(fft( spi ))),'k');
147: ylabel('Spectrum of spi')
148: xlabel('Frequency in Hz')
149: grid
150:
151:
152:
153: subplot(4,1,3)
154: plot(t, spq,'k')
155: ylabel('imap part of signal sm after lpf filter')
156: xlabel('time in seconds')
157: grid
158: subplot(4,1,4)
159: sampling_interval = 1 / 5 /fc;
160: freqlimit = 0.5/ sampling_interval;
161: freq = linspace(-freqlimit,freqlimit,n);
162: plot(freq,fftshift(abs(fft( spq ))),'k');
163: ylabel('Spectrum of smq')
164: xlabel('Frequency in Hz')
165: grid


