vnstat流量统计(2.8版本)
vnStat 是一个基于控制台的 Linux 和 BSD 网络流量监视器,它为所选接口保留网络流量日志。它使用内核提供的网络接口统计信息作为信息源。这意味着 vnStat 实际上不会嗅探任何流量,并且无论网络流量率如何,都可以确保少量使用系统资源。
这个程序是开源/GPL 的,可以作为root 用户或单个用户安装。
特点
- 安装和运行快速简单
- 收集的统计信息在系统重启后仍然存在
- 可以同时监控多个接口
- 几个输出选项
- 总结,5 分钟,每小时,每天,每月,每年,最重要的日子
- 可选的 png 图像输出(使用 libgd)
- 数据保留时间完全由用户动态配置
- 月份可以配置为遵循计费周期
- 轻量级,最少的资源使用
- 无论流量如何,CPU 使用率都一样低
- 无需root权限即可使用
- 在线颜色配置编辑器
安装配置vnstat
先决条件
- make
- C compiler
- user with access to kernel interface statistics
- usually available by default but can be restricted for example by grsecurity and similar security enhancement suites or settings
- sqlite3 (library and development files)
- libgd (optional, image output)
- check (optional, test suite)
- pkg-config (optional, for check detection)
- autotools (optional, for recreating configure and makefiles)
安装
wget https://github.com/vergoh/vnstat/releases/download/v2.8/vnstat-2.8.tar.gz

tar zxf vnstat-2.8.tar.gz

cd vnstat-2.8

./configure --prefix=/usr --sysconfdir=/etc && make && make install

mkdir /var/lib/vnstat

chmod -R 777 /var/lib/vnstat/
配置system启动
cp -v examples/systemd/vnstat.service /etc/systemd/system/
systemctl enable vnstat
systemctl start vnstat
systemctl restart vnstat
注意:如果是较旧的版本使用下面的命令
cp -v examples/systemd/simple/vnstat.service /etc/systemd/system/
systemctl enable vnstat
systemctl start vnstat
其它系统
- Debian
cp -v examples/init.d/debian/vnstat /etc/init.d/
update-rc.d vnstat defaults
service vnstat start
- Red Hat / CentOS
cp -v examples/init.d/redhat/vnstat /etc/init.d/
chkconfig vnstat on
service vnstat start
-
upstart
cp -v examples/upstart/vnstat.conf /etc/init/
initctl start vnstat
在首次启动期间,守护程序 (vnstatd) 应列出并添加所有可用的监控接口。根据配置,vnstat 命令可能需要几分钟时间才能开始显示结果,因为数据库中的条目不会不断更新。
可以通过以下方式停止对不需要的接口的监视:
vnstat --remove -i eth0
如果需要添加
vnstat --add -i eth0
vnstat使用
vnstat命令参数详解
这里是最新版2.8的参数
[root@linux vnstat]# vnstat --help
vnStat 2.8 by Teemu Toivola <tst at iki dot fi>

      -5,  --fiveminutes [limit]   show 5 minutes
      -h,  --hours [limit]         show hours
      -hg, --hoursgraph            show hours graph
      -d,  --days [limit]          show days
      -m,  --months [limit]        show months
      -y,  --years [limit]         show years
      -t,  --top [limit]           show top days

      -b, --begin <date>           set list begin date
      -e, --end <date>             set list end date

      --oneline [mode]             show simple parsable format
      --json [mode] [limit]        show database in json format
      --xml [mode] [limit]         show database in xml format

      -tr, --traffic [time]        calculate traffic
      -l,  --live [mode]           show transfer rate in real time
      -i,  --iface <interface>     select interface

Use "--longhelp" or "man vnstat" for complete list of options.
vnstat
查看所以接口流量统计情况
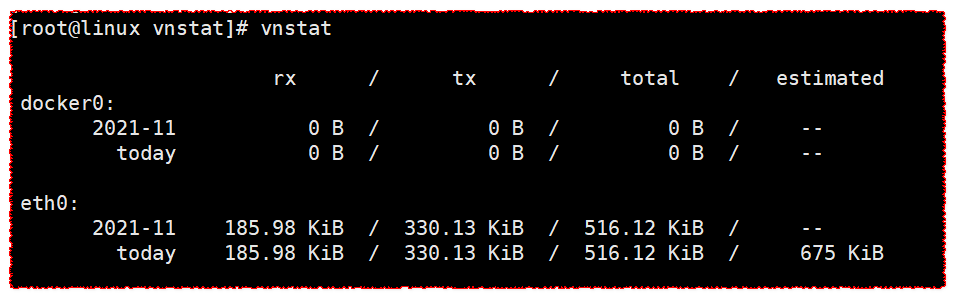
[root@linux vnstat]# vnstat

                      rx      /      tx      /     total    /   estimated
 docker0:
       2021-11           0 B  /         0 B  /         0 B  /     --
         today           0 B  /         0 B  /         0 B  /     --

 eth0:
       2021-11    185.98 KiB  /  330.13 KiB  /  516.12 KiB  /     --
         today    185.98 KiB  /  330.13 KiB  /  516.12 KiB  /     675 KiB
rx:rx是接收(receive)
tx:tx是发送(transport)
total:总计
estimated:估计
vnstat -5
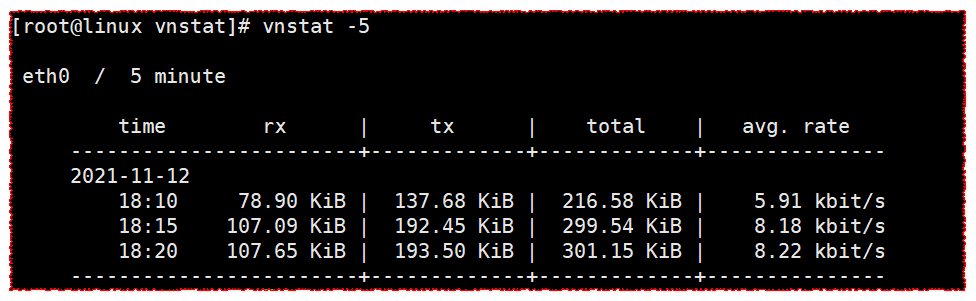
按照每五分钟查看
[root@linux vnstat]# vnstat -5

 eth0  /  5 minute

         time        rx      |     tx      |    total    |   avg. rate
     ------------------------+-------------+-------------+---------------
     2021-11-12
         18:10     78.90 KiB |  137.68 KiB |  216.58 KiB |    5.91 kbit/s
         18:15    107.09 KiB |  192.45 KiB |  299.54 KiB |    8.18 kbit/s
         18:20    107.65 KiB |  193.50 KiB |  301.15 KiB |    8.22 kbit/s
     ------------------------+-------------+-------------+---------------
time:时间
rx:rx是接收(receive)
tx:tx是发送(transport)
total:总计
avg. rate:平均速度
vnstat -h
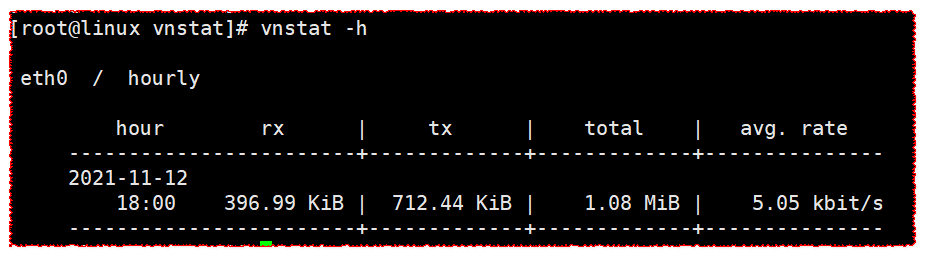
按小时查看
[root@linux vnstat]# vnstat -h

 eth0  /  hourly

         hour        rx      |     tx      |    total    |   avg. rate
     ------------------------+-------------+-------------+---------------
     2021-11-12
         18:00    396.99 KiB |  712.44 KiB |    1.08 MiB |    5.05 kbit/s
     ------------------------+-------------+-------------+---------------
vnstat -hg
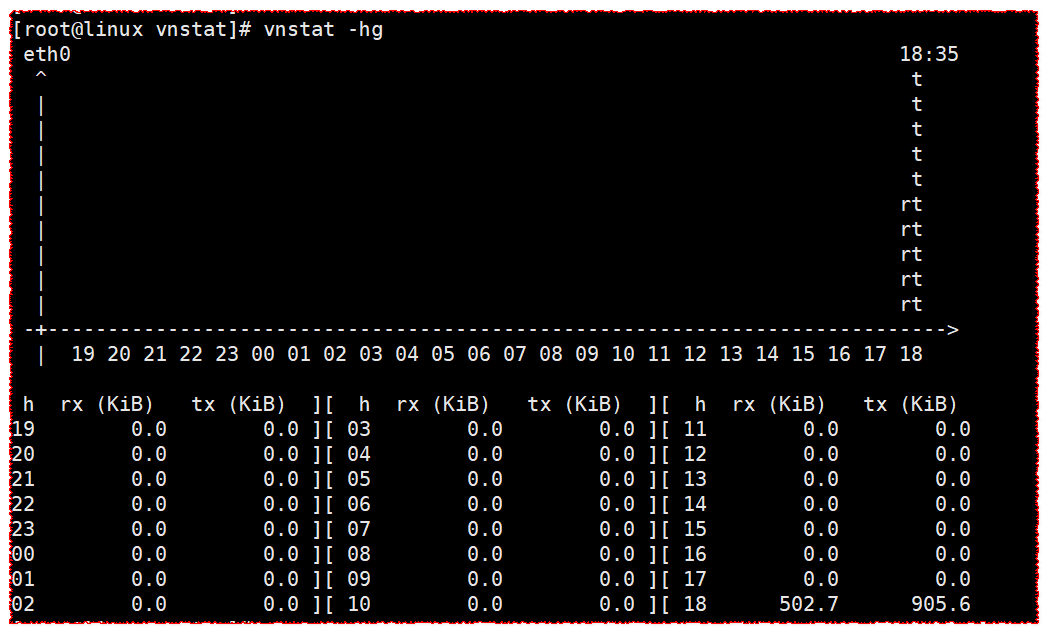
显示小时图
[root@linux vnstat]# vnstat -hg
 eth0                                                                     18:35
  ^                                                                        t
  |                                                                        t
  |                                                                        t
  |                                                                        t
  |                                                                        t
  |                                                                       rt
  |                                                                       rt
  |                                                                       rt
  |                                                                       rt
  |                                                                       rt
 -+--------------------------------------------------------------------------->
  |  19 20 21 22 23 00 01 02 03 04 05 06 07 08 09 10 11 12 13 14 15 16 17 18

 h  rx (KiB)   tx (KiB)  ][  h  rx (KiB)   tx (KiB)  ][  h  rx (KiB)   tx (KiB)
19        0.0        0.0 ][ 03        0.0        0.0 ][ 11        0.0        0.0
20        0.0        0.0 ][ 04        0.0        0.0 ][ 12        0.0        0.0
21        0.0        0.0 ][ 05        0.0        0.0 ][ 13        0.0        0.0
22        0.0        0.0 ][ 06        0.0        0.0 ][ 14        0.0        0.0
23        0.0        0.0 ][ 07        0.0        0.0 ][ 15        0.0        0.0
00        0.0        0.0 ][ 08        0.0        0.0 ][ 16        0.0        0.0
01        0.0        0.0 ][ 09        0.0        0.0 ][ 17        0.0        0.0
02        0.0        0.0 ][ 10        0.0        0.0 ][ 18      502.7      905.6
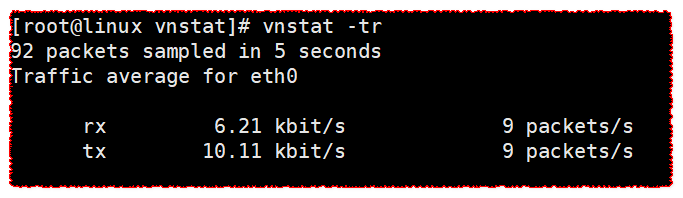
vnstat -tr
计算流量(calculate traffic)
[root@linux vnstat]# vnstat -tr
92 packets sampled in 5 seconds
Traffic average for eth0

      rx         6.21 kbit/s             9 packets/s
      tx        10.11 kbit/s             9 packets/s
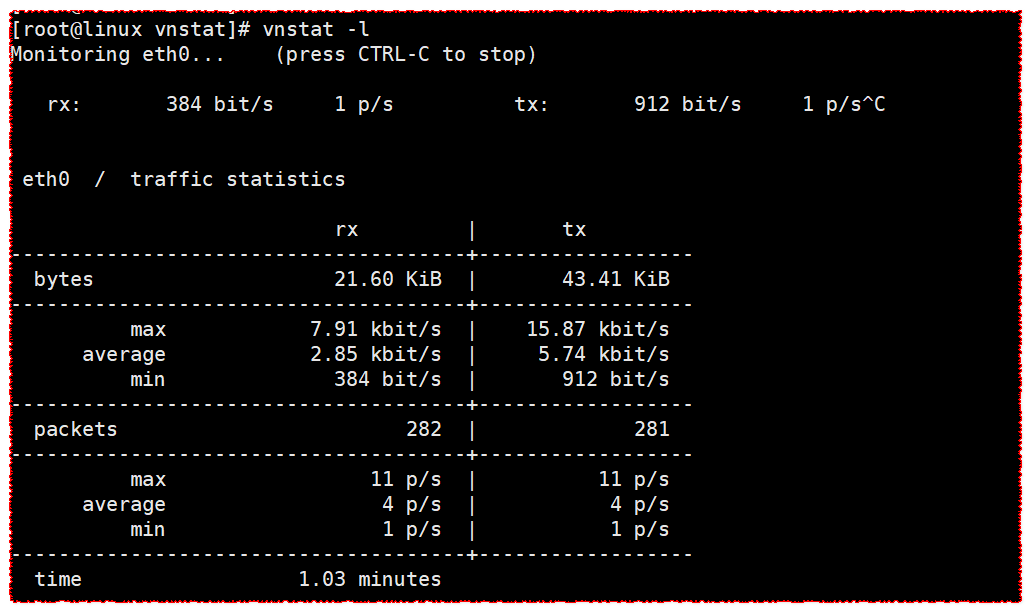
vnstat -l
显示实时传输率
[root@linux vnstat]# vnstat -l
Monitoring eth0...    (press CTRL-C to stop)

   rx:       384 bit/s     1 p/s          tx:       912 bit/s     1 p/s^C


 eth0  /  traffic statistics

                           rx         |       tx
--------------------------------------+------------------
  bytes                    21.60 KiB  |       43.41 KiB
--------------------------------------+------------------
          max            7.91 kbit/s  |    15.87 kbit/s
      average            2.85 kbit/s  |     5.74 kbit/s
          min              384 bit/s  |       912 bit/s
--------------------------------------+------------------
  packets                        282  |             281
--------------------------------------+------------------
          max                 11 p/s  |          11 p/s
      average                  4 p/s  |           4 p/s
          min                  1 p/s  |           1 p/s
--------------------------------------+------------------
  time                  1.03 minutes
还有好多用法,比如按天,按月等等,大家可以自行尝试。
报错解决
错误一
configure: error: could not find required sqlite3 library
解决方法
Ubuntu
# Ubuntu
apt-get install sqlite3
apt-get install libsqlite3-dev
CentOS
# CentOS
# 方法一
wget http: //www.sqlite.org/sqlite-autoconf-3070500.tar.gz
tar xvzf sqlite-autoconf-3070500.tar.gz
cd sqlite-autoconf-3070500
./configure
make
make install

# 方法二:
yum install -y sqlite-devel

# 方法三:
yum install -y sqlite3-ruby
查看版本信息:sqlite3 -version
终端进入命令:sqlite3
错误二
configure: error: no acceptable C compiler found in $PATH
解决方法
Ubuntu
# Ubuntu
apt install 'g++'
CentOS
方法一
yum -y install gcc gcc-c++

方法二
wget http://ftp.mirrorservice.org/sites/sourceware.org/pub/gcc/releases/gcc-9.4.0/gcc-9.4.0.tar.gz
tar zxf gcc-9.4.0.tar.gz
cd gcc-9.4.0
yum -y install bzip2
./contrib/download_prerequisites
./configure --disable-multilib --enable-languages=c,c++
make -j 4
make install
错误三
error: Cannot download mpfr-3.1.4.tar.bz2 from ftp://gcc.gnu.org/pub/gcc/infrastructure/
error: Cannot download mpc-1.0.3.tar.gz from ftp://gcc.gnu.org/pub/gcc/infrastructure/
error: Cannot download gmp-6.1.0.tar.bz2 from ftp://gcc.gnu.org/pub/gcc/infrastructure/
wget https://gmplib.org/download/gmp/gmp-6.1.0.tar.lz
wget https://www.mpfr.org/mpfr-current/mpfr-3.1.4.tar.bz2
wget https://ftp.gnu.org/gnu/mpc/mpc-1.0.3.tar.gz
wget https://gcc.gnu.org/pub/gcc/infrastructure/isl-0.18.tar.bz2