matlab曲面拟合
加载数据:
load franke;
拟合曲面:
surffit = fit([x,y],z,'poly23','normalize','on')
输出:

     Linear model Poly23:
     surffit(x,y) = p00 + p10*x + p01*y + p20*x^2 + p11*x*y + p02*y^2 + p21*x^2*y
                    + p12*x*y^2 + p03*y^3
       where x is normalized by mean 1982 and std 868.6
       and where y is normalized by mean 0.4972 and std 0.2897
     Coefficients (with 95% confidence bounds):
       p00 =      0.4253  (0.3928, 0.4578)
       p10 =      -0.106  (-0.1322, -0.07974)
       p01 =     -0.4299  (-0.4775, -0.3822)
       p20 =     0.02104  (0.001457, 0.04062)
       p11 =     0.07153  (0.05409, 0.08898)
       p02 =    -0.03084  (-0.05039, -0.01129)
       p21 =     0.02091  (0.001372, 0.04044)
       p12 =     -0.0321  (-0.05164, -0.01255)
       p03 =      0.1216  (0.09929, 0.1439)
绘图:
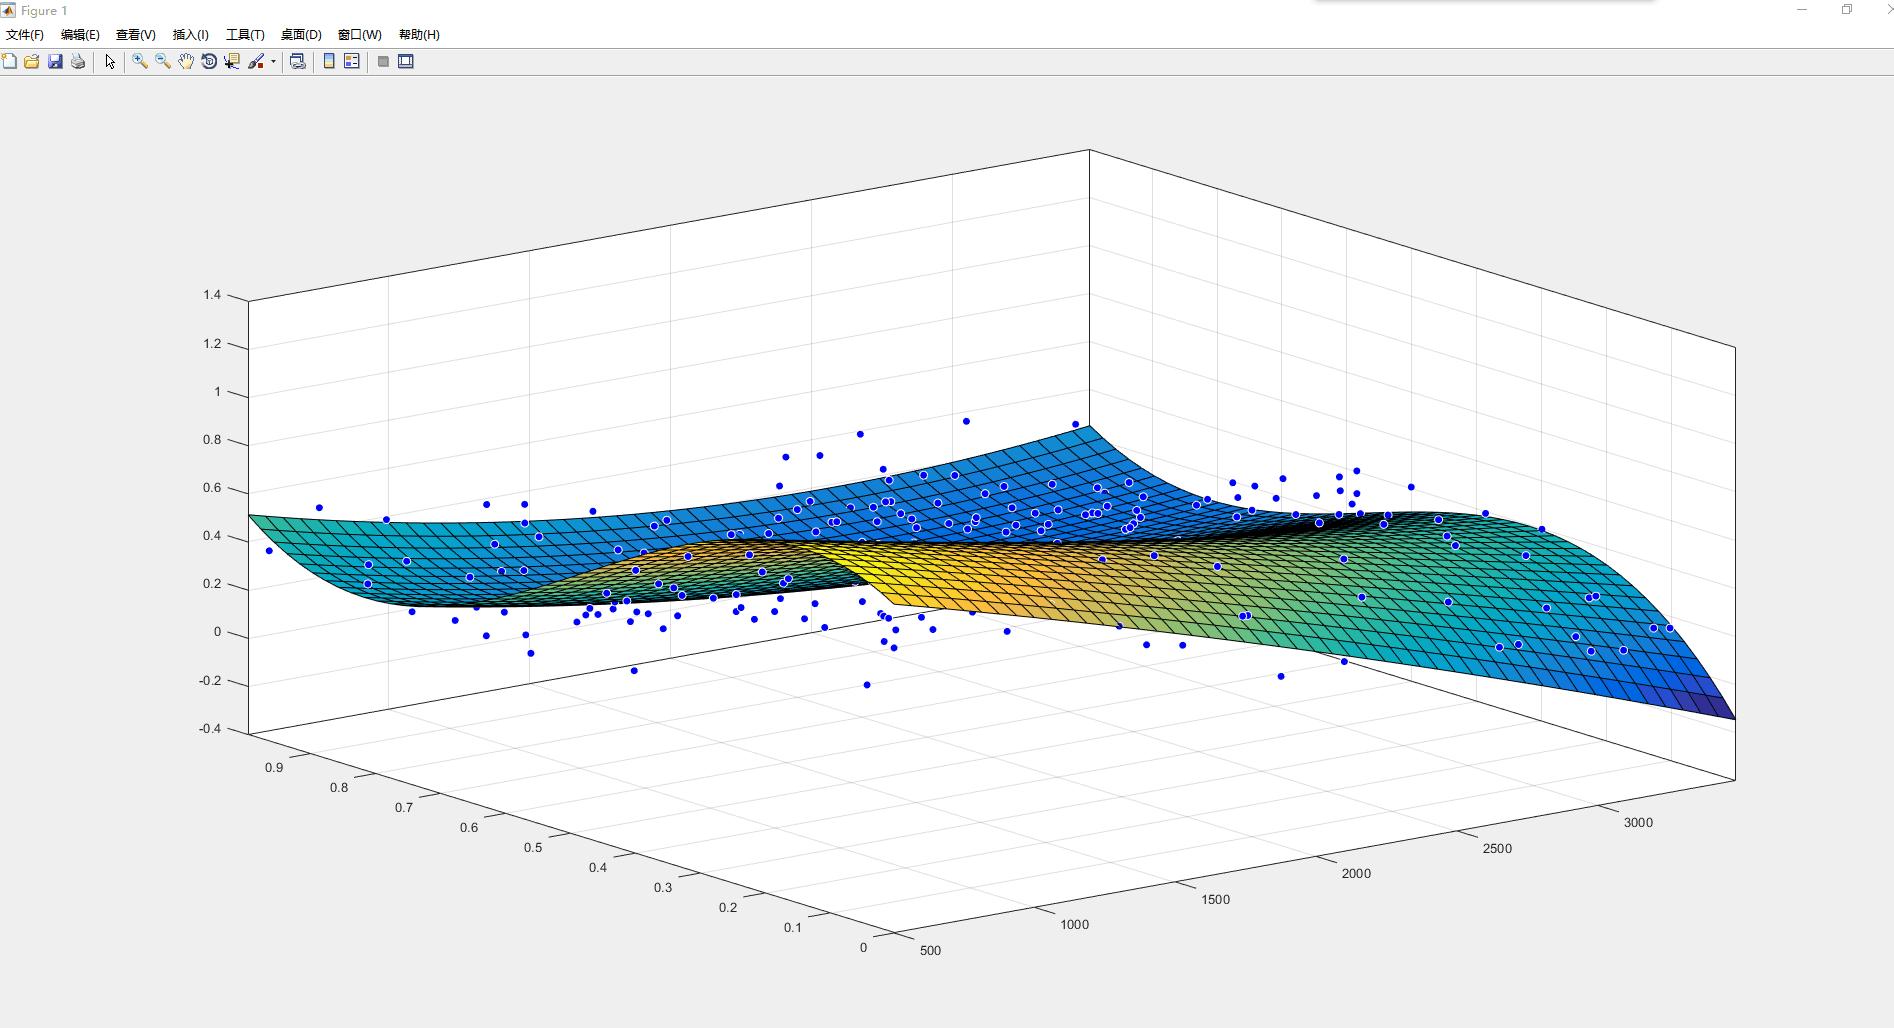
绘制拟合、数据、残差和预测界限
plot(surffit,[x,y],z)

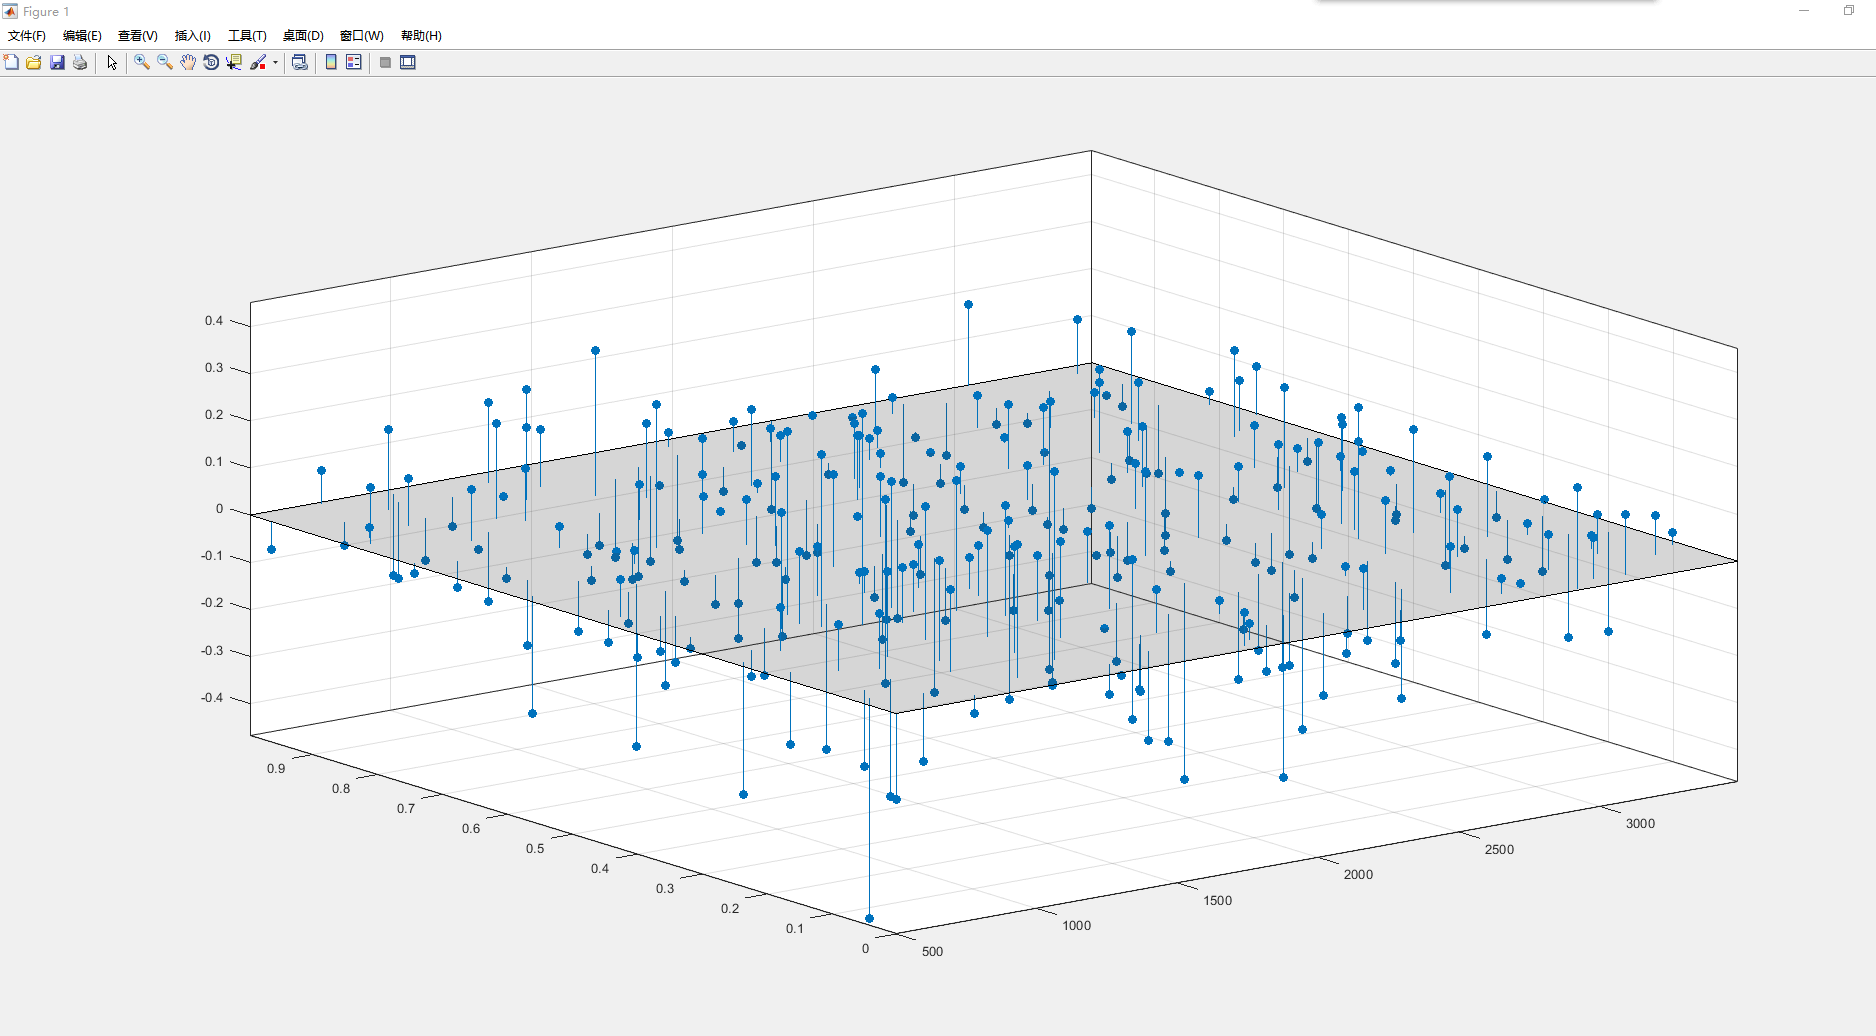
绘制残差拟合图。
plot(surffit,[x,y],z,'Style','Residuals')

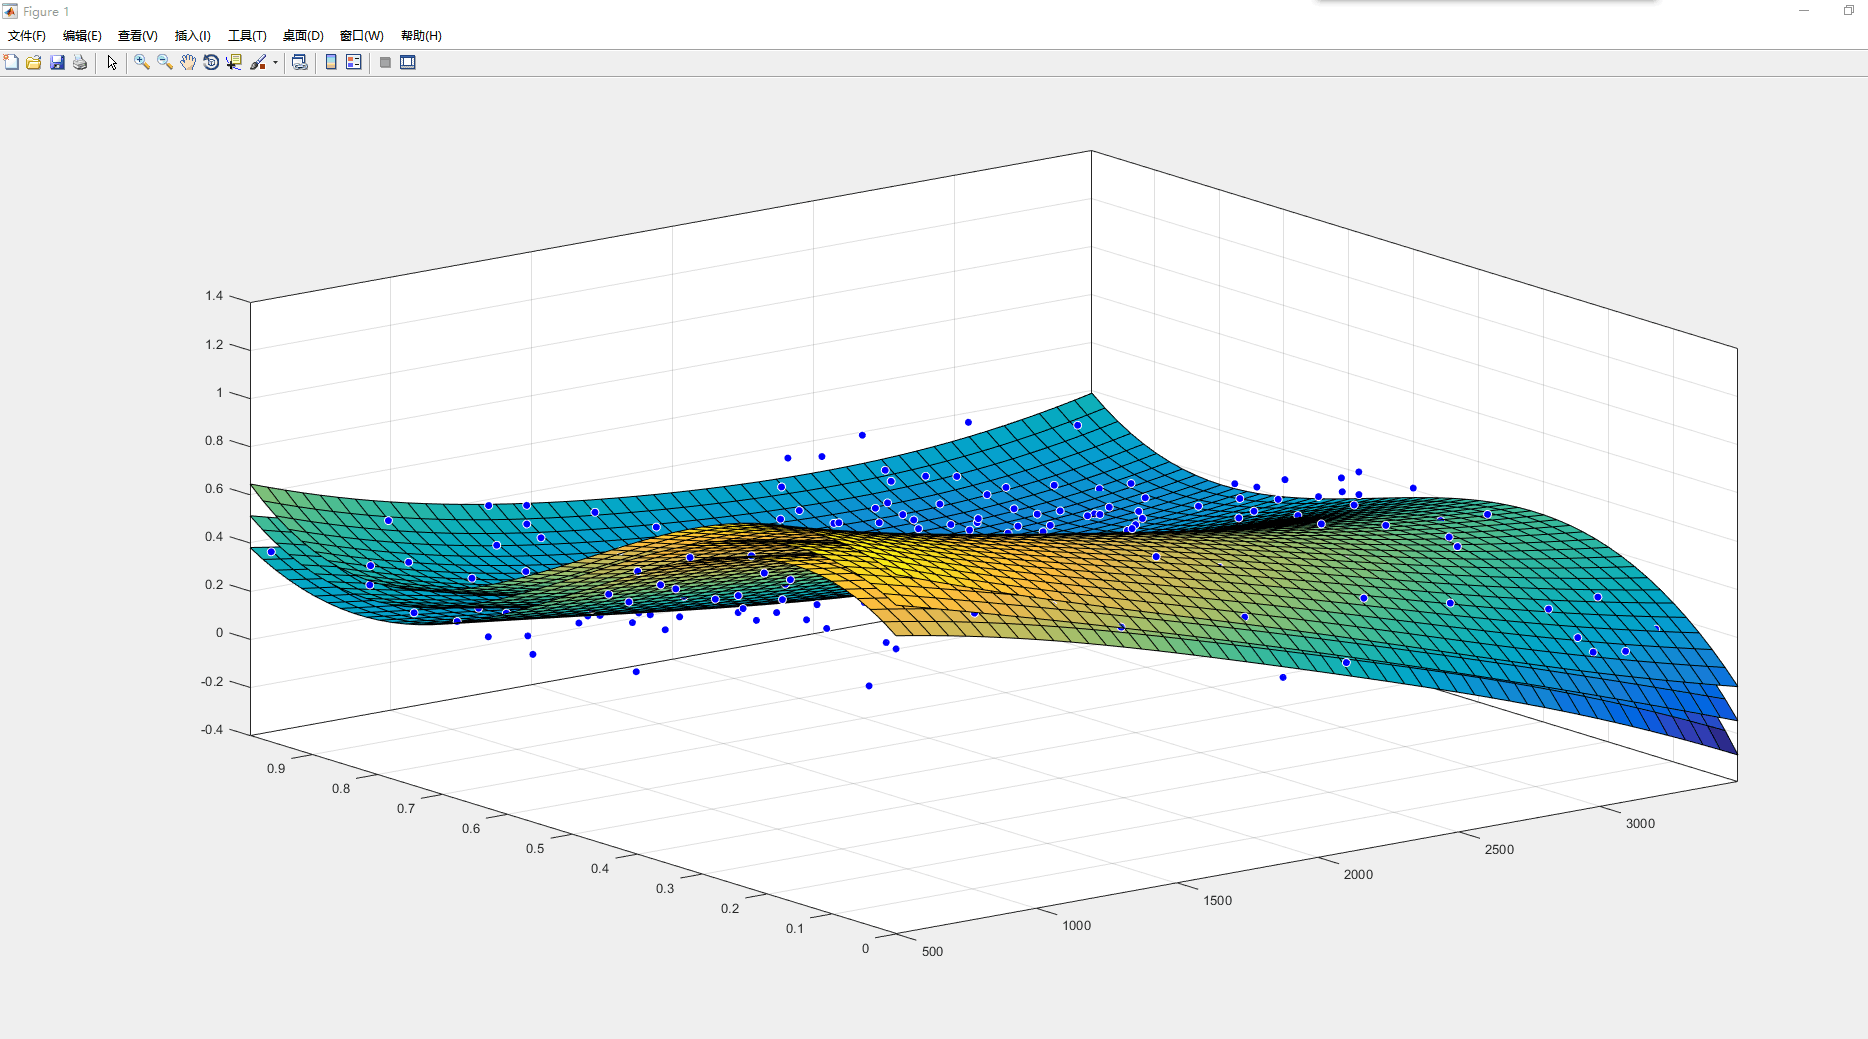
在拟合上绘制预测边界。
plot(surffit,[x,y],z,'Style','predfunc')

在指定点评估拟合度
通过指定x和y的值,使用以下形式评估特定点的拟合:z=fittedmodel(x,y)。
surffit(1000,0.5)
输出:
ans =

    0.5673
在多个点评估拟合值
xi = [500;1000;1200];
yi = [0.7;0.6;0.5];
surffit(xi,yi)
输出:
ans =

    0.3771
    0.4064
    0.5331
获取这些值的预测范围。
[ci, zi] = predint(surffit,[xi,yi])
输出:
ci =

    0.0713    0.6829
    0.1058    0.7069
    0.2333    0.8330


zi =

    0.3771
    0.4064
    0.5331
得到模型方程
输入拟合名称以显示模型方程、拟合系数和拟合系数的置信限。
surffit
输出:
     Linear model Poly23:
     surffit(x,y) = p00 + p10*x + p01*y + p20*x^2 + p11*x*y + p02*y^2 + p21*x^2*y
                    + p12*x*y^2 + p03*y^3
       where x is normalized by mean 1982 and std 868.6
       and where y is normalized by mean 0.4972 and std 0.2897
     Coefficients (with 95% confidence bounds):
       p00 =      0.4253  (0.3928, 0.4578)
       p10 =      -0.106  (-0.1322, -0.07974)
       p01 =     -0.4299  (-0.4775, -0.3822)
       p20 =     0.02104  (0.001457, 0.04062)
       p11 =     0.07153  (0.05409, 0.08898)
       p02 =    -0.03084  (-0.05039, -0.01129)
       p21 =     0.02091  (0.001372, 0.04044)
       p12 =     -0.0321  (-0.05164, -0.01255)
       p03 =      0.1216  (0.09929, 0.1439)
要仅获得模型方程,请使用公式。
formula(surffit)
输出:
ans =

p00 + p10*x + p01*y + p20*x^2 + p11*x*y + p02*y^2 + p21*x^2*y + p12*x*y^2 + p03*y^3
获取系数名称和值
按名称指定系数。
p00 = surffit.p00
输出:
p00 =

    0.4253
p03 = surffit.p03
输出:
p03 =

    0.1216
获取所有的系数名称。看看拟合方程(例如,f(x,y)=p00+p10*x…)查看每个系数的模型项。
coeffnames(surffit)
输出:
ans =

    'p00'
    'p10'
    'p01'
    'p20'
    'p11'
    'p02'
    'p21'
    'p12'
    'p03'
获取所有的系数值。
coeffvalues(surffit)
输出:
ans =

    0.4253   -0.1060   -0.4299    0.0210    0.0715   -0.0308    0.0209   -0.0321    0.1216
得到系数的置信区间
使用系数的置信区间来帮助您评估和比较拟合。系数的置信区间决定了它们的准确性。相距很远的界限表示不确定性。如果线性系数的边界超过零,这意味着您无法确保这些系数与零不同。如果一些模型项的系数为零,那么它们对拟合没有帮助。
confint(surffit)
输出:
ans =

    0.3928   -0.1322   -0.4775    0.0015    0.0541   -0.0504    0.0014   -0.0516    0.0993
    0.4578   -0.0797   -0.3822    0.0406    0.0890   -0.0113    0.0404   -0.0126    0.1439
列出 surffit 的方法
methods(surffit)
输出:
类 sfit 的方法:

argnames       confint        fitoptions     numargs        probnames      sfit
category       dependnames    formula        numcoeffs      probvalues     type
coeffnames     differentiate  indepnames     plot           quad2d
coeffvalues    feval          islinear       predint        setoptions
参考:https://ww2.mathworks.cn/help/curvefit/evaluate-a-surface-fit.html
#################################
