• Echarts-2.2.7中统计出来的统计图保存为图片


    今天在做一个图形报表,有个需求是要把展现的统计图保存为图片, 图形报表用的Echarts-2.2.7,

    以前有用过 Echarts,记得echarts插件是可以帮助我们把统计图保存为图片的。

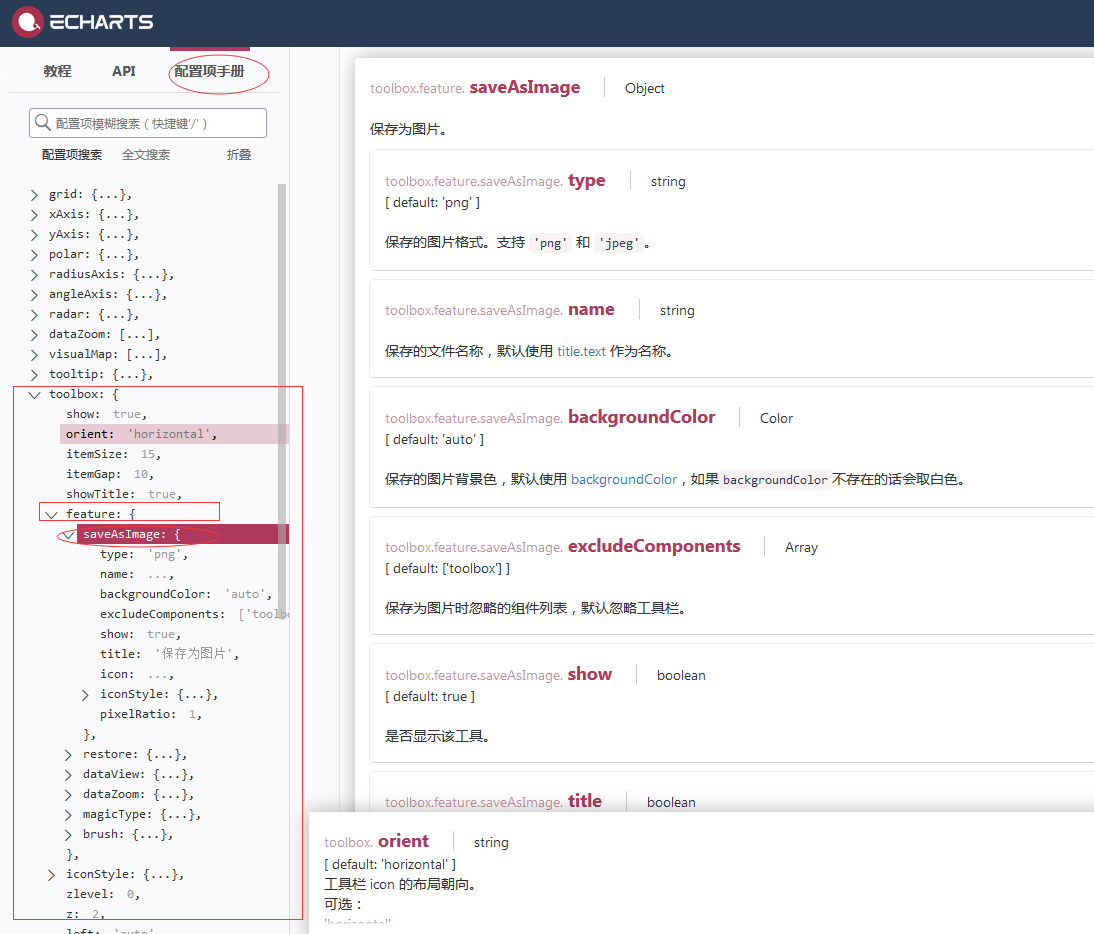
    只是不记得是怎么配置了,查看API文档很久也没有找到,最后在 文档/配置项手册 里面找到了配置方法 和配置 参数。

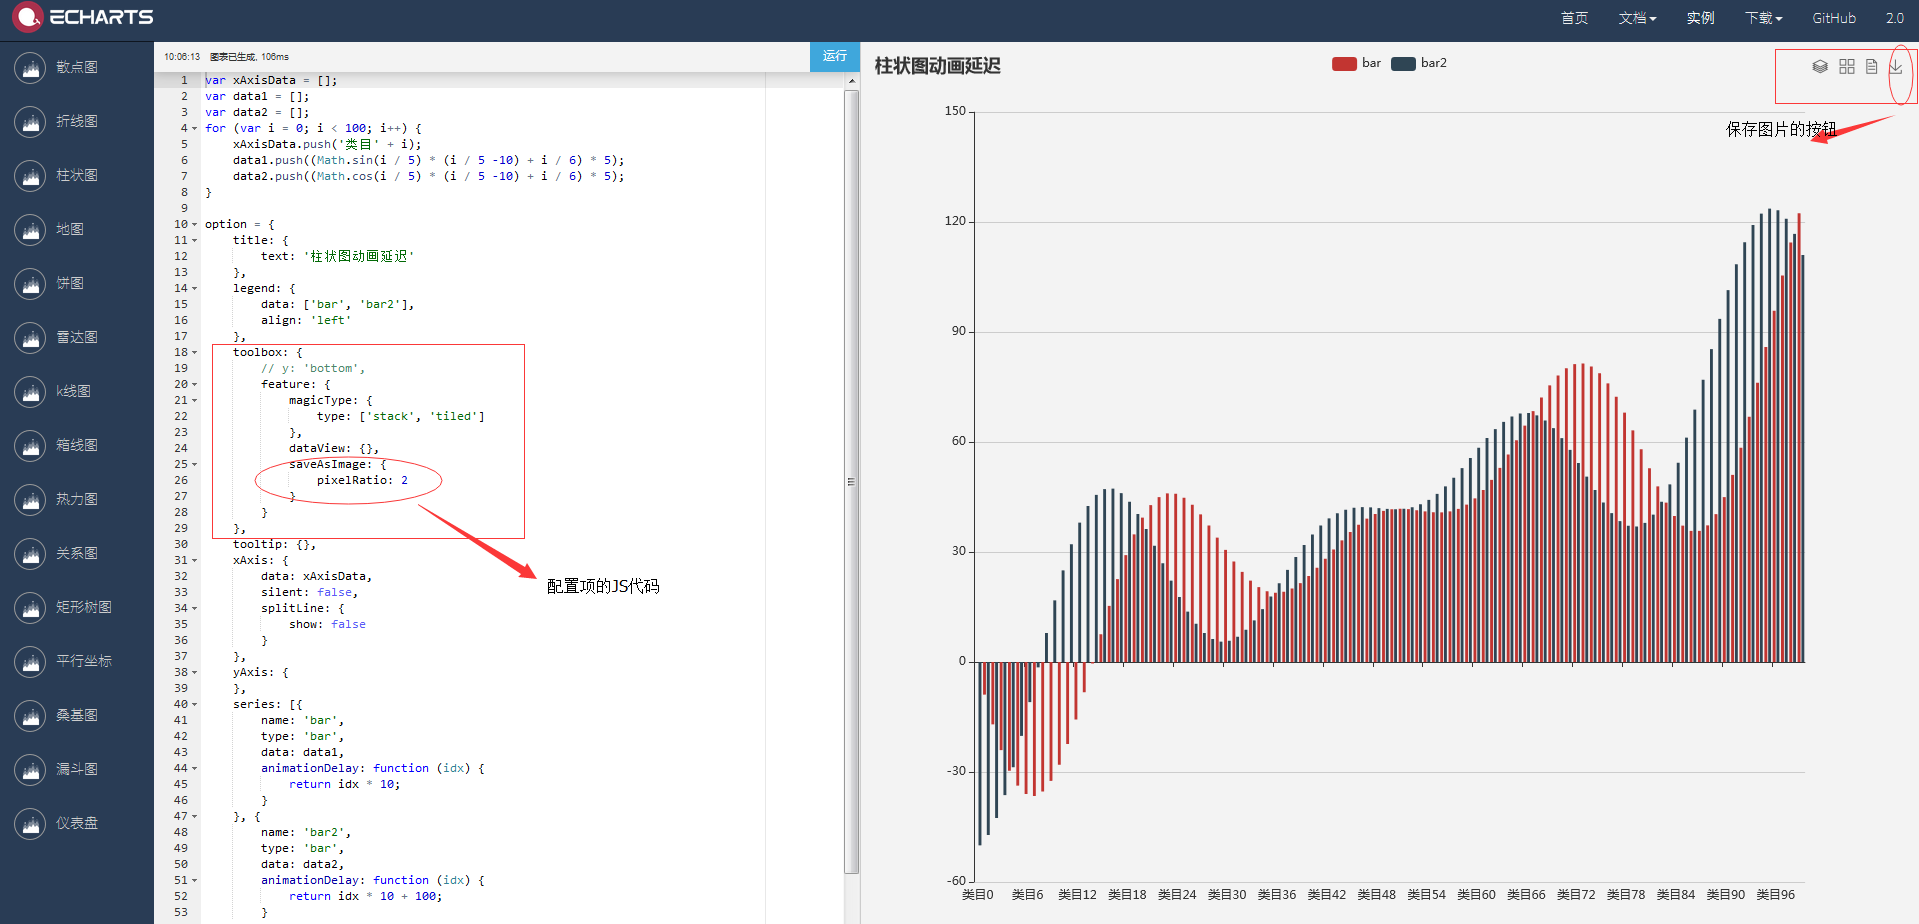
    下图是 Echarts官网 实例中的配置:

    下面来说说配置保存图片的步骤:

    1.保存图片是Echarts的一个工具,先找到工具箱


    toolbox

    工具栏。内置有导出图片数据视图动态类型切换数据区域缩放重置五个工具。

    2. 然后再找到 各工具的配置项


    toolbox.feature Object
     

    各工具配置项。

    除了各个内置的工具按钮外,还可以自定义工具按钮。

    3. 再找到保存图片的配置

    toolbox.feature.saveAsImage Object

    保存为图片。

    4. 再看到了保存图片的配置项有的属性 和可填 参数

    toolbox.feature.saveAsImage.type string
    [ default: 'png' ]

    保存的图片格式。支持 'png''jpeg'

    toolbox.feature.saveAsImage.name string
     

    保存的文件名称,默认使用 title.text 作为名称。

    toolbox.feature.saveAsImage.backgroundColor Color
    [ default: 'auto' ]

    保存的图片背景色,默认使用 backgroundColor,如果backgroundColor不存在的话会取白色。

    toolbox.feature.saveAsImage.excludeComponents Array
    [ default: ['toolbox'] ]

    保存为图片时忽略的组件列表,默认忽略工具栏。

    toolbox.feature.saveAsImage.show boolean
    [ default: true ]

    是否显示该工具。

    toolbox.feature.saveAsImage.title boolean
    [ default: '保存为图片' ]
    toolbox.feature.saveAsImage.icon *
     

    Icon 的 path 字符串,ECharts 3 中支持使用自定义的 svg path 作为 icon,格式参见 SVG PathData。可以从 Adobe Illustrator 等工具编辑导出。

     
    toolbox.feature.saveAsImage.iconStyle Object
     

    保存为图片 icon 样式设置。

    toolbox.feature.saveAsImage.pixelRatio number
    [ default: 1 ]

    保存图片的分辨率比例,默认跟容器相同大小,如果需要保存更高分辨率的,可以设置为大于 1 的值,例如 2。

    5. 然后根据 自己的需求去配置就好了

    6.查看文档库 截图

    7. 项目的 JS 代码

    require(
                              [
                               'echarts',
                               'echarts/chart/bar'   // 按需加载所需图表
                               ],
                               function (ec) {
                                // 基于准备好的dom,初始化echarts图表
                                var myChart1 = ec.init(document.getElementById('pro-price-main'));
                                option1 = {
                                     title : {
                                        text: '文档数量(单位:个)',
                                        textStyle: {
                                            fontWeight: 'normal',
                                            fontSize: '15',
                                            color: '#999'
                                        },
                                        x: 54
                                    },
                                    tooltip : {
                                        show: true,
                                        trigger: 'item',
                                    },
                                    legend: {
                                        x: 'center',
                                        y: 0,
                                        orient : 'horizontal',
                                        itemGap: 20,
                                        itemWidth: 30,
                                        itemHeight : 20,
                                        textStyle: {
                                            color: '#999'
                                        },
                                        data:['文库总数','文库增长数']
                                    },
                                    toolbox: {
                                        show: true,
                                        feature: {
                                            magicType: {
                                                type: ['stack', 'tiled']
                                            },
                                            dataView: {show:true},
                                            saveAsImage: {
                                                show:true,
                                                excludeComponents :['toolbox'],
                                                pixelRatio: 2
                                                
                                            }
                                        }
                                    },
                                    calculable : true,
                                   
                                    xAxis : [
                                        {
                                            type : 'category',
                                            show: true,
                                            splitLine: false,
                                            axisLine: {
                                                lineStyle: {
                                                    1,
                                                    color: '#f2f2f2'
                                                }
                                            },
                                            axisLabel: {
                                                textStyle: {
                                                    align: 'center',
                                                    color: '#999'
                                                }
                                            },
                                            axisTick: {
                                                show: false
                                            },
                                            data : result.results["docMonthData"]  
                                        }
                                    ],
                                    yAxis : [
                                        {
                                            type : 'value',
                                            show: true,
                                            splitLine: {
                                                lineStyle: {
                                                    color: ['#f2f2f2'],
                                                    1,
                                                }
                                            },
                                            axisLine: {
                                                lineStyle: {
                                                    1,
                                                    color: '#f2f2f2'
                                                }
                                            },
                                            axisLabel: {
                                                textStyle: {
                                                    color: '#999'
                                                }
                                            }
                                        }
                                    ],
                                    series : [
                                        {
                                            name:'文库总数',
                                            type:'bar',
                                            stack: '总量',
                                            data: result.results["docTotalData"],
                                            itemStyle: {
                                                normal: {
                                                    color: '#7266ba'
                                                }
                                            }
                                        },
                                        {
                                            name:'文库增长数',
                                            type:'bar',
                                            stack: '总量',
                                            itemStyle: {                // 系列级个性化
                                                normal: {
                                                    color: '#f9d21a'
                                                }
                                            },
                                            data: result.results["growthNumData"]
                                        }
                                    ]
                                };
                                // 为echarts对象加载数据
                                myChart1.setOption(option1);
                              }
                          );

  • 相关阅读:
    Codeforces Round #706 (Div. 2)
    Caddi Programming Contest 2021(AtCoder Beginner Contest 193)
    [ARC116] Deque Game
    Codeforces Round #721 (Div. 2)
    Codeforces Round #618 (Div. 1)
    Educational Codeforces Round 109 (Rated for Div. 2)
    [ABC201F] Insertion Sort
    AtCoder Regular Contest 119
    Codeforces Global Round 13
    Codeforces Round #673 (Div. 1)
  • 原文地址:https://www.cnblogs.com/heganlin/p/5764040.html
Copyright © 2020-2023  润新知