import keras
print(keras.__version__)
2.7.0
from keras import Sequential
from keras.datasets import mnist
from keras.layers import Conv2D, MaxPooling2D, Dropout, Flatten, Dense
from keras.utils import np_utils
from tensorflow.keras.optimizers import RMSprop
import matplotlib.pyplot as plt
数据预处理
# 一些参数
batch_size = 128
epochs = 10
num_classes = 10
img_rows, img_cols = 28, 28
input_shape = (img_rows, img_cols, 1)   # 输入数据形状

# 获取数据
(x_train, y_train), (x_test, y_test) = mnist.load_data()

# 归一化
x_train = x_train.astype('float32') / 255.0
x_test = x_test.astype('float32') / 255.0

# 改变数据形状,格式为(n_samples, rows, cols, channels)
x_train = x_train.reshape(x_train.shape[0], img_rows, img_cols, 1)
x_test = x_test.reshape(x_test.shape[0], img_rows, img_cols, 1)

# 控制台打印输出样本数量信息
print(x_train.shape[0], 'train samples')
print(x_test.shape[0], 'test samples')
60000 train samples
10000 test samples
one-hot 编码
https://blog.csdn.net/dulingtingzi/article/details/51374487
# 样本标签转化为one-hot编码格式
y_train = np_utils.to_categorical(y_train, num_classes)
y_test = np_utils.to_categorical(y_test, num_classes)
创建CNN模型
顺序模型 (Keras提供的模型为两类:Sequential 顺序模型;Model 类模型)
https://blog.csdn.net/weixin_42886817/article/details/99831718
model = Sequential()
过滤 卷积核 激活函数 输入形状
model.add(Conv2D(filters=32, kernel_size=(3, 3), activation='relu',input_shape=input_shape))
model.add(Conv2D(filters=64, kernel_size=(3, 3), activation='relu'))# 卷积核 3*3
最大池化 MaxPooling
model.add(MaxPooling2D(pool_size=(2, 2)))
防止过拟合 Dropout
model.add(Dropout(rate=0.2))
model.add(Flatten())#填充空白区域
全连接层 Dense,激活函数 relu
model.add(Dense(units=128, activation='relu'))
model.add(Dropout(rate=0.5))
softmax分类
model.add(Dense(num_classes, activation='softmax'))
在控制台输出模型参数信息
model.summary()
Model: "sequential"
_________________________________________________________________
 Layer (type)                Output Shape              Param #
=================================================================
 conv2d (Conv2D)             (None, 26, 26, 32)        320

 conv2d_1 (Conv2D)           (None, 24, 24, 64)        18496

 max_pooling2d (MaxPooling2D  (None, 12, 12, 64)       0
 )

 dropout (Dropout)           (None, 12, 12, 64)        0

 flatten (Flatten)           (None, 9216)              0

 dense (Dense)               (None, 128)               1179776

 dropout_1 (Dropout)         (None, 128)               0

 dense_1 (Dense)             (None, 10)                1290

=================================================================
Total params: 1,199,882
Trainable params: 1,199,882
Non-trainable params: 0
_________________________________________________________________
学习率(步长): 分别测试 learning_rate=0.1 和 0.01 ,观察实验结果
损失函数 交叉熵损失函数:categorical_crossentropy
rmsprop = RMSprop(learning_rate=0.01, rho=0.9, epsilon=1e-08, decay=0.0)
# 学习率learning_rate
# rho:大或等于0的浮点数
# epsilon:大或等于0的小浮点数,防止除0错误

model.compile(loss=keras.losses.categorical_crossentropy,
              optimizer=rmsprop,
              metrics=['accuracy'])
训练模型
# 训练模型
model.fit(x_train, y_train,
          batch_size=batch_size,
          epochs=epochs,
          verbose=1,
          validation_data=(x_test, y_test))
Epoch 1/10
469/469 [==============================] - 99s 208ms/step - loss: 0.2891 - accuracy: 0.9191 - val_loss: 0.1135 - val_accuracy: 0.9717
Epoch 2/10
469/469 [==============================] - 99s 211ms/step - loss: 0.1171 - accuracy: 0.9682 - val_loss: 0.0558 - val_accuracy: 0.9847
Epoch 3/10
469/469 [==============================] - 100s 214ms/step - loss: 0.1118 - accuracy: 0.9710 - val_loss: 0.0601 - val_accuracy: 0.9837
Epoch 4/10
469/469 [==============================] - 100s 212ms/step - loss: 0.1121 - accuracy: 0.9713 - val_loss: 0.0763 - val_accuracy: 0.9823
Epoch 5/10
469/469 [==============================] - 100s 213ms/step - loss: 0.1144 - accuracy: 0.9723 - val_loss: 0.0537 - val_accuracy: 0.9864
Epoch 6/10
469/469 [==============================] - 100s 214ms/step - loss: 0.1250 - accuracy: 0.9709 - val_loss: 0.0687 - val_accuracy: 0.9870
Epoch 7/10
469/469 [==============================] - 100s 213ms/step - loss: 0.1359 - accuracy: 0.9700 - val_loss: 0.0571 - val_accuracy: 0.9869
Epoch 8/10
469/469 [==============================] - 100s 214ms/step - loss: 0.1342 - accuracy: 0.9702 - val_loss: 0.1563 - val_accuracy: 0.9809
Epoch 9/10
469/469 [==============================] - 101s 214ms/step - loss: 0.1493 - accuracy: 0.9682 - val_loss: 0.0715 - val_accuracy: 0.9860
Epoch 10/10
469/469 [==============================] - 100s 212ms/step - loss: 0.1498 - accuracy: 0.9673 - val_loss: 0.0730 - val_accuracy: 0.9808


<keras.callbacks.History at 0x17db07a0f40>
预测
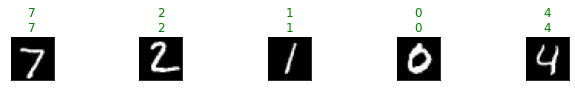
n = 5   # 给出需要预测的图片数量,为了方便,只取前5张图片
predicted_number = model.predict(x_test[:n], n)
画图
# 画图
plt.figure(figsize=(10, 3))
for i in range(n):
    plt.subplot(1, n, i + 1)
    t = x_test[i].reshape(28, 28)   # 向量需要reshape为矩阵
    plt.imshow(t, cmap='gray')      # 以灰度图显示
    plt.subplots_adjust(wspace=2)   # 调整子图间的间距,挨太紧了不好看
    # 第一个数字是真实标签,第二个数字是预测数值
    # 如果预测正确,绿色显示,否则红色显示
    # 预测结果是one-hot编码,需要转化为数字
    if y_test[i].argmax() == predicted_number[i].argmax():
        plt.title('%d\n%d' % (y_test[i].argmax(), predicted_number[i].argmax()), color='green')
    else:
        plt.title('%d,%d' % (y_test[i].argmax(), predicted_number[i].argmax()), color='red')
    plt.xticks([])  # 取消x轴刻度
    plt.yticks([])
plt.show()