一、前言
本文主要使用matplotlib,实现双纵轴坐标的图表绘制。笔者python版本为2.7.15。
二、实践及效果
1. 需求
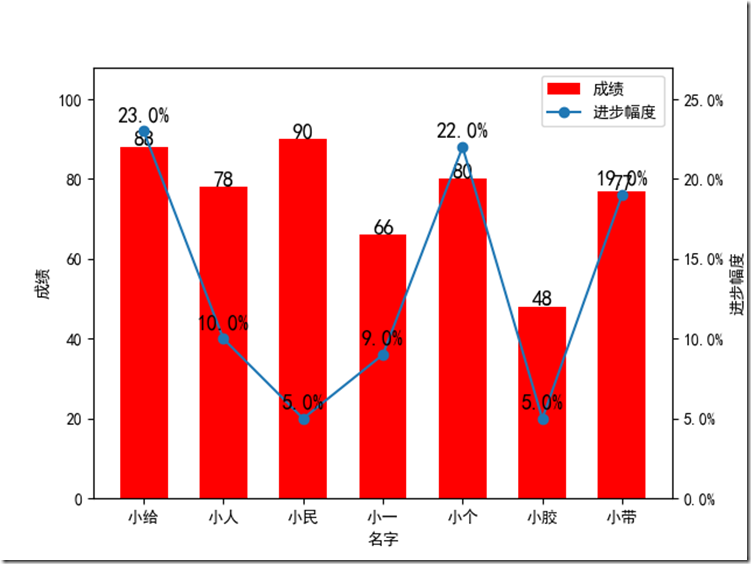
某个有这么一个成绩表,分别是名字,本次成绩以及进步幅度,现在需要把这个成绩单转为这样一个图表:
横轴是同学姓名,成绩用直方图表示,进步幅度用折线图表示,他们公用同一个横轴。
|
姓名 |
本次成绩 |
进步幅度 |
|
小给 |
88 |
23% |
|
小人 |
78 |
10% |
|
小民 |
90 |
5% |
|
小一 |
66 |
9% |
|
小个 |
80 |
22% |
|
小胶 |
48 |
5% |
|
小带 |
77 |
19% |
2. 核心函数Axes.twinx()
搬运官网的说明:
Create a twin Axes sharing the xaxis
Create a new Axes instance with an invisible x-axis and an independent y-axis positioned opposite to the original one (i.e. at right). The x-axis autoscale setting will be inherited from the original Axes.
大意就是使用这个函数,在原来的坐标系中新建一个共享x轴的双胞胎坐标系,类似的还有twiny。
3. 实现代码
#-*- coding:utf-8 -*-
import numpy as np
import matplotlib.pyplot as plt
import matplotlib.ticker as mtick

def main():
    plt.rcdefaults()
    plt.rcParams['font.sans-serif'] = ['SimHei'] # 指定默认字体
    plt.rcParams['axes.unicode_minus'] = False   # 解决保存图像是负号'-'显示为方块的问题

    info_list = [(u"小给", 88, 23), (u"小人", 78, 10), (u"小民", 90, 5), (u"小一", 66, 9), (u"小个", 80, 22), (u"小胶", 48, 5), (u"小带", 77, 19)]
    positions = np.arange(len(info_list))
    names = [row[0] for row in info_list]
    scores = [row[1] for row in info_list]
    proges = [row[2] for row in info_list]

    fig, ax1 = plt.subplots()

    # 成绩直方图
    ax1.bar(positions, scores, width=0.6, align='center', color='r', label=u"成绩")
    ax1.set_xticks(positions)
    ax1.set_xticklabels(names)
    ax1.set_xlabel(u"名字")
    ax1.set_ylabel(u"成绩")
    max_score = max(scores)
    ax1.set_ylim(0, int(max_score * 1.2))
    # 成绩标签
    for x,y in zip(positions, scores):
        ax1.text(x, y + max_score * 0.02, y, ha='center', va='center', fontsize=13)

    # 变动折线图
    ax2 = ax1.twinx()
    ax2.plot(positions, proges, 'o-', label=u"进步幅度")
    max_proges = max(proges)
    # 变化率标签
    for x,y in zip(positions, proges):
        ax2.text(x, y + max_proges * 0.02, ('%.1f%%' %y), ha='center', va= 'bottom', fontsize=13)
    # 设置纵轴格式
    fmt = '%.1f%%'
    yticks = mtick.FormatStrFormatter(fmt)
    ax2.yaxis.set_major_formatter(yticks)
    ax2.set_ylim(0, int(max_proges * 1.2))
    ax2.set_ylabel(u"进步幅度")

    # 图例
    handles1, labels1 = ax1.get_legend_handles_labels()
    handles2, labels2 = ax2.get_legend_handles_labels()
    plt.legend(handles1+handles2, labels1+labels2, loc='upper right')

    plt.show()


if __name__ == '__main__':
    main()
Technorati Tags: python,matplotlib
4. 效果图
三、参考
1. matplotlib图例:api example code: two_scales.py
(完)
